-

Figure 1. Chlorophyll, carotenoid and Mg2+ content levels in leaves of L2025 and JHY. (a) Total chlorophyll content in leaves of two varieties; (b) Total carotenoid content in leaves of two varieties; (c) The carotenoid and chlorophyll content ratio in leaves of two varieties; (d) Total Mg2+ content in the leaves of the two varieties.
-

Figure 2. Functional annotation of unigenes in leaf transcriptomes of poplars among different samples. (a) Summary of the transcriptome DEGs. (b) The Volcano Plot of transcriptome DEGs. (c) GO classification of differentially expressed genes. (d) KOG classification of Acer rubrum transcripts. (e) KEGG enrichment of up-regulated genes. (f) KEGG enrichment of down-regulated genes
-
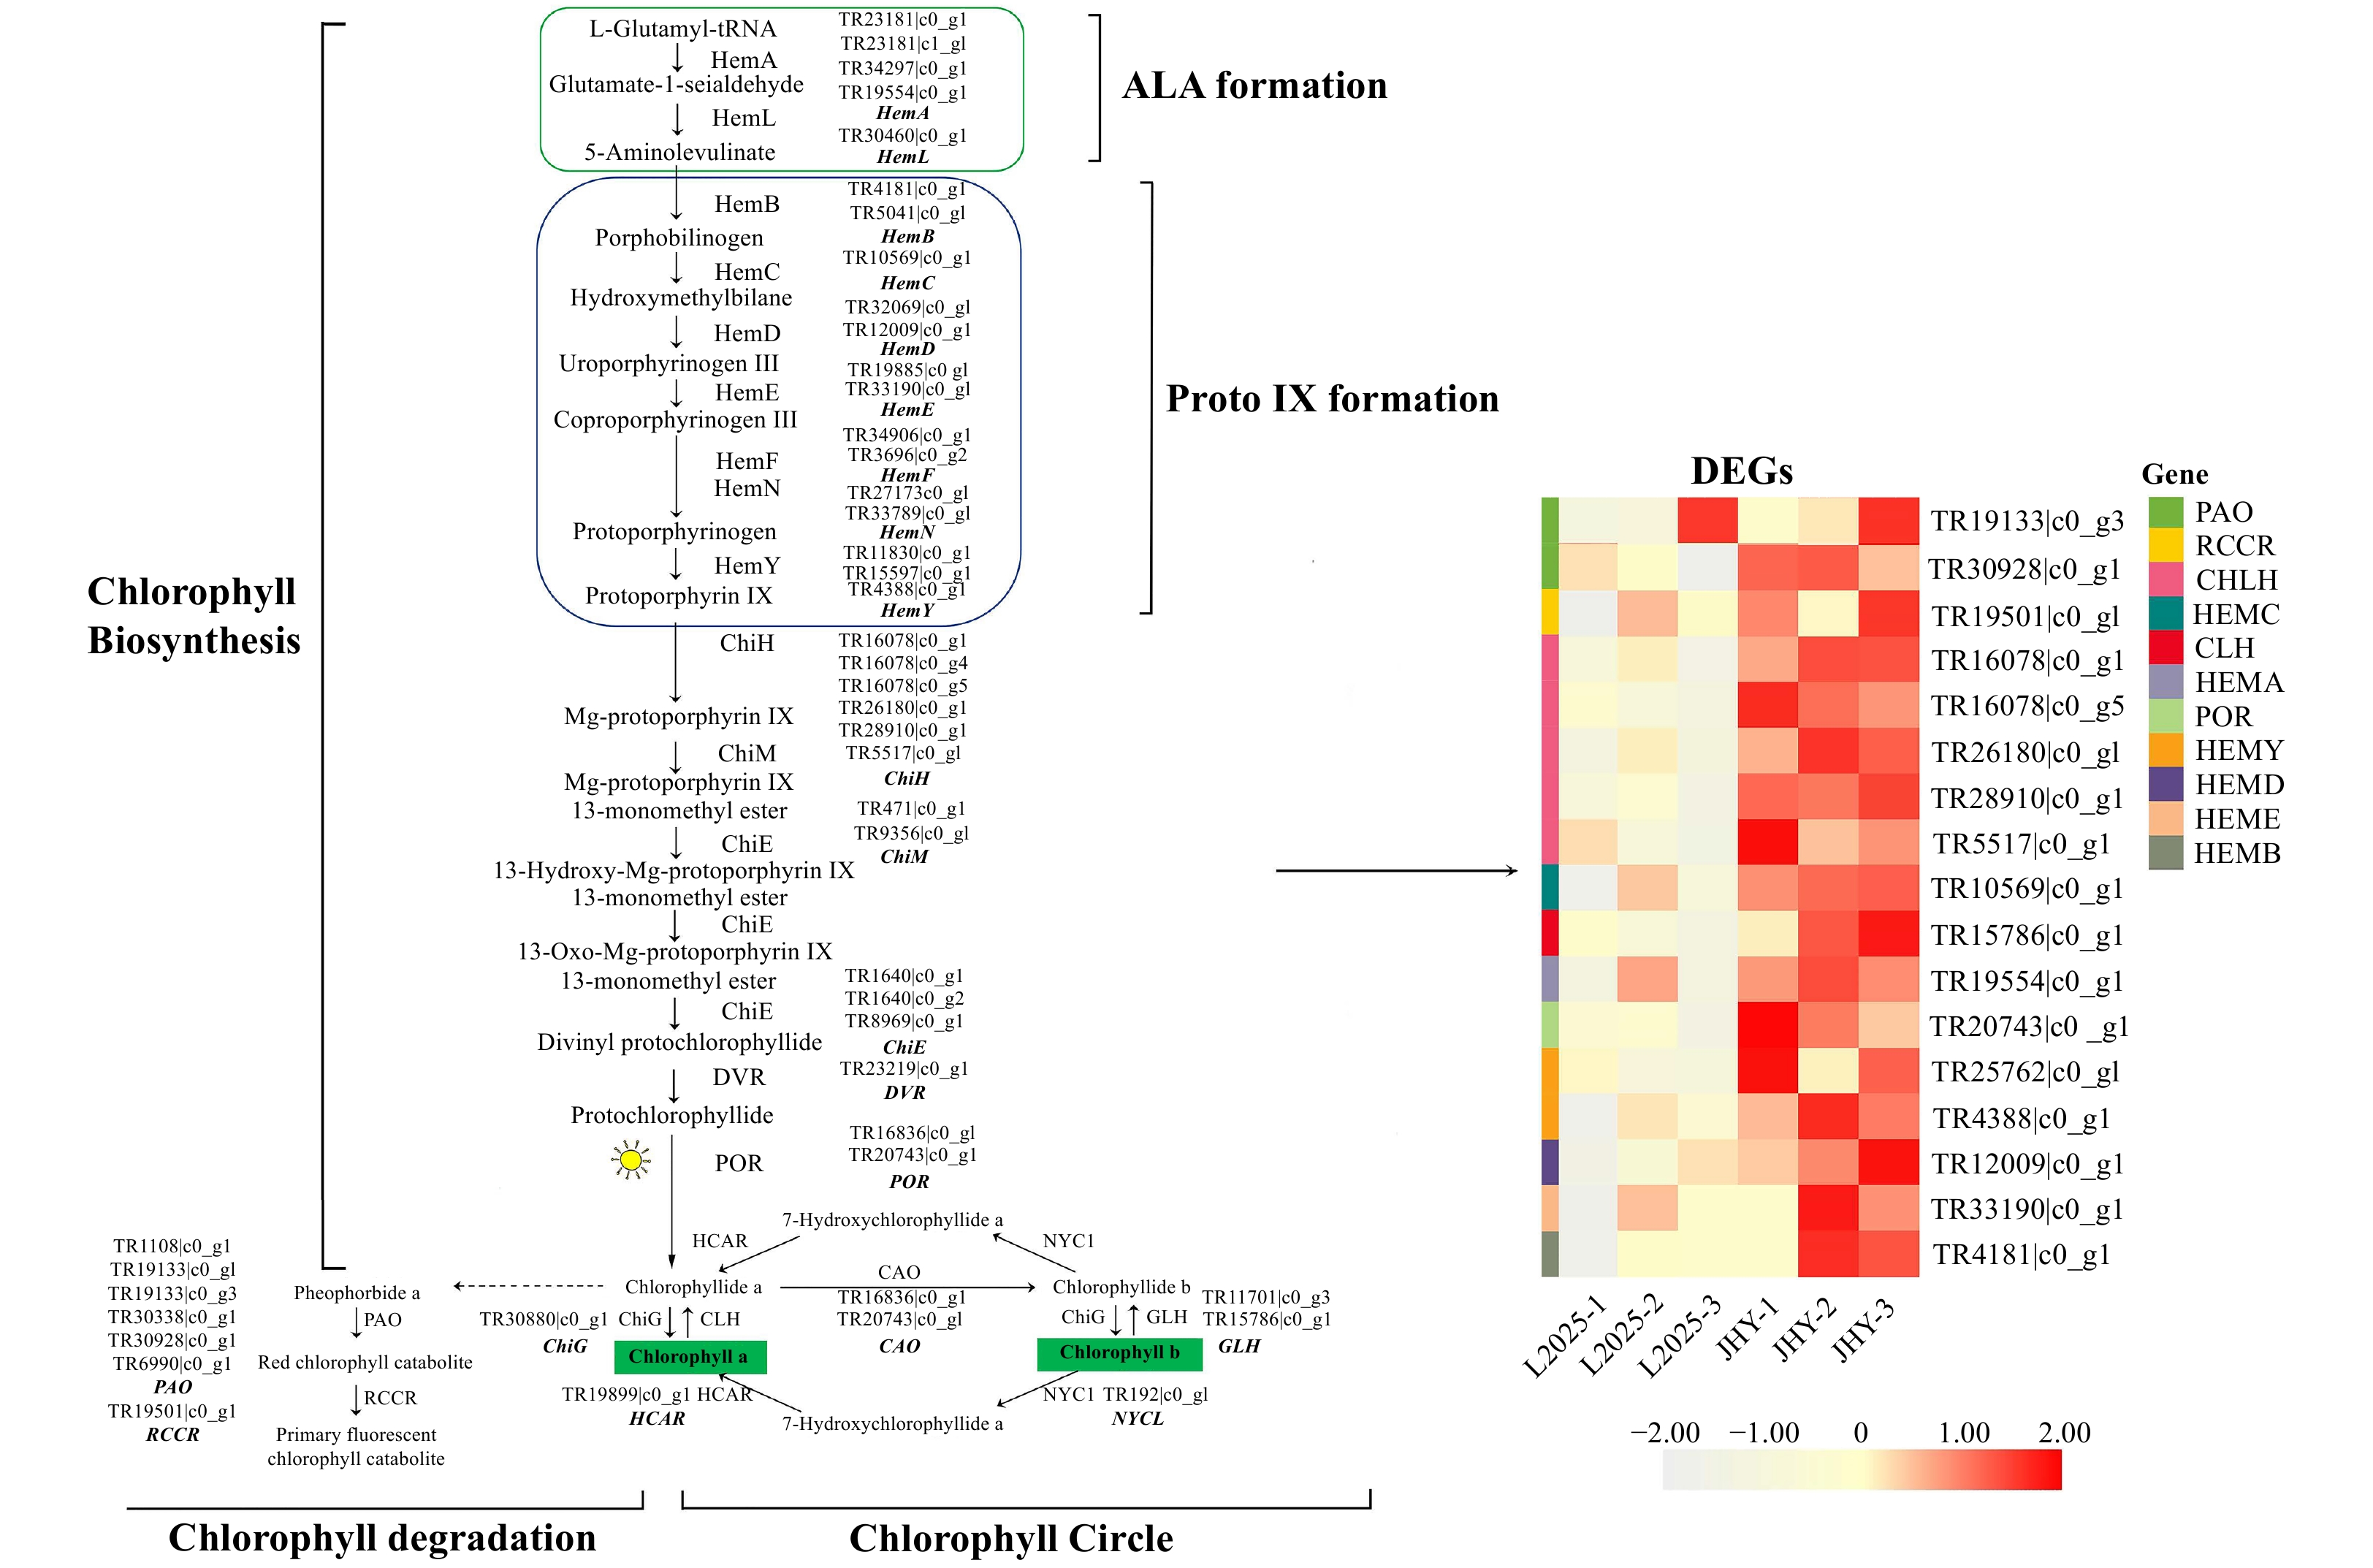
Figure 3. Differential expression of unigenes related to the chlorophyll metabolism pathway. The expression level was based on FPKM value. The darker the color, the higher the gene expression level.
-
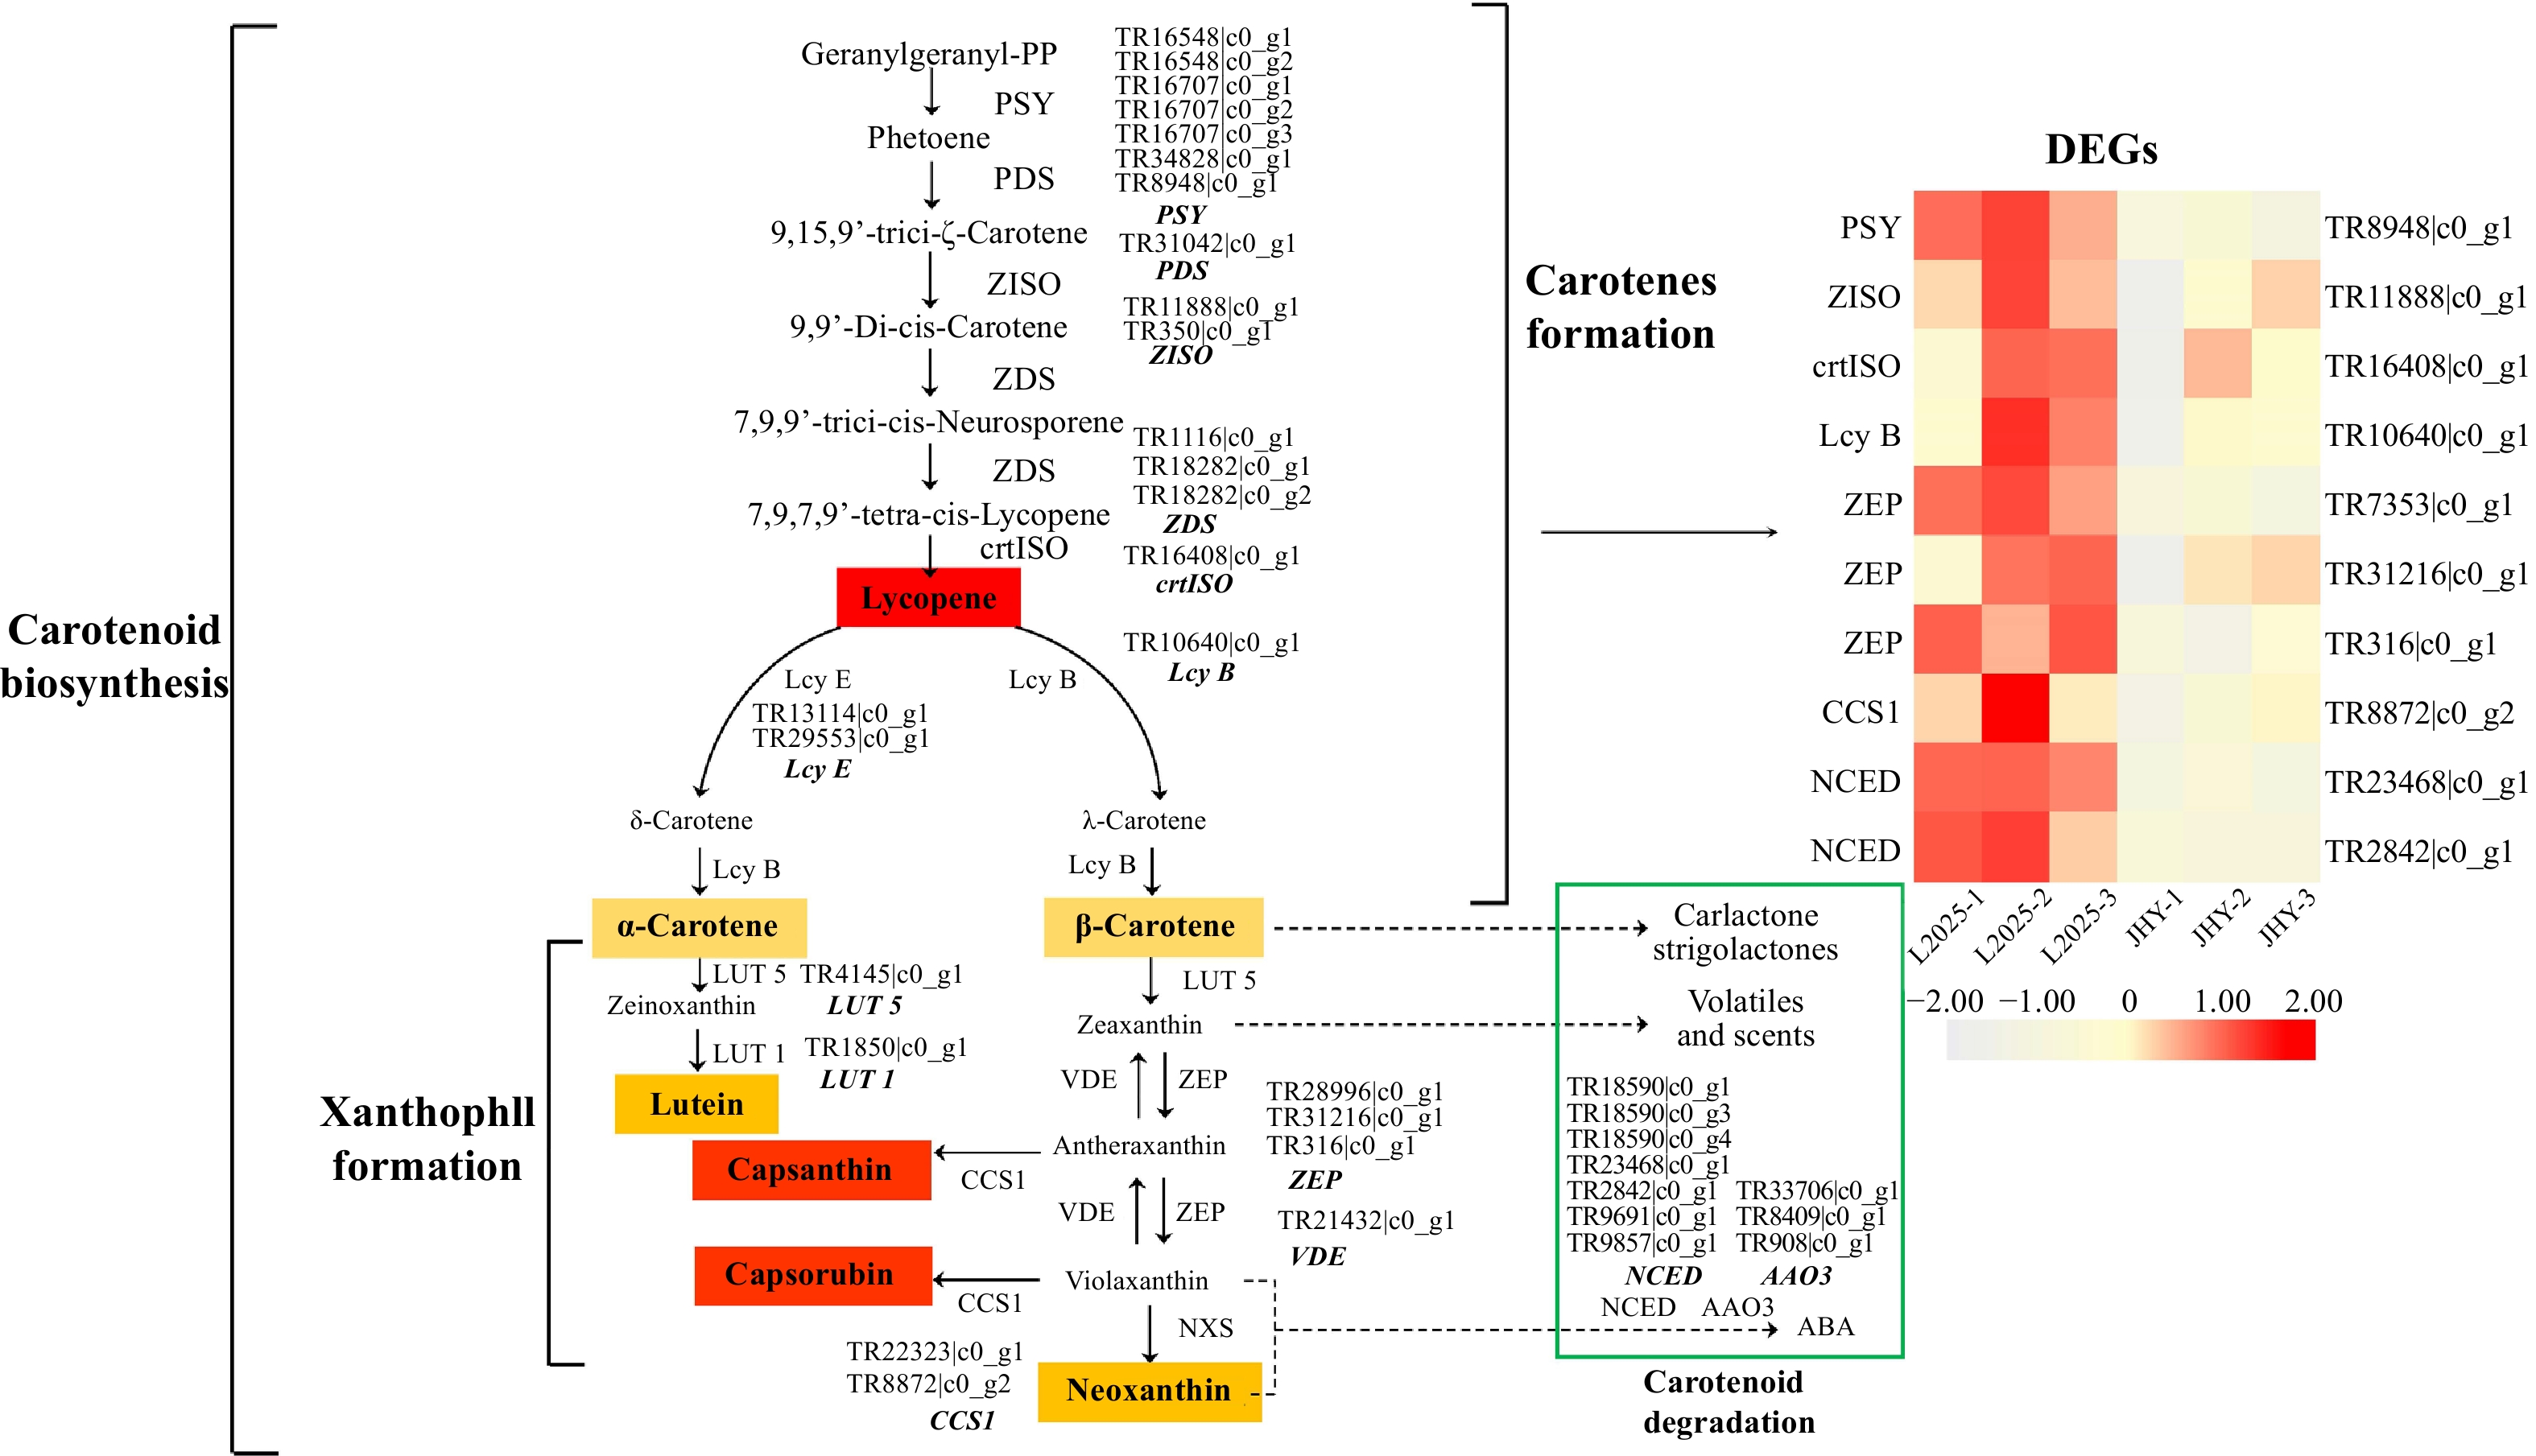
Figure 4. Differential expression of the unigenes related to carotenoid metabolism pathways. (The expression level was based on FPKM value. The darker the color, the higher the gene expression level.)
-

Figure 5. Differential expression of unigenes and metabolites related to the carotenoid metabolism pathway. (The expression level was based on FPKM value. The darker the color, the higher the gene expression level.)
-
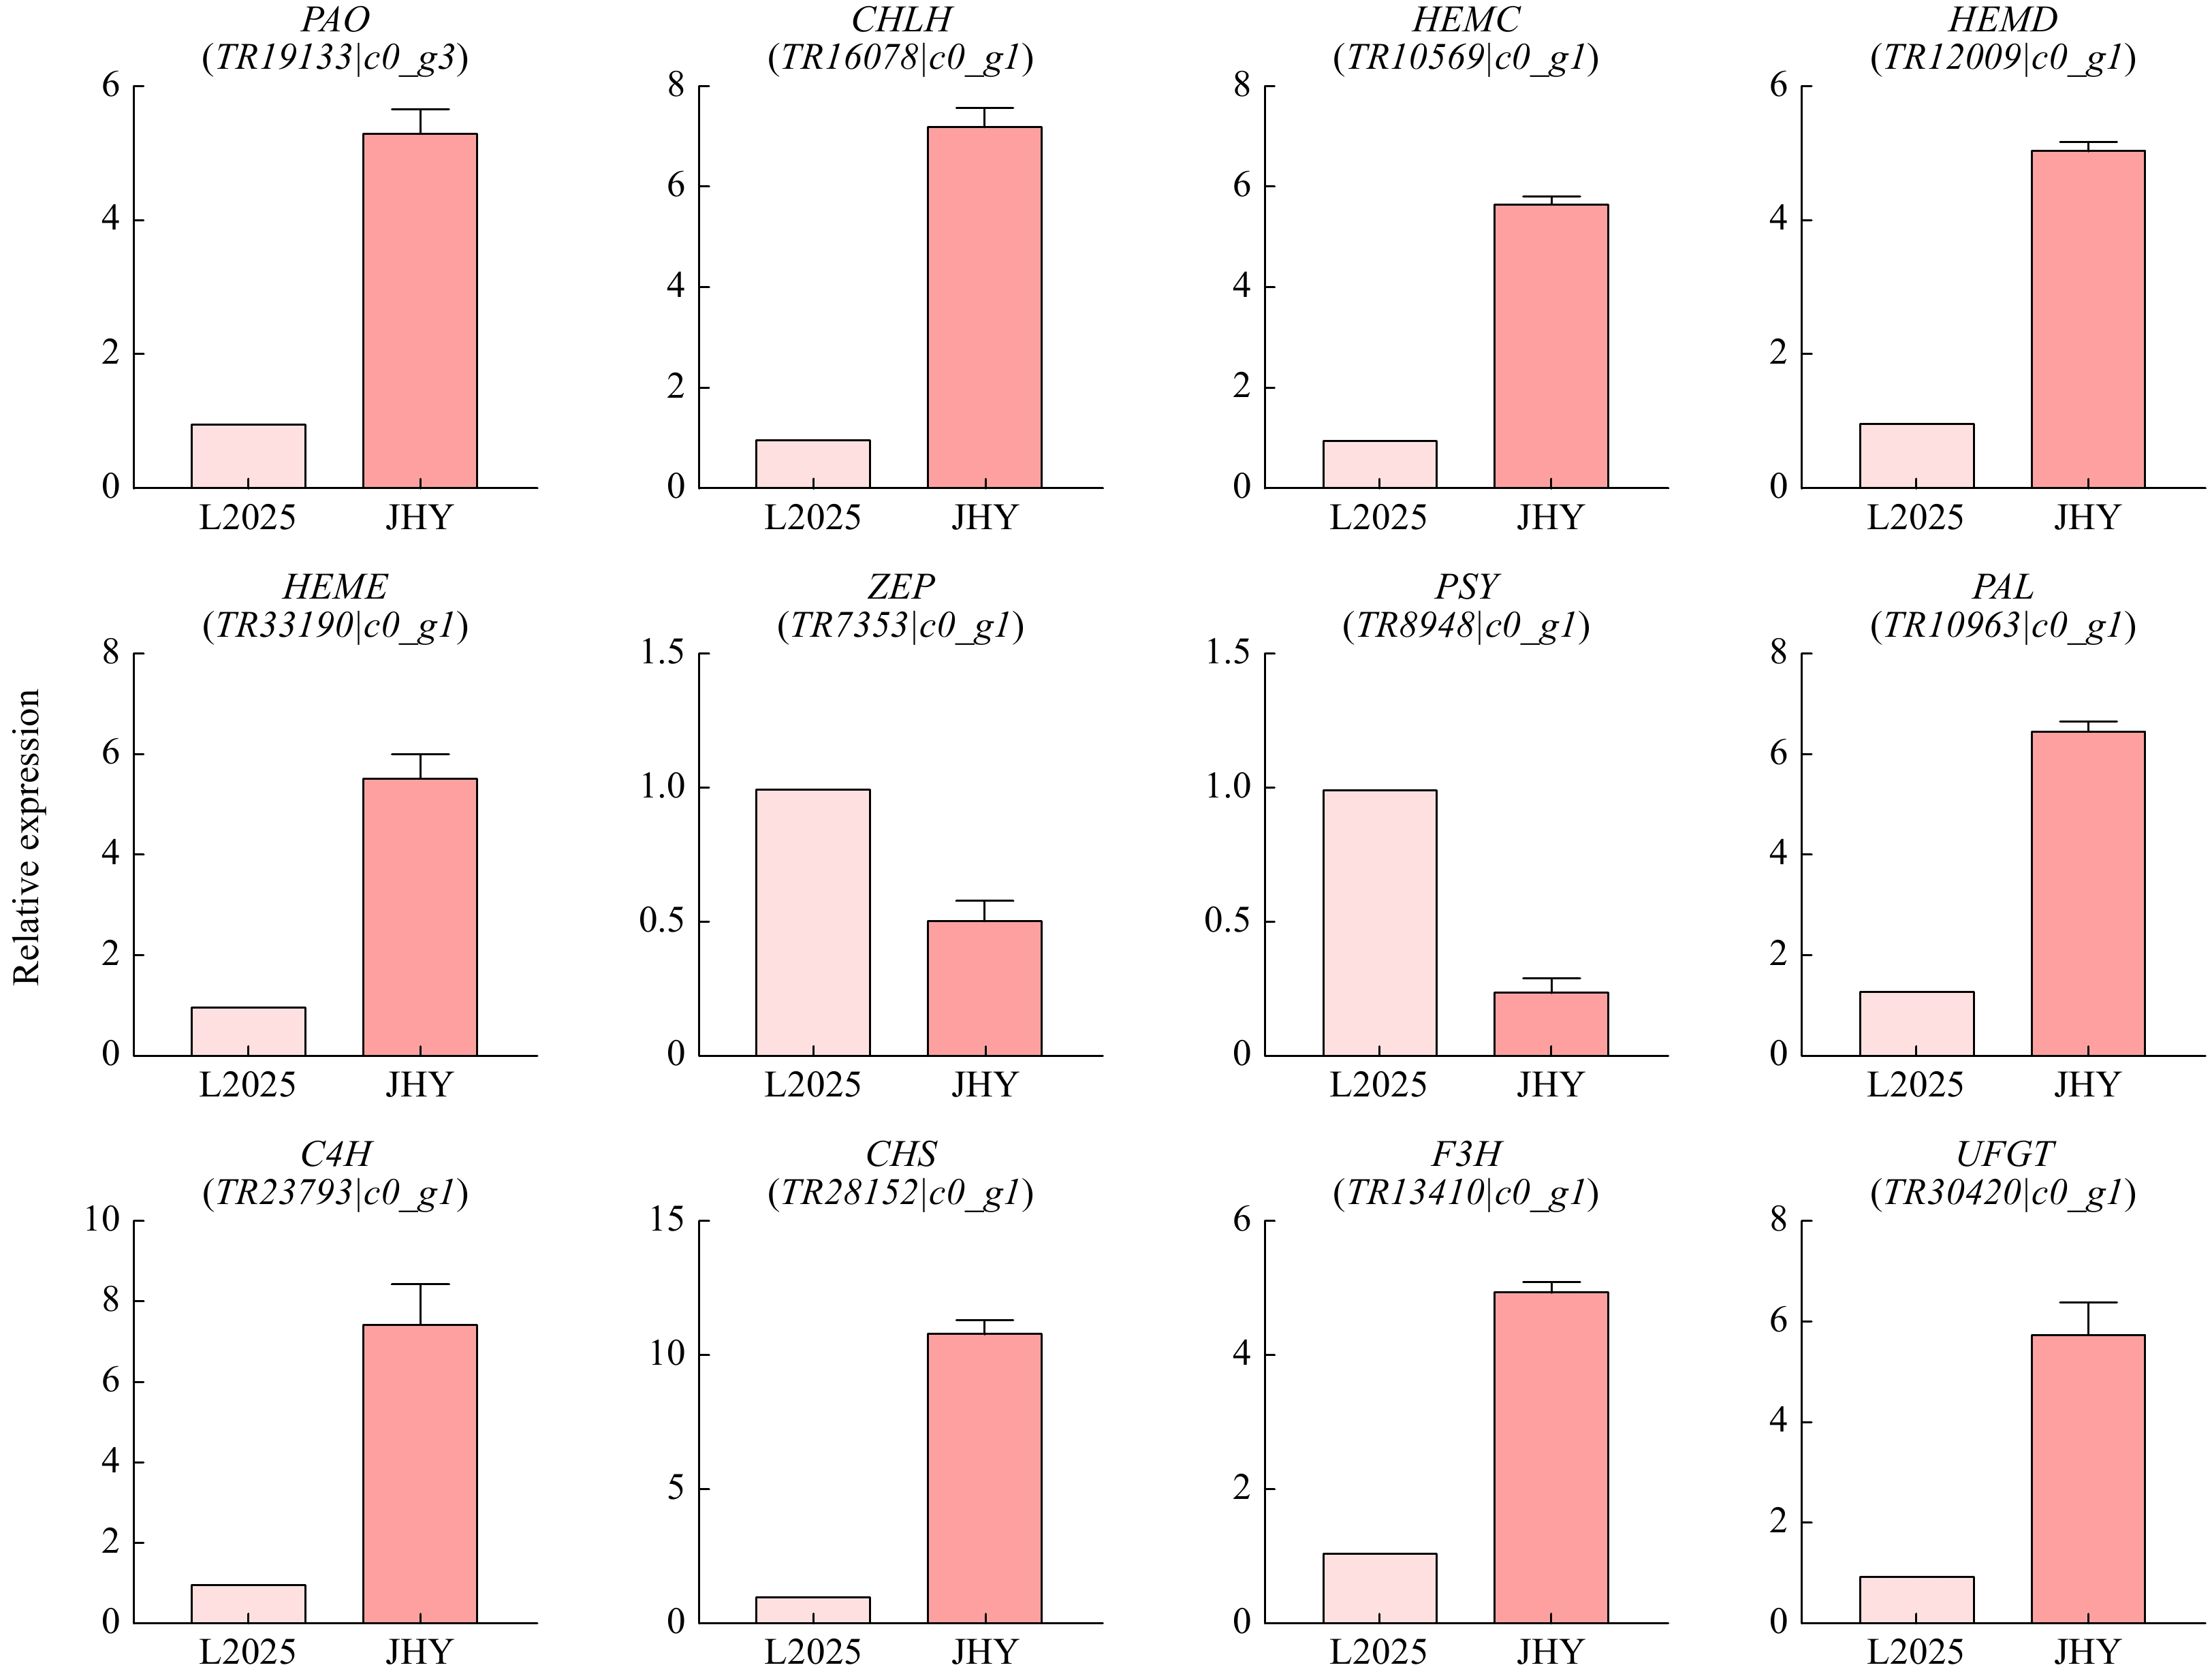
Figure 6. qRT-PCR analysis of the expression of 12 pigmentation-related candidate unigenes in leaves. The Y-axis shows the log2 ratio.
-
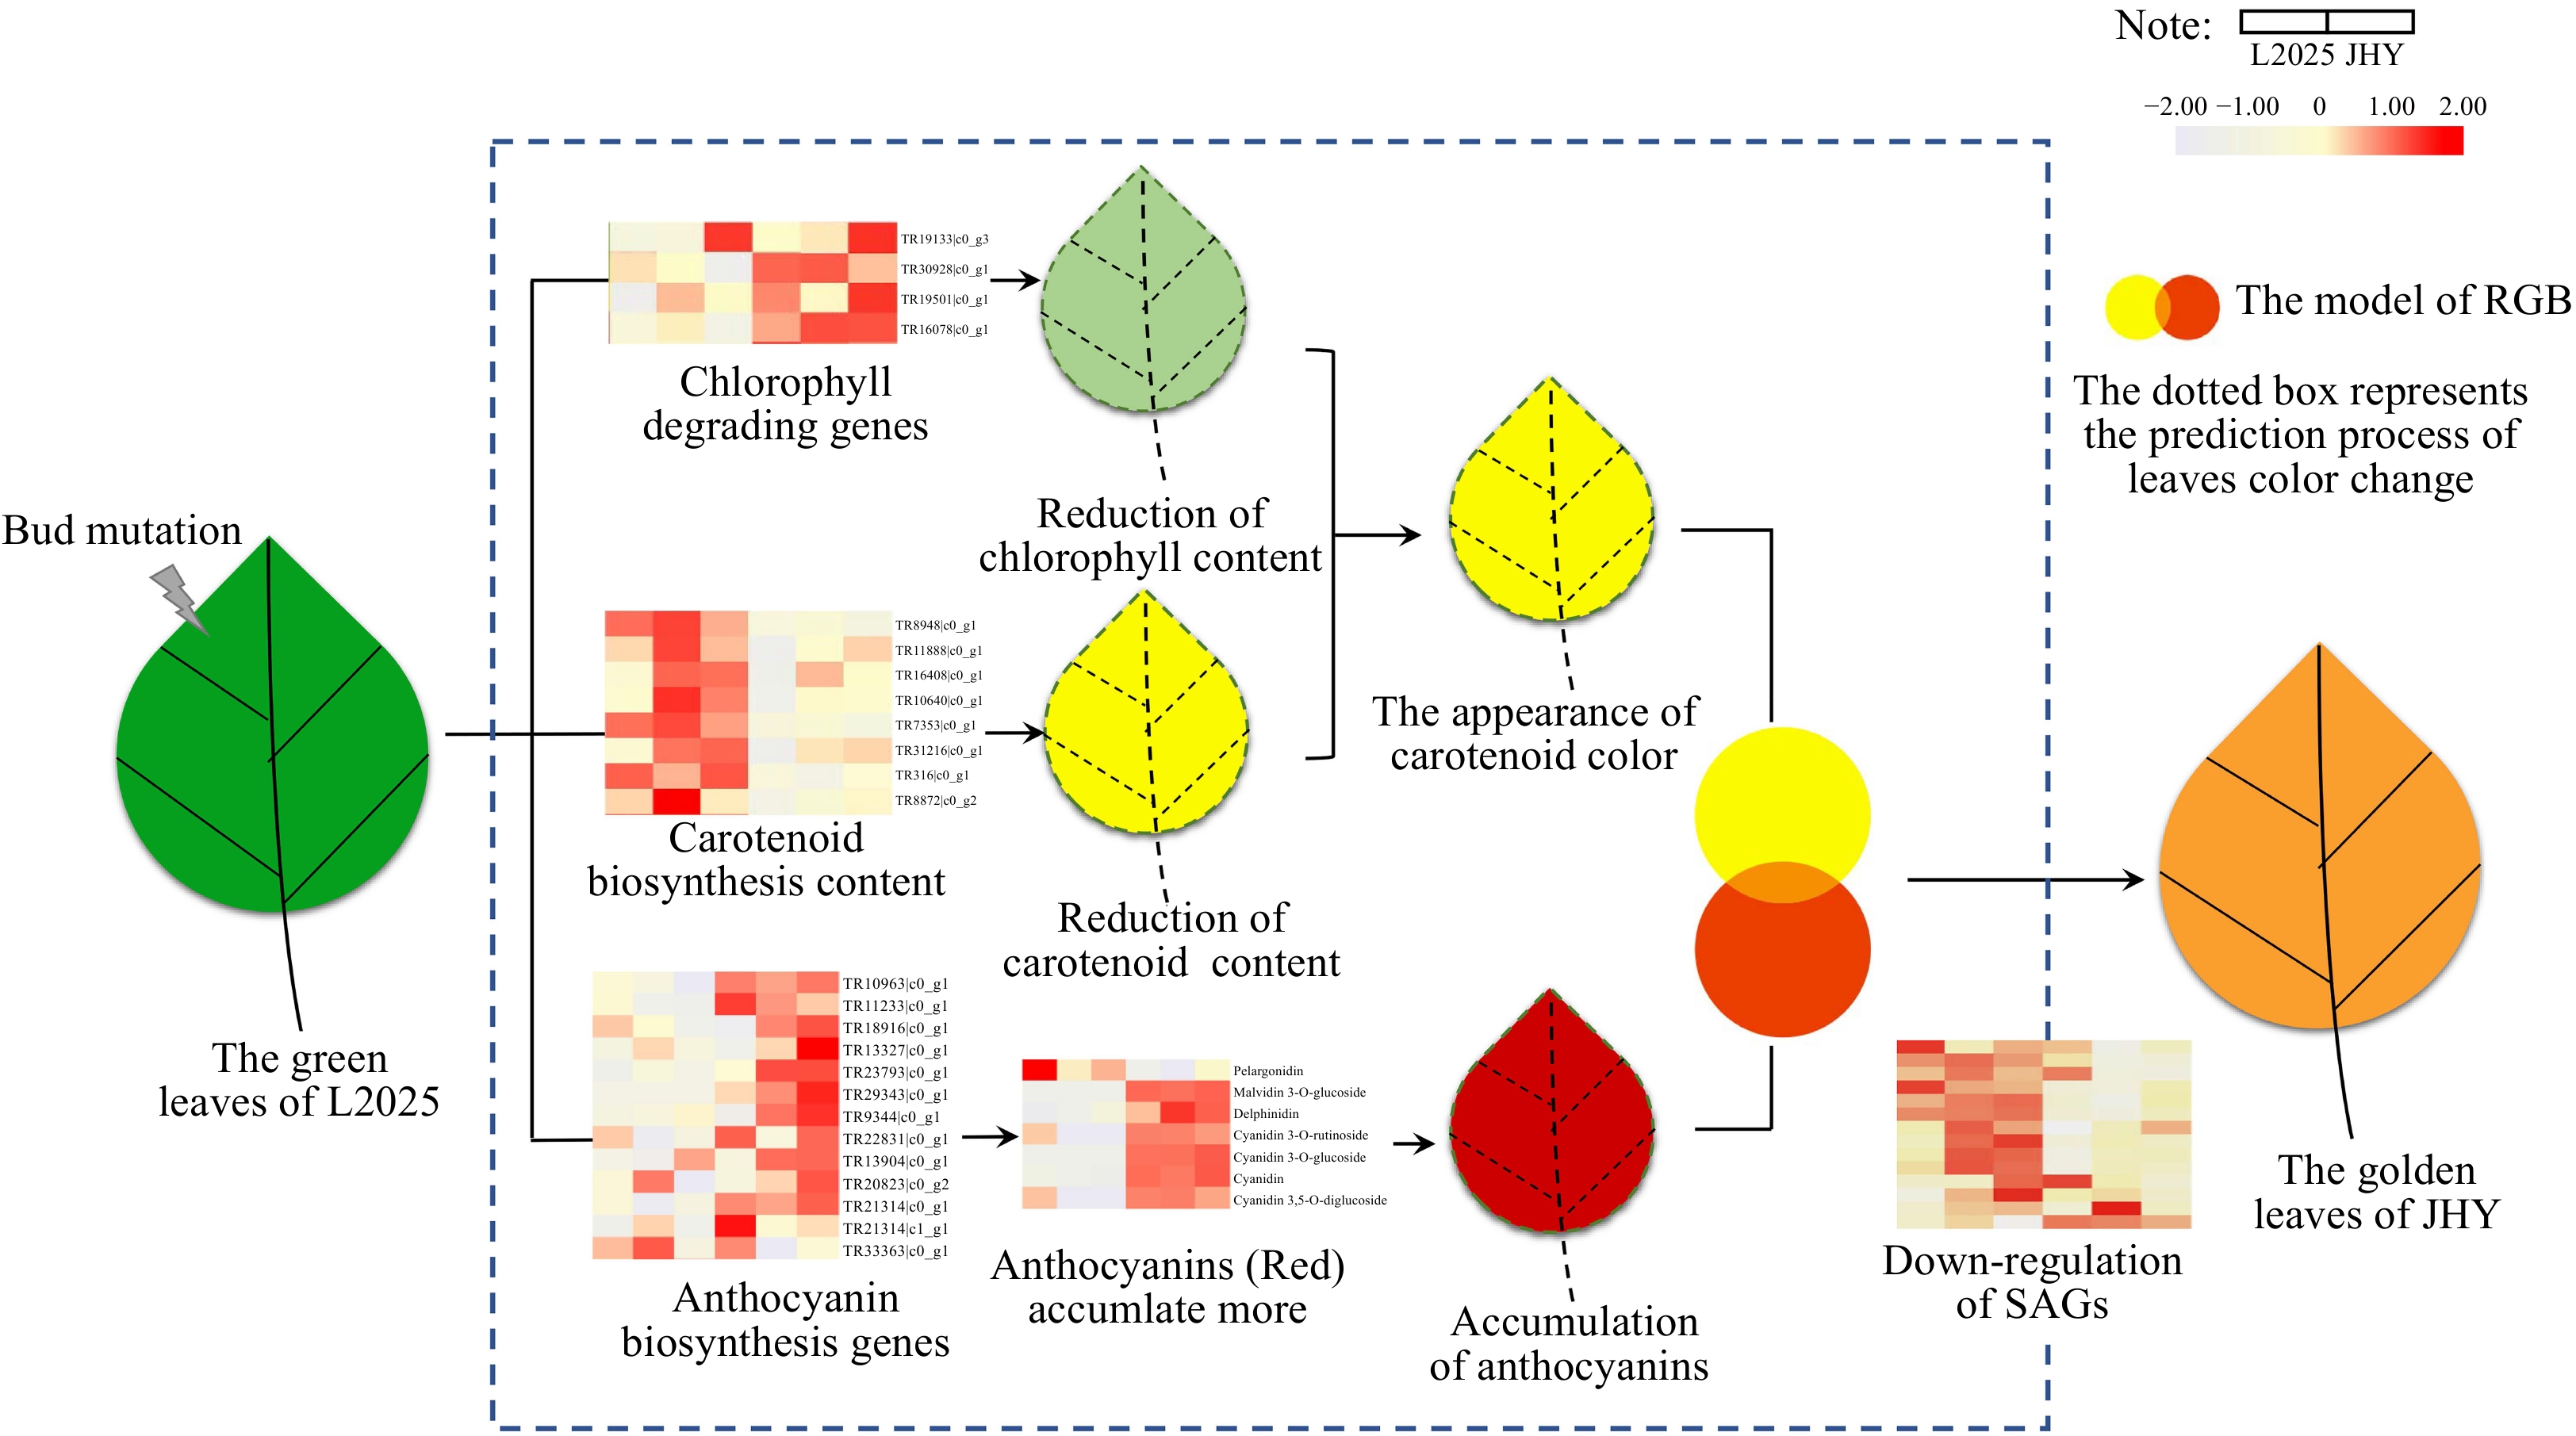
Figure 7. The regulation pattern of golden leaf formation.
-
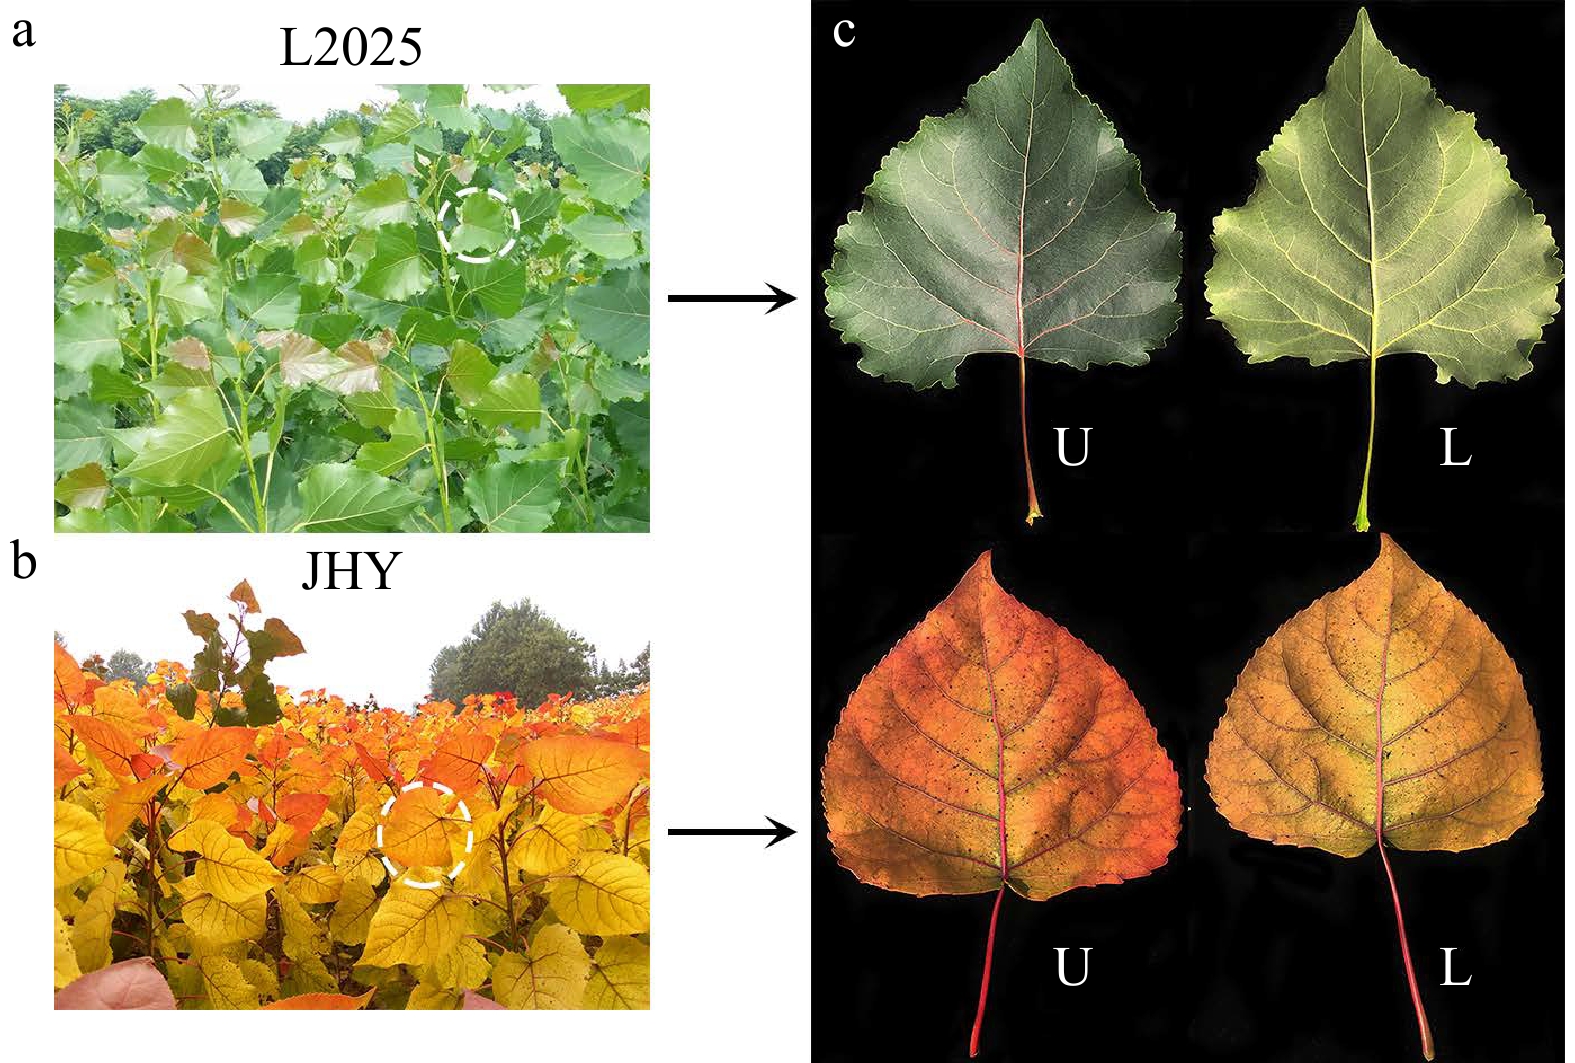
Figure 8. The phenotypes of L2025 and JHY. (a−b) Phenotypes of L2025 and JHY seedlings. (c) The upper (U) and lower (L) epidermis of the second to the fifth fully expanded mature leaves
-
Function Gene Enzyme Total No. DEG No. Phenylpropanoid synthesis pathway PAL Phenylalanine ammonia-lyase 6 4 C4H Cinnamate 4-hydroxylase 6 4 4CL 4-Coumarate: CoA ligase 11 5 Flavonoid synthesis pathway CHS Chalcone synthase 3 2 CHI Chalcone isomerase 1 1 F3H Flavanone 3-hydroxylase 2 1 F3’H Flavonoid 3’-hydroxylase 4 2 DFR Dihydroflavonol 4-reductase 2 1 ANS Anthocyanidin synthase 1 1 Anthocyanin synthesis pathway UFGT UDP-glucose: anthocyanidin 3-O-glucosyltransferase 1 1 3RT Anthocyanidin 3-glucoside 0 0 UGT75C1 Cyanidin 3-O-rutinoside 5-O-glucosyltransferase 1 1 ALA formation HEMA Glutamyl-tRNA reductase 4 1 HEML Glutamate-1-semialdehyde 2,1-aminomutase 1 0 Proto ΙΧ formation HEMB Porphobilinogen synthase 2 1 HEMC Hydroxymethylbilane synthase 1 1 HEMD Uroporphyrinogen-III synthase 2 1 HEME Uroporphyrinogen decarboxylase 2 1 HEMF Coproporphyrinogen-III oxidase 2 0 HEMN Oxygen-independent coproporphyrinogen-III oxidase 2 0 HEMY Oxygen-dependent protoporphyrinogen oxidase 8 2 Chlorophyll formation CHLH Magnesium chelatase subunit H 6 5 CHLE Magnesium-protoporphyrin IX monomethyl ester (oxidative) cyclase 3 0 CHLM Magnesium protoporphyrin IX methyltransferase 2 0 DVR Divinyl chlorophyllide a 8-vinyl-reductase 1 0 POR Protochlorophyllide reductase 2 1 Chlorophyll cycle CAO Chlorophyllide a oxygenase 2 0 CHLG Chlorophyll synthase 1 0 CLH Chlorophyllase 2 1 NYC1 Chlorophyll (ide) b reductase 1 0 HCAR 7-Hydroxymethyl chlorophyll a reductase 1 0 Chlorophyll degradation PAO Pheophorbide a oxygenase 6 2 RCCR Red chlorophyll catabolite reductase 1 1 Carotenes formation PSY Phytoene synthase 7 1 PDS Phytoene desaturase 1 0 ZISO ζ-carotene isomerase 2 1 ZDS ζ- carotene desaturase 3 0 crtISO Carotenoid isomerase 1 1 Lcy E ε-cyclase 2 0 Lcy B β-cyclase 1 1 Xanthophll formation LUT5 β-hydroxylase 1 0 CCS1 Capsanthin/Capsorubin synthase 2 1 LUT1 ε-cyclase 1 0 VDE Violaxanthin de-epoxidase 1 0 ZEP Zeaxanthin epoxidase 4 3 NXS Neoxanthin synthase 0 0 Carotenoid degradation NCED 9-cis-Epoxycarotenoid dioxygenase 7 2 AAO3 Abscisic-aldehyde oxidase 3 0 Table 1. Candidate unigenes involved in anthocyanin biosynthesis, chlorophyll metabolism and carotenoid biosynthesis in JHY.
-
Compounds Q1 (Da) Q3 (Da) Rt (min) Molecular Weight (Da) L2025 JHY Peonidin O-hexoside 463.10 301.00 3.00 463.123 1560000 5710000 Peonidin 3-O-glucoside 463.10 301.10 2.94 498.0929 1490000 6143333 Peonidin 301.10 286.00 3.98 301.1 292333 415000 Pelargonidin 3-O-beta-D-glucoside 433.10 271.00 2.75 433.1 507666 5330000 Pelargonidin 271.00 149.00 3.75 271.24 76133 31900 Malvidin 3-O-glucoside 493.20 331.00 2.87 493.2 0 455666 Malvidin 3-O-galactoside 493.00 331.00 2.87 493 0 267333 Delphinidin O-malonyl-malonylhexoside 637.10 303.40 3.24 637.1 3183 12600 Delphinidin 303.00 229.00 2.90 303.24 144000 399666 Cyanidin O-syringic acid 465.10 285.10 2.50 466.1 361666 3426667 Cyanidin O-diacetyl-hexoside-O-glyceric acid 619.10 285.20 3.20 620.1 17700 128200 Cyanidin 3-O-rutinoside 595.00 287.00 2.62 595 22139 492000 Cyanidin 3-O-glucoside 449.10 287.30 2.56 449.1 0 502666 Cyanidin 287.00 213.00 3.45 287.24 73166 1019000 Cyanidin 3,5-O-diglucoside 611.00 287.00 2.15 611 112672 2560667 Peonidin 3, 5-O-diglucoside 625.40 301.00 2.16 625.4 271666 94166 Table 2. List of the anthocyanins and anthocyanidins detected in L2025 and JHY. (Note: The number indicates the areas of the peaks obtained for each compound in the MRM analysis. The relative quantitative results compare the different expressions of the same metabolite, but not the different expressions of different metabolites. Q1, parent ions; Q3, characteristic fragments; RT, retention time.)
Figures
(8)
Tables
(2)