-

Figure 1. Branch pathway of anthocyanin metabolism. F3H, flavanone 3-hydroxylase; DFR, dihydroflavonol 4-reductase; ANS, anthocyanidin synthase; 3GT, UDP-glucose: anthocyanidin 3-O-glucosyltransferase; MaT, malonyl-CoA: anthocyanin 3-malonyltransferase; F3'H, flavonoid 3'-hydroxylase; F3'5'H, flavonoid 3',5'-hydroxylase.
-
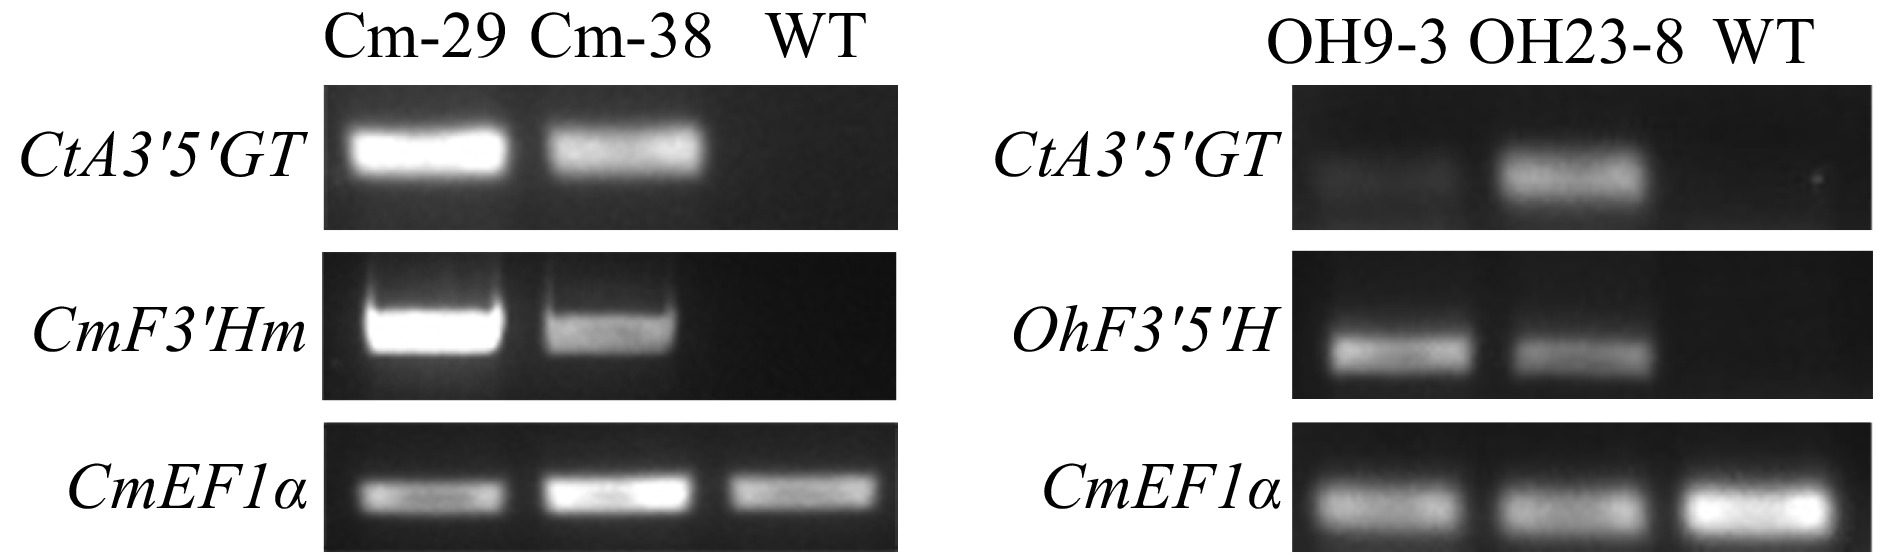
Figure 2. Gene expression analysis in OhF3'5'H and CmF3'Hm transgenic chrysanthemum lines.
-
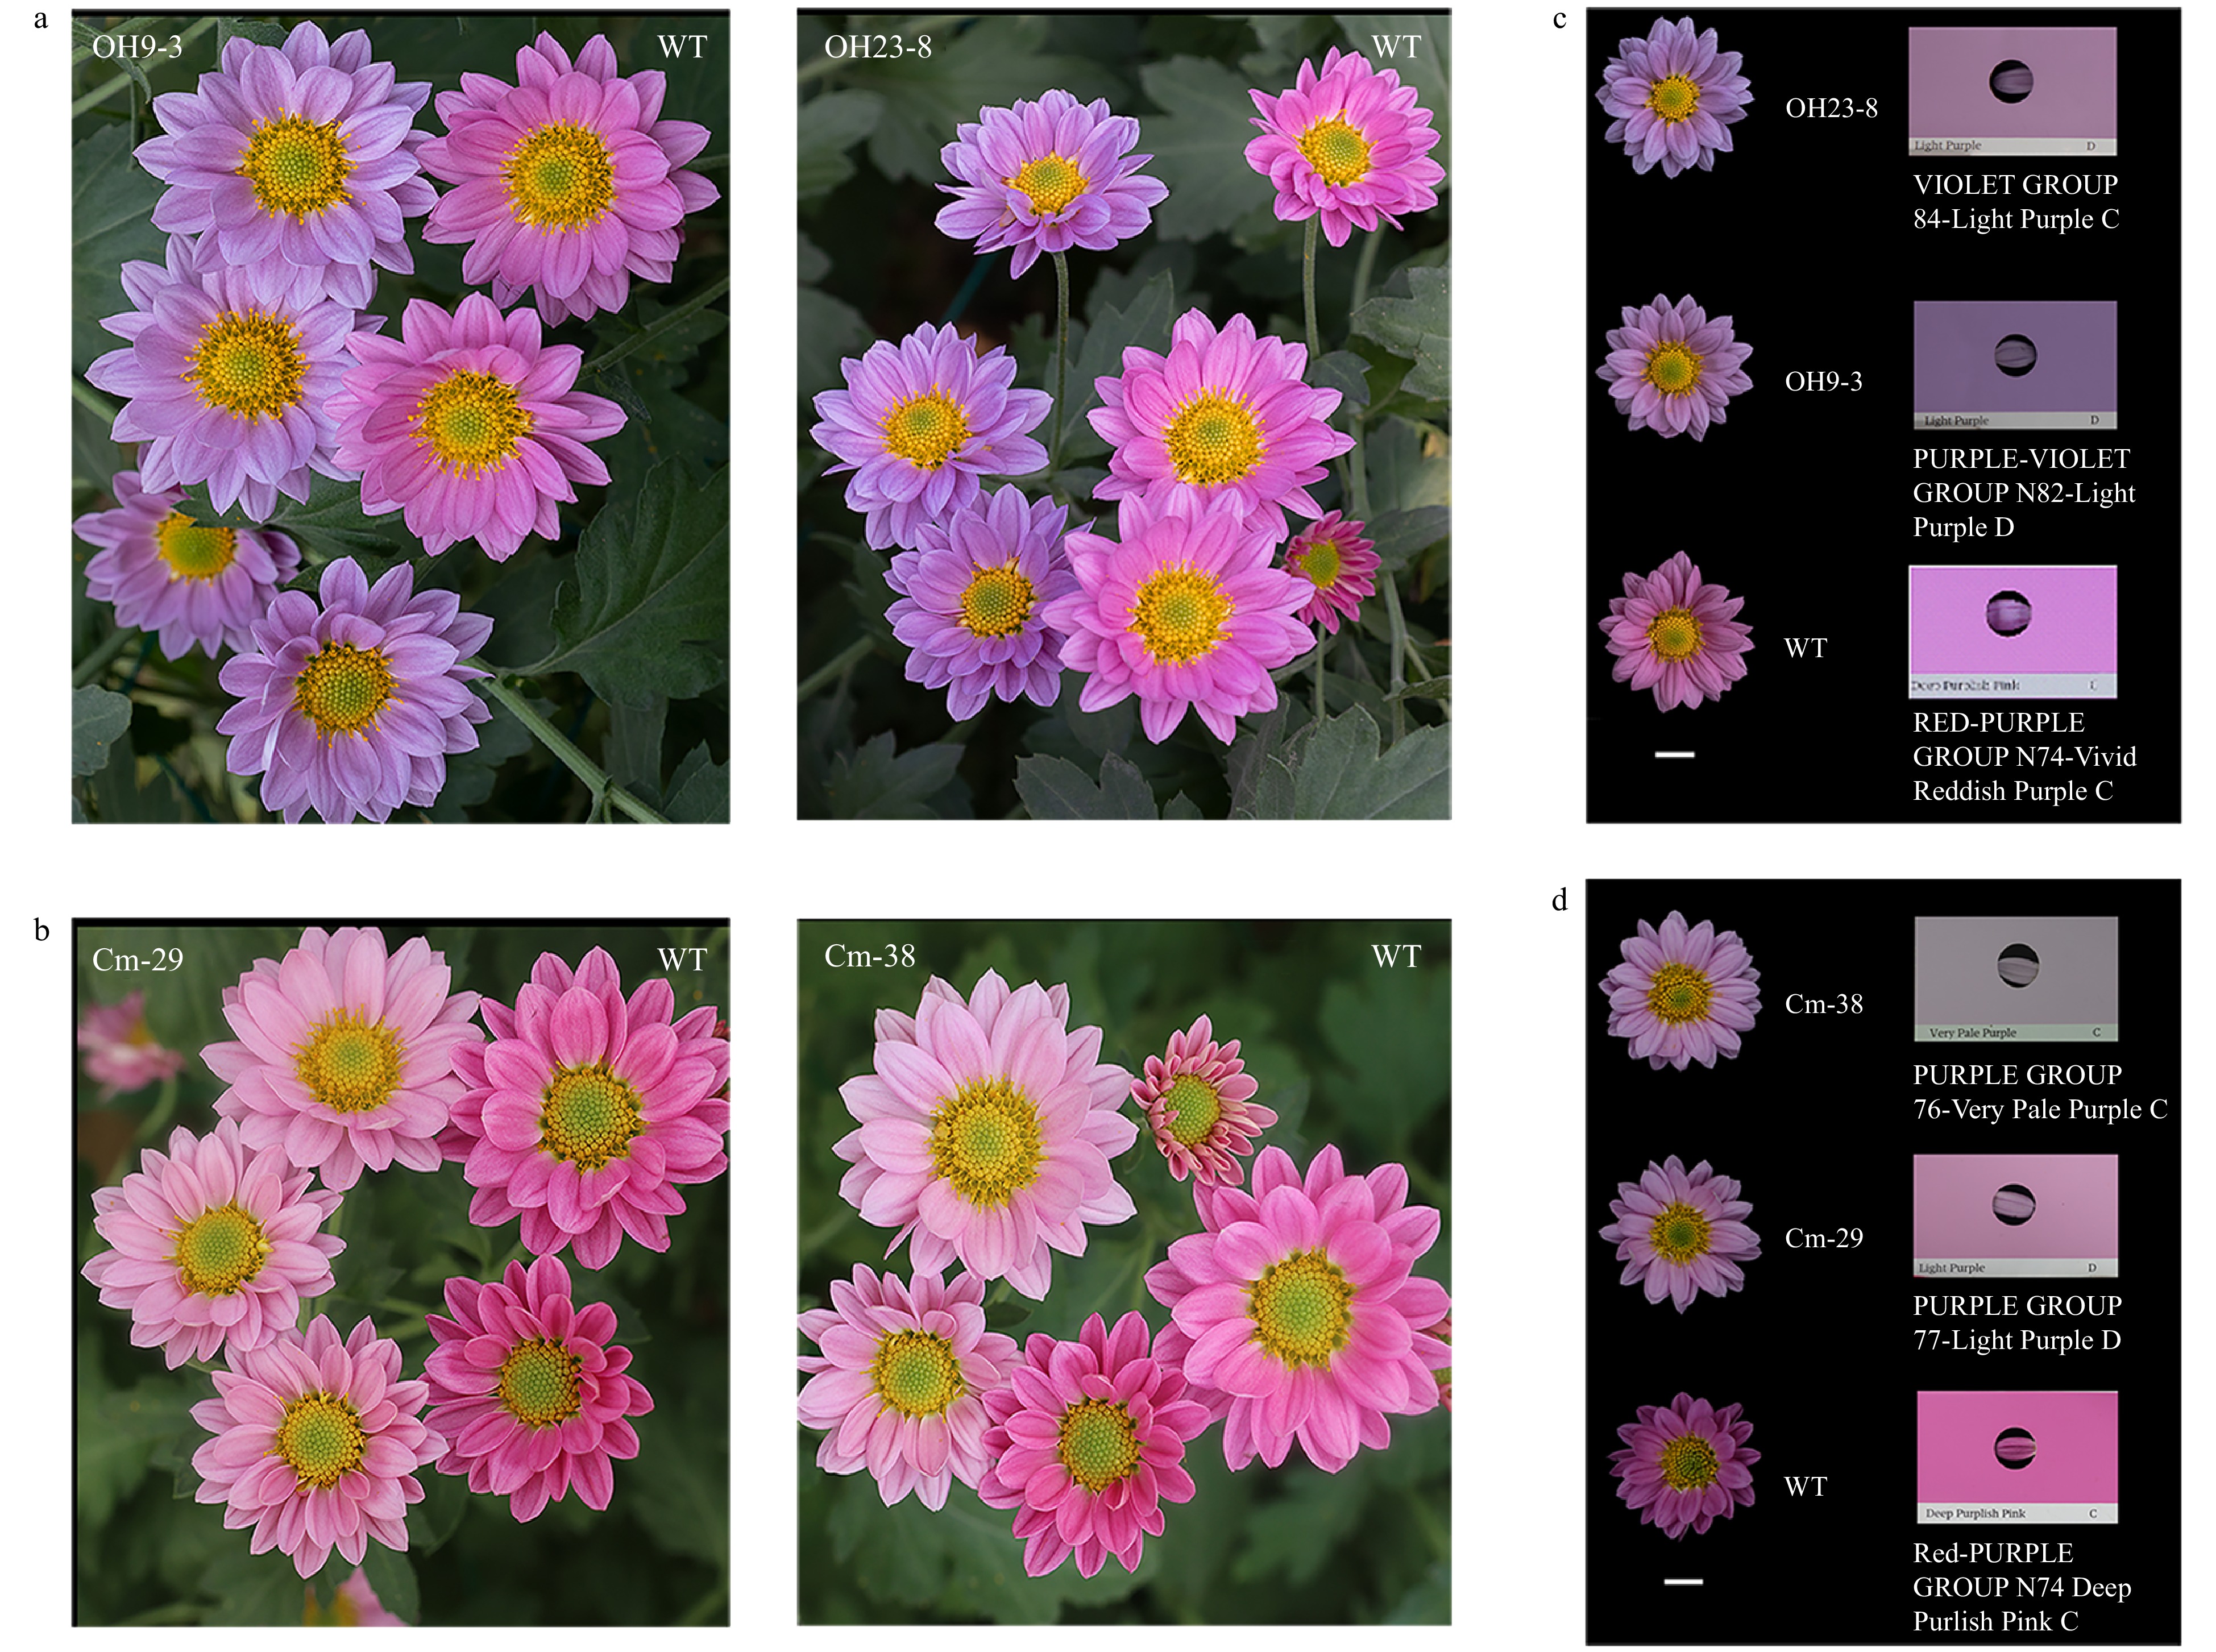
Figure 3. Flower color phenotypes of transgenic chrysanthemum lines and comparison based on the RHS Colour Chart. (a) Comparison of flower color phenotypes between the OhF3'5'H transgenic chrysanthemum line and wildtype. (b) Comparison of flower color phenotypes between chrysanthemum CmF3'Hm transgenic chrysanthemum line and wild-type. Flower color of (c) OhF3'5'H and (d) CmF3'Hm transgenic chrysanthemum lines according to the RHS Colour Chart.
-
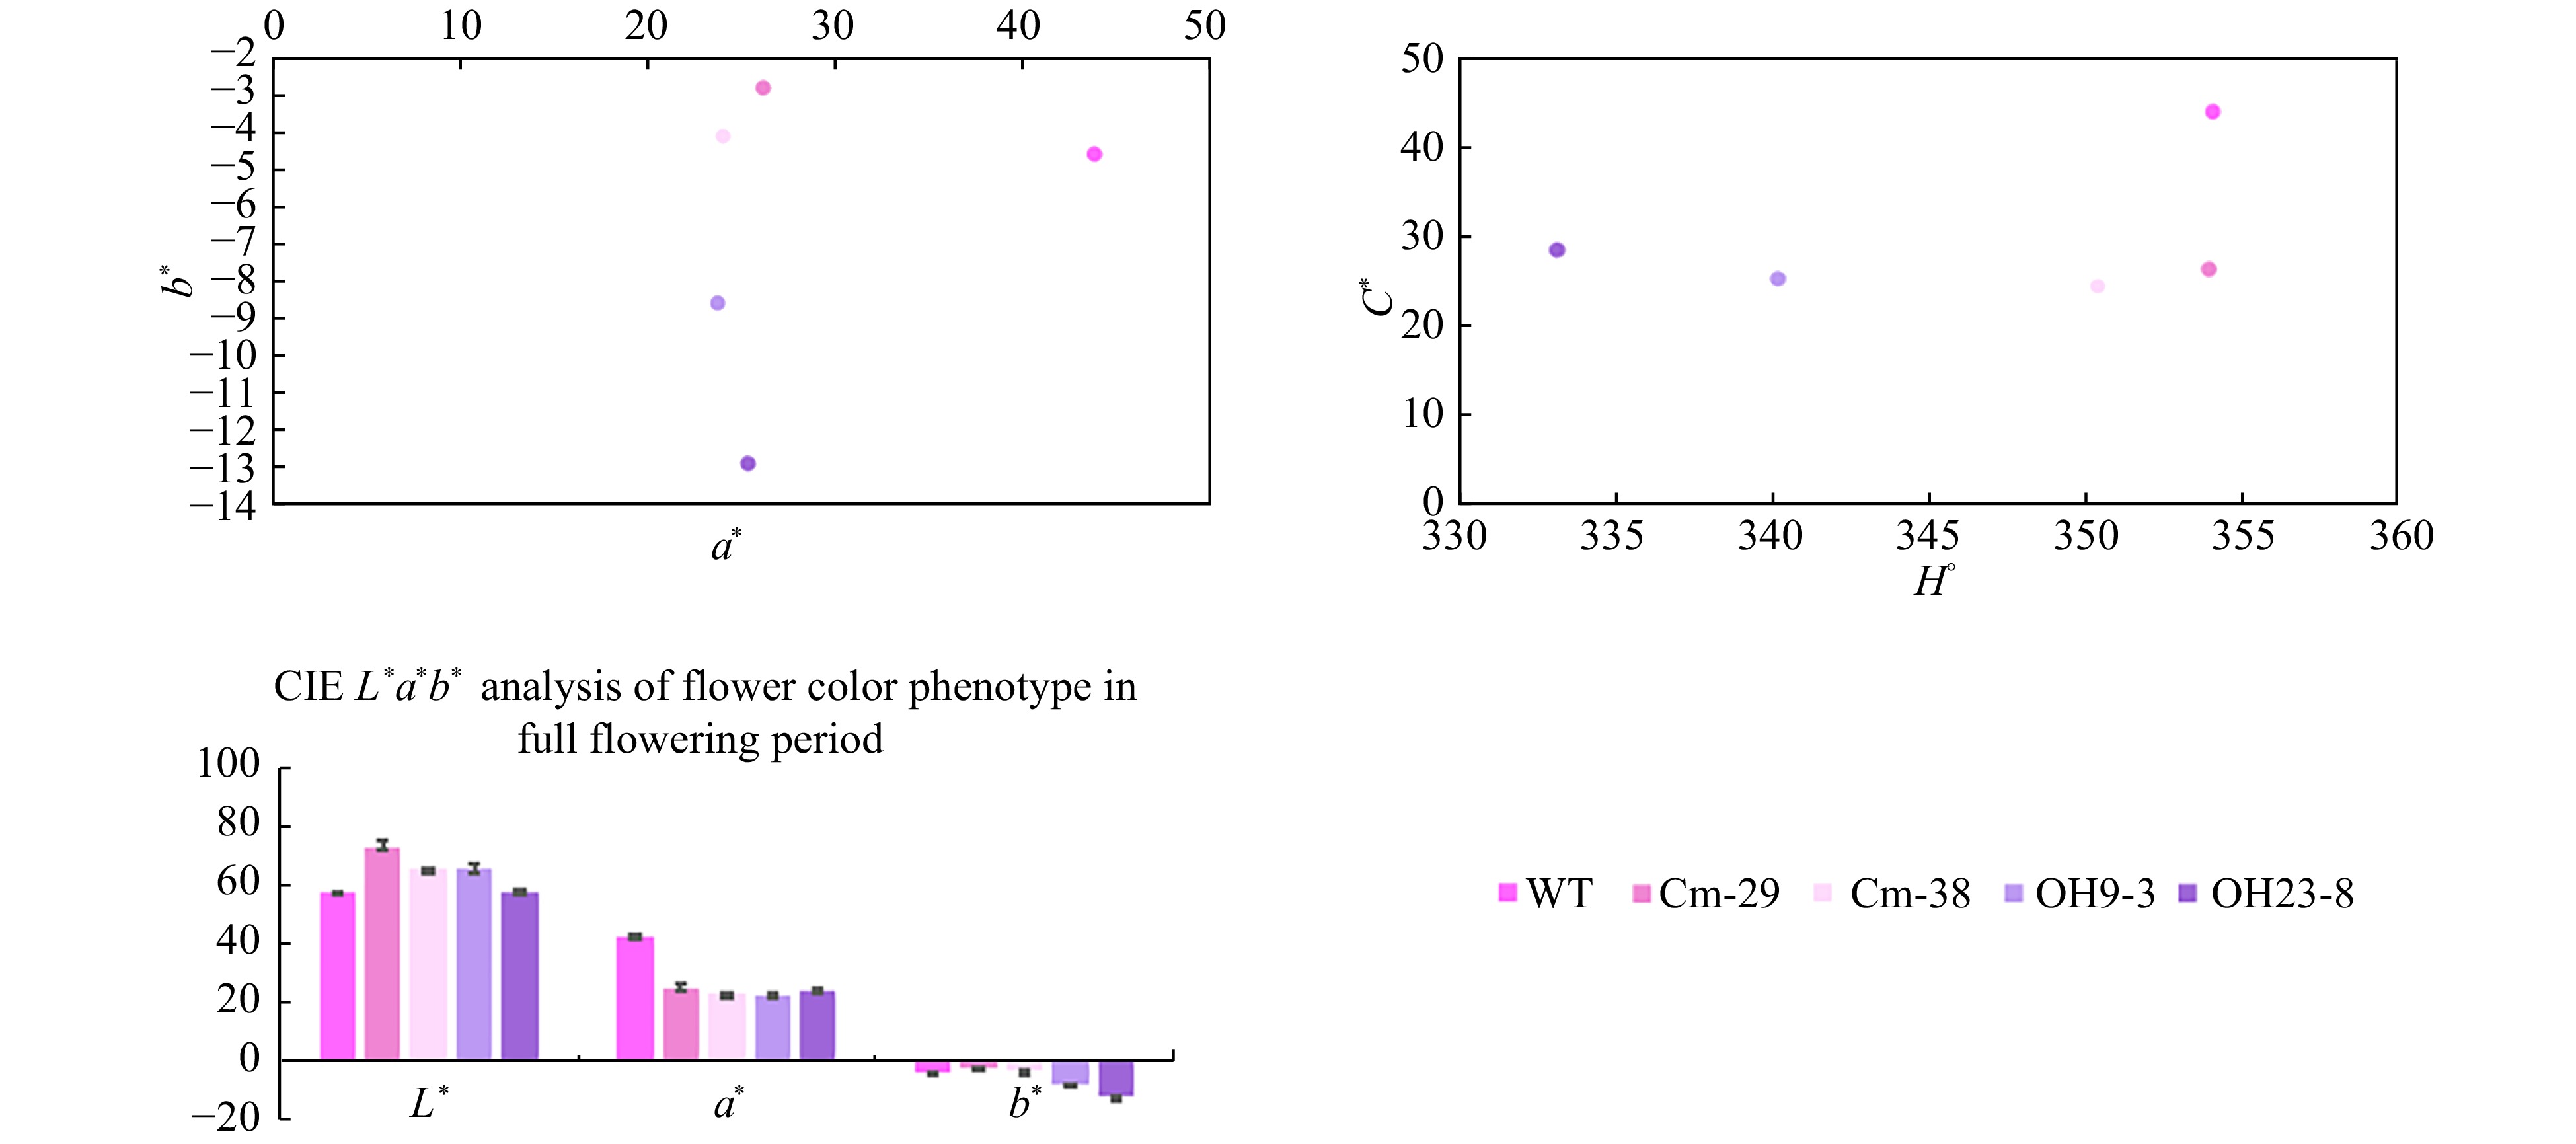
Figure 4. L*a*b* values of ray floret color in transgenic and wild-type chrysanthemum. L* value represents sample brightness; a* value > 0 indicates that the color is reddish; a* value < 0 indicates that the color is more green; b* value indicates the range from blue to yellow, and b* value > 0 indicates that the color is more yellow; b* value < 0 means the color is bluish; H° represents chromaticity angle, and the closer the value of H° is to 270, the more blue the color.
-

Figure 5. Mass spectrometric analysis results of anthocyanins of transgenic and wild-type chrysanthemums. (a) Wild-type chrysanthemums with red-purple flowers accumulated A1 and A2. (b) CmF3'Hm transgenic chrysanthemum lines with purple flowers accumulated A3 and A4. (c) OhF3'5'H transgenic chrysanthemum lines with purple-violet flowers accumulated A3, A4, A7, A8 and A9.
-
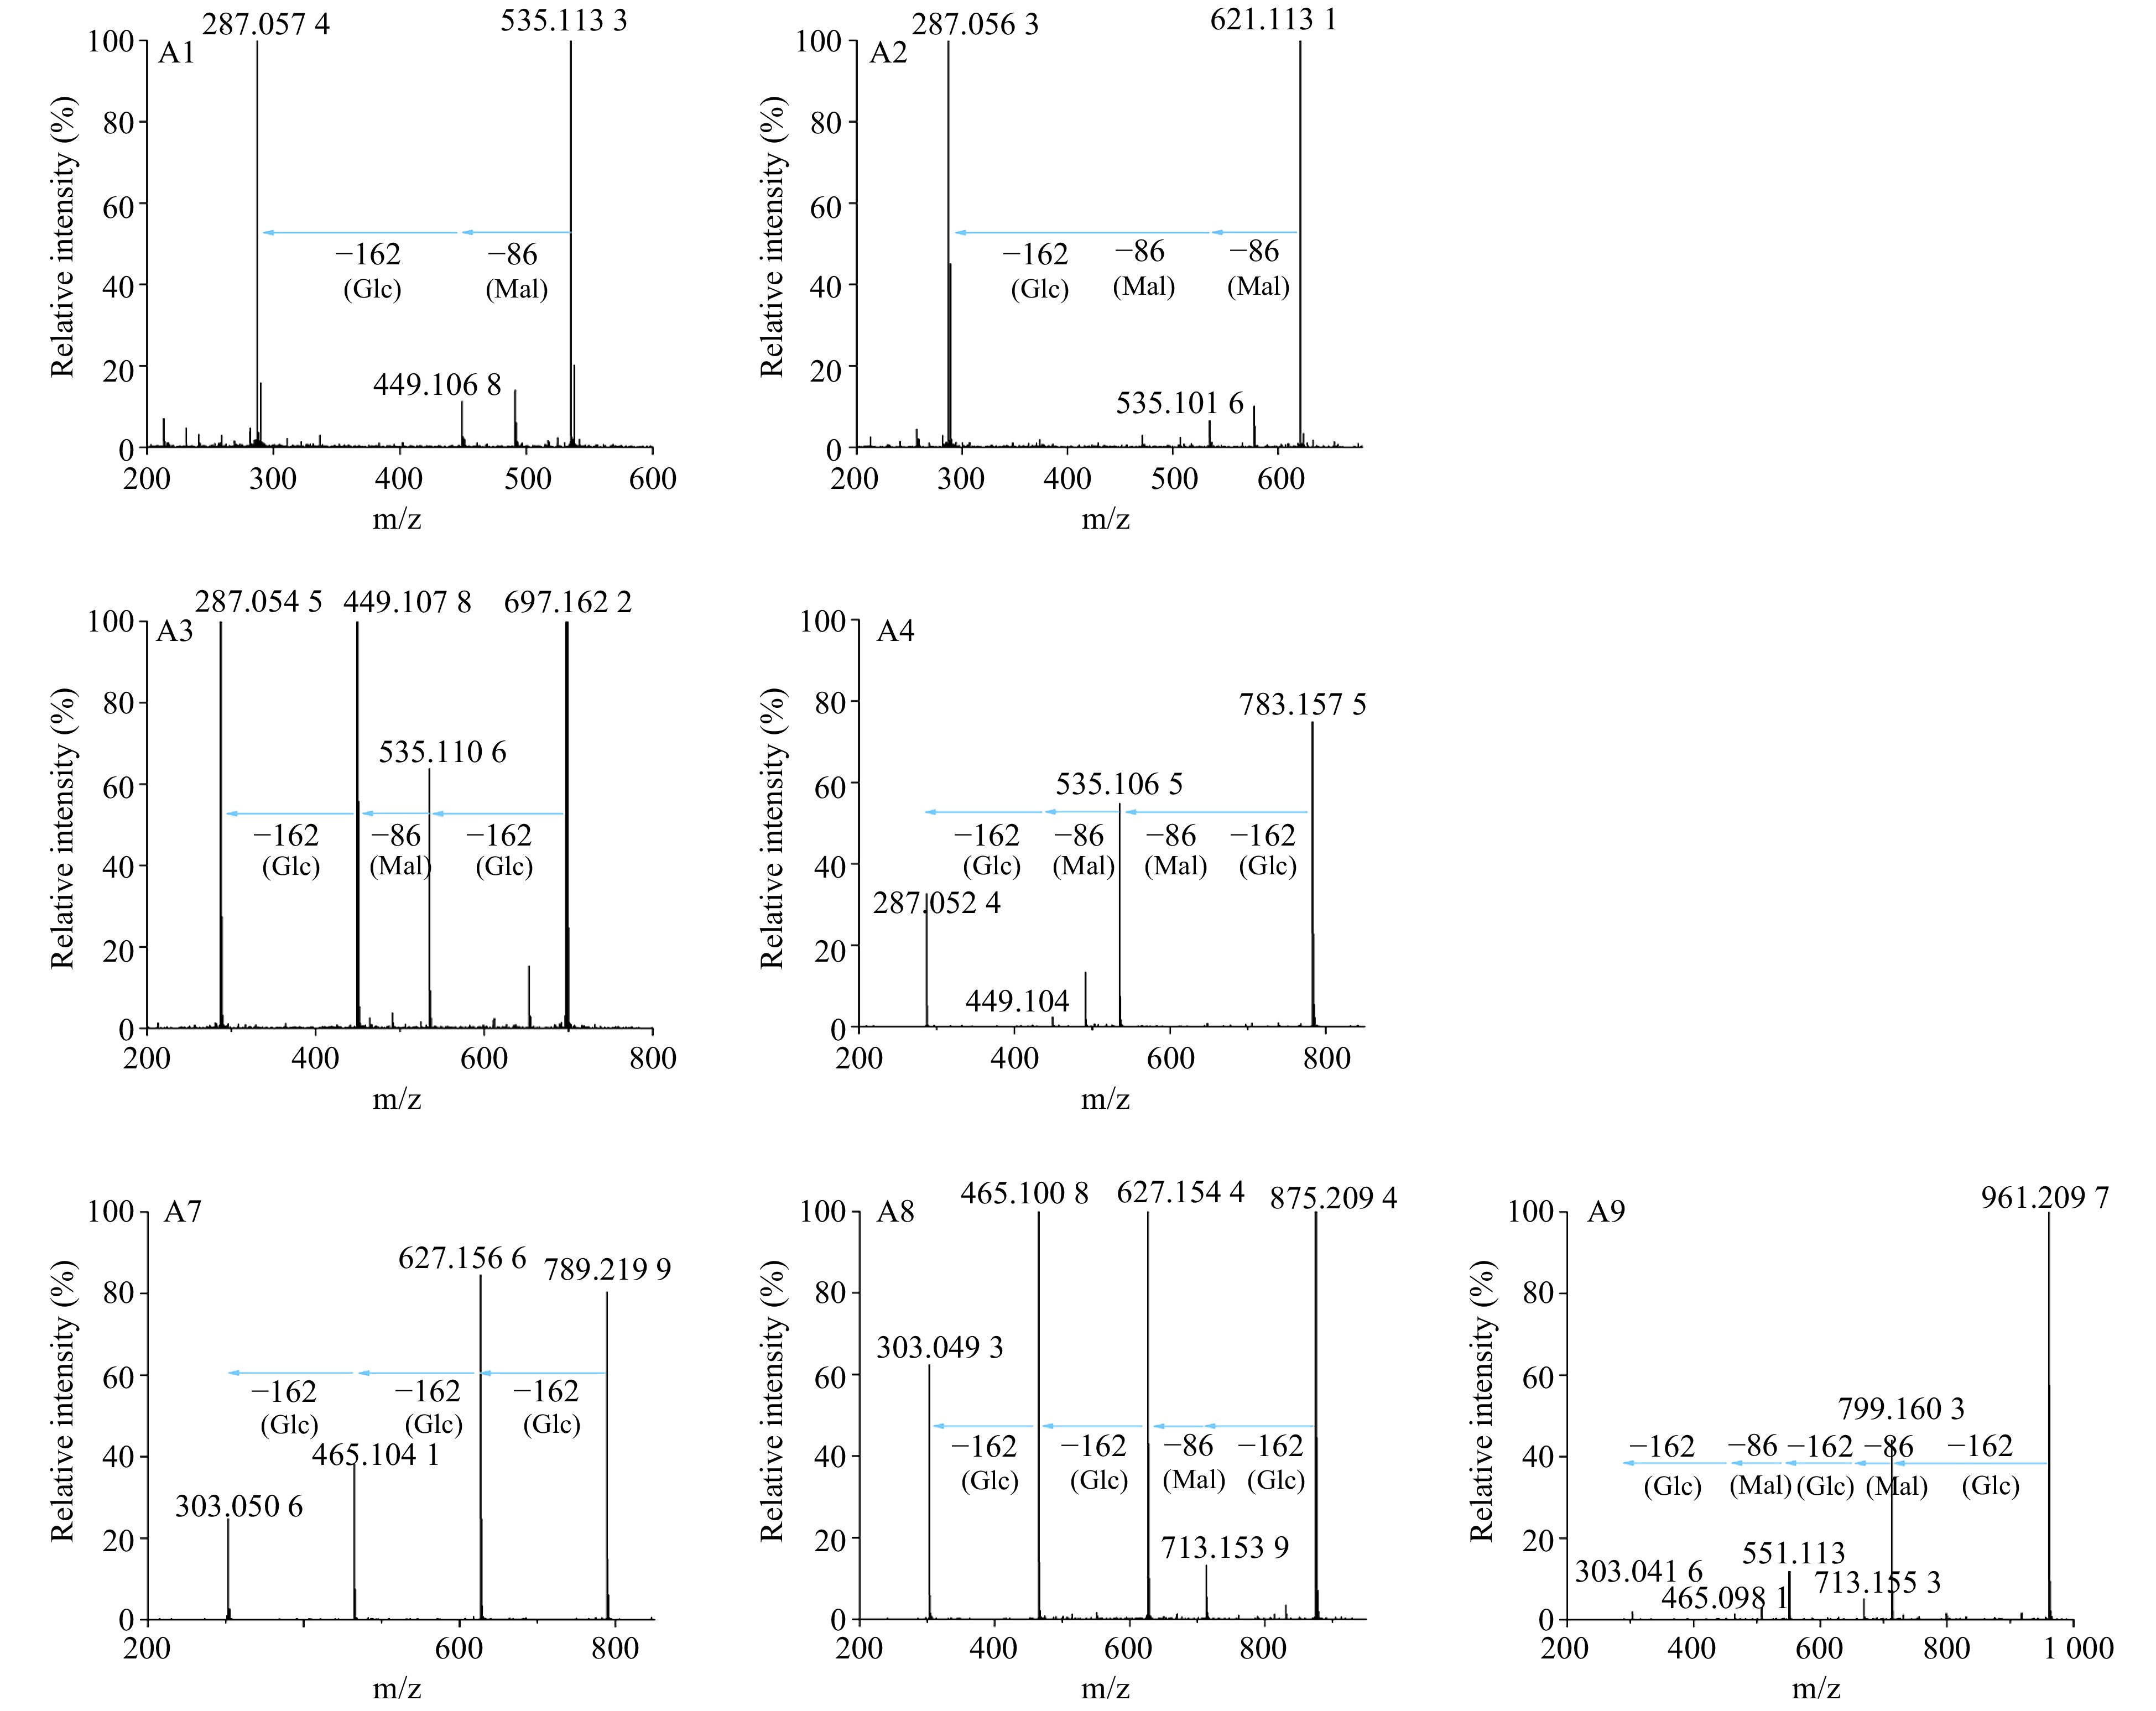
Figure 6. MS/MS analysis of anthocyanins in transgenic and wild-type chrysanthemums. Mal represents malonyl group, Glc represents glucosyl group.The product ions of A1 at m/z = 535[M]+ were 449(−Mal), 287(−Mal, −Glc; Cyanidin aglycone). The product ions of A2 at m/z = 621[M]+ were 535(−Mal), 287(−2×Mal, −Glc). The product ions of A3 at m/z = 697[M]+ were 535(−Glc), 449(−Glc, −Mal), 287( −2×Glc, −Mal). The product ions of A4 at m/z = 783[M]+ were 535(−Glc, −Mal), 449(−Glc, −2×Mal), 287(−2×Mal, −2×Glc). The product ions of A7 at m/z = 789[M]+ were 627(−Glc), 465(−2×Glc), and 303(−3×Glc; delphinidin aglycone). The product ions of A8 at m/z = 875[M]+ were 713(−Glc), 627(−Glc, −Mal), 465(−2×Glc, −Mal), and 303(−3×Glc, −Mal). The product ions of A9 at m/z = 961[M]+ were 799(−Glc), 713(−Glc, −Mal), 551(−2×Glc, −Mal), 465(−2×Glc, −2×Mal), and 303(−3×Glc, −2×Mal).
-
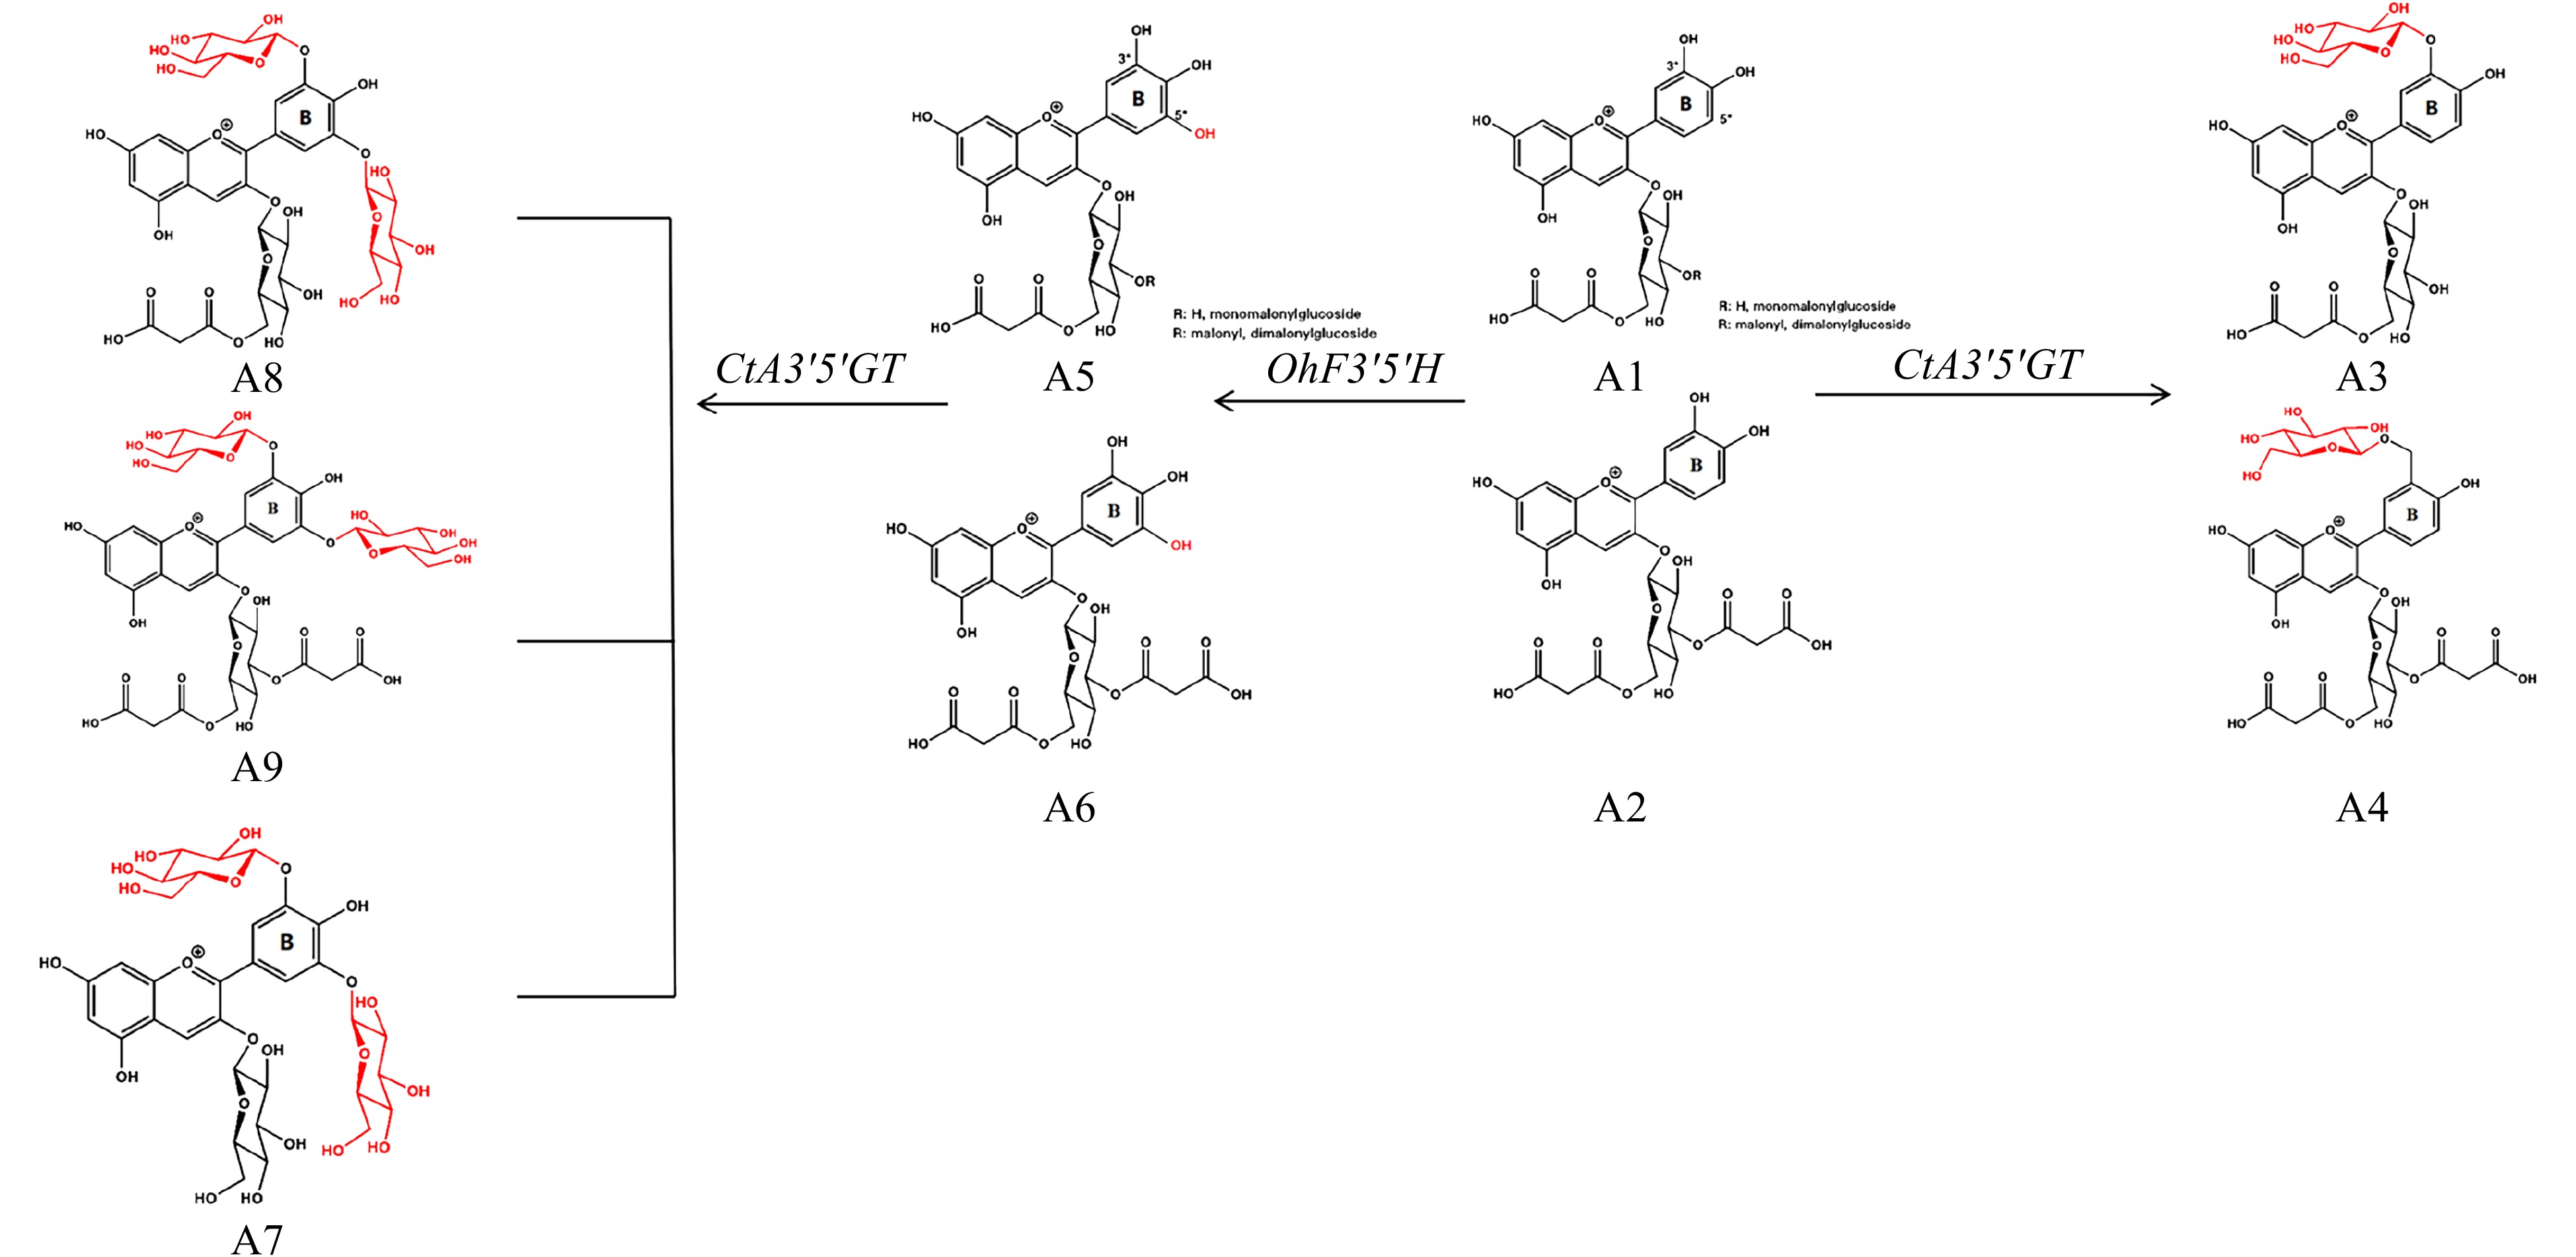
Figure 7. Metabolic modifications of endogenous chrysanthemum pigments by OhF3'5'H and CtA3'5'GT.
-
Strain Composition Retention time (min) Molecular ion (m/z) Fragment
ion (m/z)Estimated result WT A1 5.79 535 535, 449, 287 Cyanidin-3-O-(6"-malonyl) glucoside A2 6.86 621 621, 535, 287 Cyanidin-3-O-(3",6"-dimalonyl) glucoside Cm A3 4.30 697 697, 535, 449, 287 Cyanidin-3-O-(6"-malonyl) glucoside-3'-O-glucoside A4 5.06 783 783, 535, 449, 287 Cyanidin-3-O-(3",6"-dimalonyl) glucoside-3'-O-glucoside Oh A3 4.30 697 697, 535, 449, 287 Cyanidin-3-O-(6"-malonyl) glucoside-3'-O-glucoside A4 5.06 783 783, 535, 449, 287 Cyanidin-3-O-(3",6"-dimalonyl) glucoside-3'-O-glucoside A7 1.18 789 789, 627, 465, 303 Delphidin-3,3',5'-tri-O-glucoside A8 2.31 875 875, 713, 627, 465, 303 Delphidin-3-O-(6"-malonyl) glucoside-3',5'-di-O-glucoside A9 2.84 961 961, 799, 713, 551, 465, 303 Delphidin-3-O-(3",6"-dimalonyl) glucoside-3',5'-di-O-glucoside Table 1. Analysis of anthocyanin mass spectrometry data for transgenic chrysanthemum.
-
Primer Sequence (5'-3') qCtA3'5'GT-F GTCTTCAAACTCGCTCACGC qCtA3'5'GT-R CGGGCACATAACCCTCTGG qOhF3'5'H-F GGCTCCACCCATCAACACCA qOhF3'5'H-R TACCCGCACAAATCCTCCGC qCmF3’Hm-F GGCTCCACCCATCAACACCA qCmF3’Hm-R TACCCGCACAAATCCTCCGC CmEF1α-F TTTTGGTATCTGGTCCTGGAG CmEF1α-R CCATTCAAGCGACAGACTCA Table 2. Gene primers used to determine gene expression level in transgenic plants.
Figures
(7)
Tables
(2)