-

Figure 1. Type-B genetic correlation (rg) across measures and generalized measures of heritability (H2) of 2016−2019 shade field trials evaluated for canopy height (CH), dark green color index (DGCI), percent living ground cover (%GC), and turf quality (TQ) in Citra (FL), Raleigh (NC) and Tifton (GA). * Entry variance significant by LRT at 0.05 probability level.
-
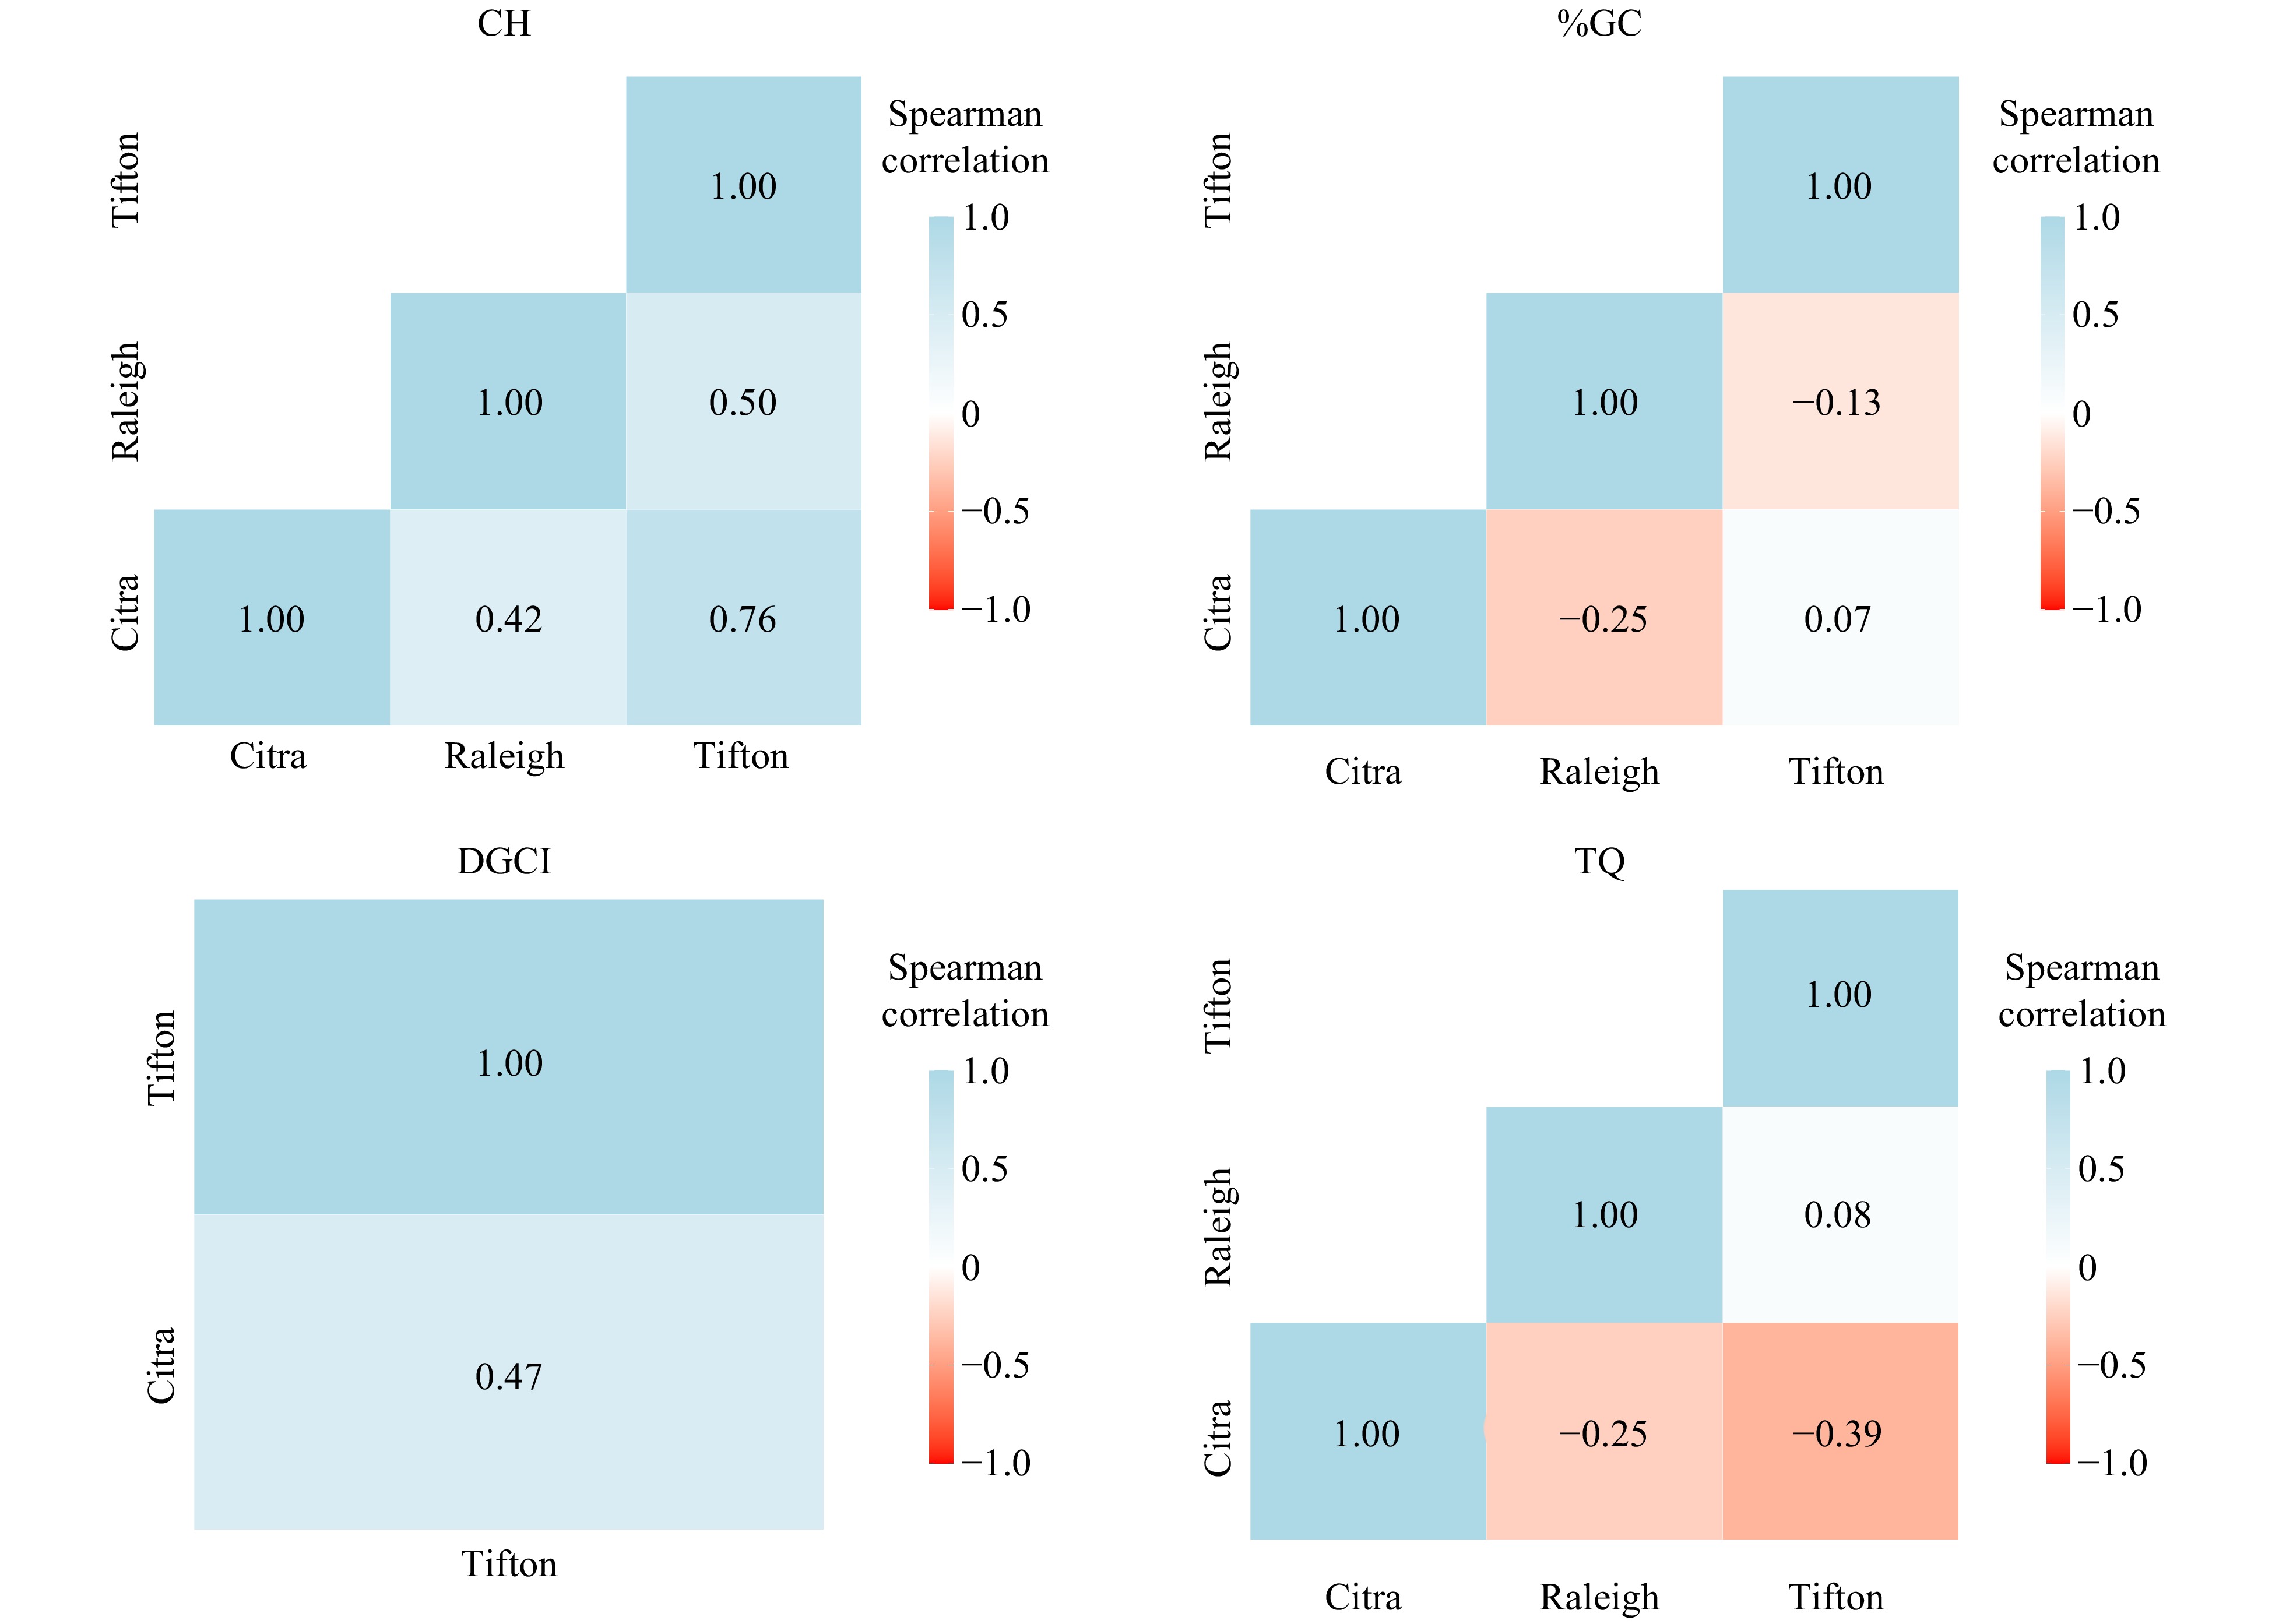
Figure 2. Spearman correlation estimates of 2016−2019 seashore paspalum shade field trials evaluated for canopy height (CH), dark green color index (DGCI), percent living ground cover (%GC), and turf quality (TQ) in Citra (FL), Raleigh (NC) and Tifton (GA).
-

Figure 3. Multi-trait principal component analysis using the predicted values of single-location analysis from seashore paspalum shade field trials evaluated for canopy height (CH), dark green color index (DGCI), percent living ground cover (%GC), and turf quality (TQ) in Citra (FL), Raleigh (NC) and Tifton (GA).
-

Figure 4. Entries Best Linear Unbiased Predictors (BLUPs) of seashore paspalum shade trials evaluated for canopy height (CH), dark green color index (DGCI), percent living ground cover (%GC), and turf quality (TQ) in Citra (FL), Raleigh (NC) and Tifton (GA). DGCI was not evaluated at Raleigh, whereas the BLUPs of %GC at Raleigh and Tifton, and TQ at Tifton were close to zero. * Entry studentized Best Linear Unbiased Predictors significant at 5% probability by t-Student test.
Figures
(4)
Tables
(0)