-
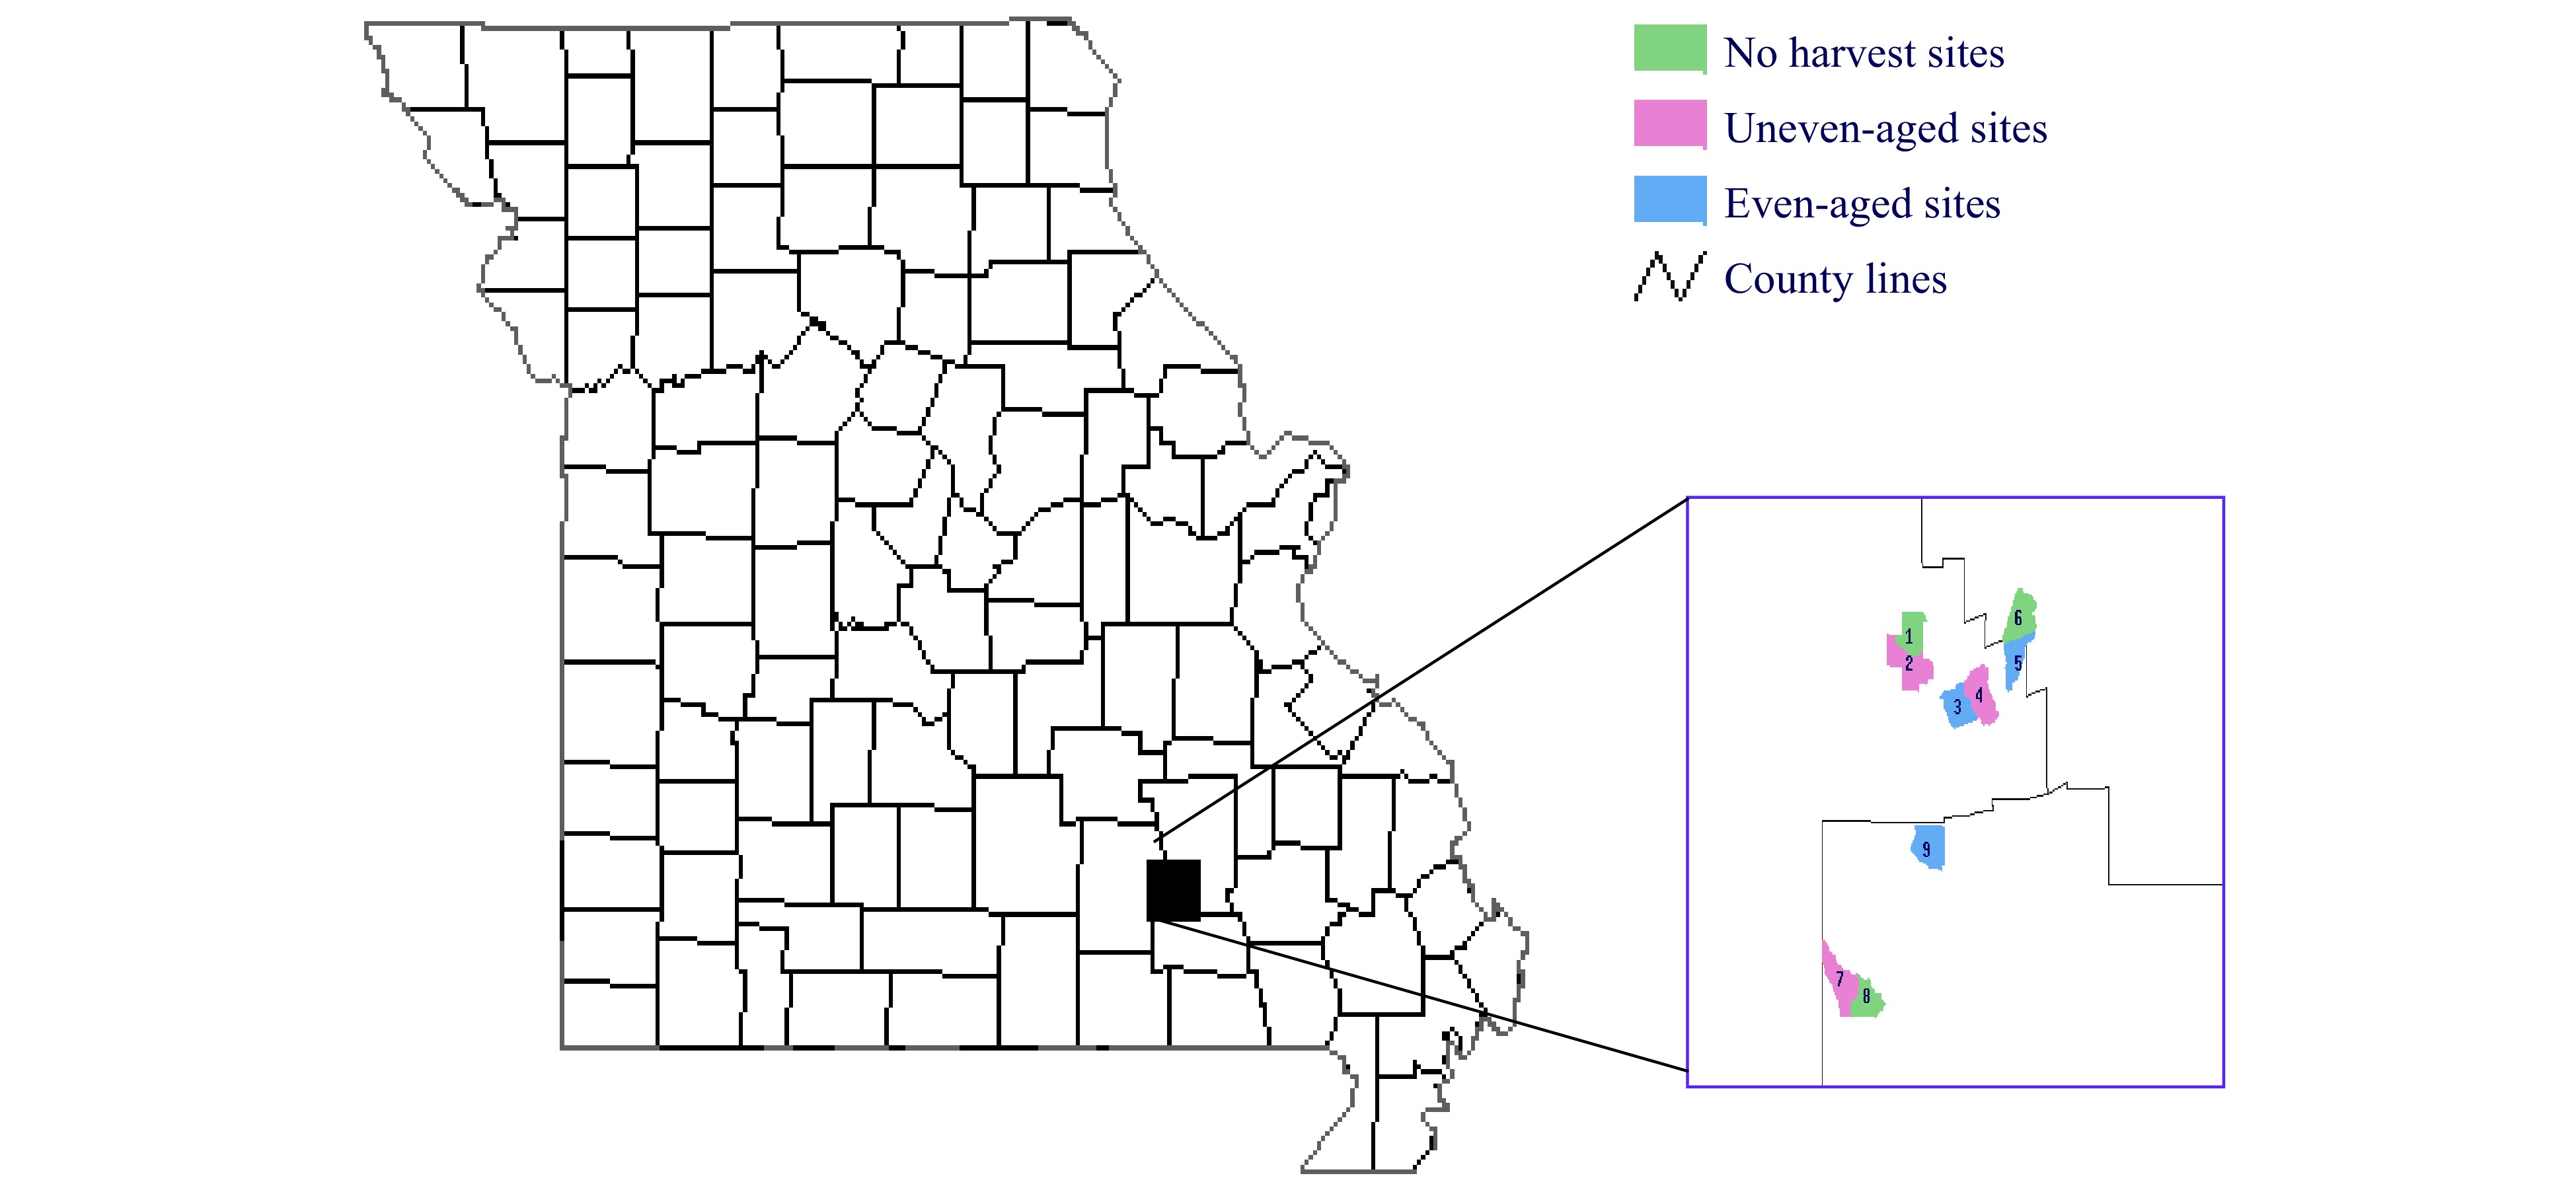
Figure 1. Location of the nine Missouri Ozark Forest Ecosystem Project (MOFEP) experimental sites. Sites range from 314 to 515 ha and are located in Carter, Shannon, and Reynolds County, Missouri, USA.
-
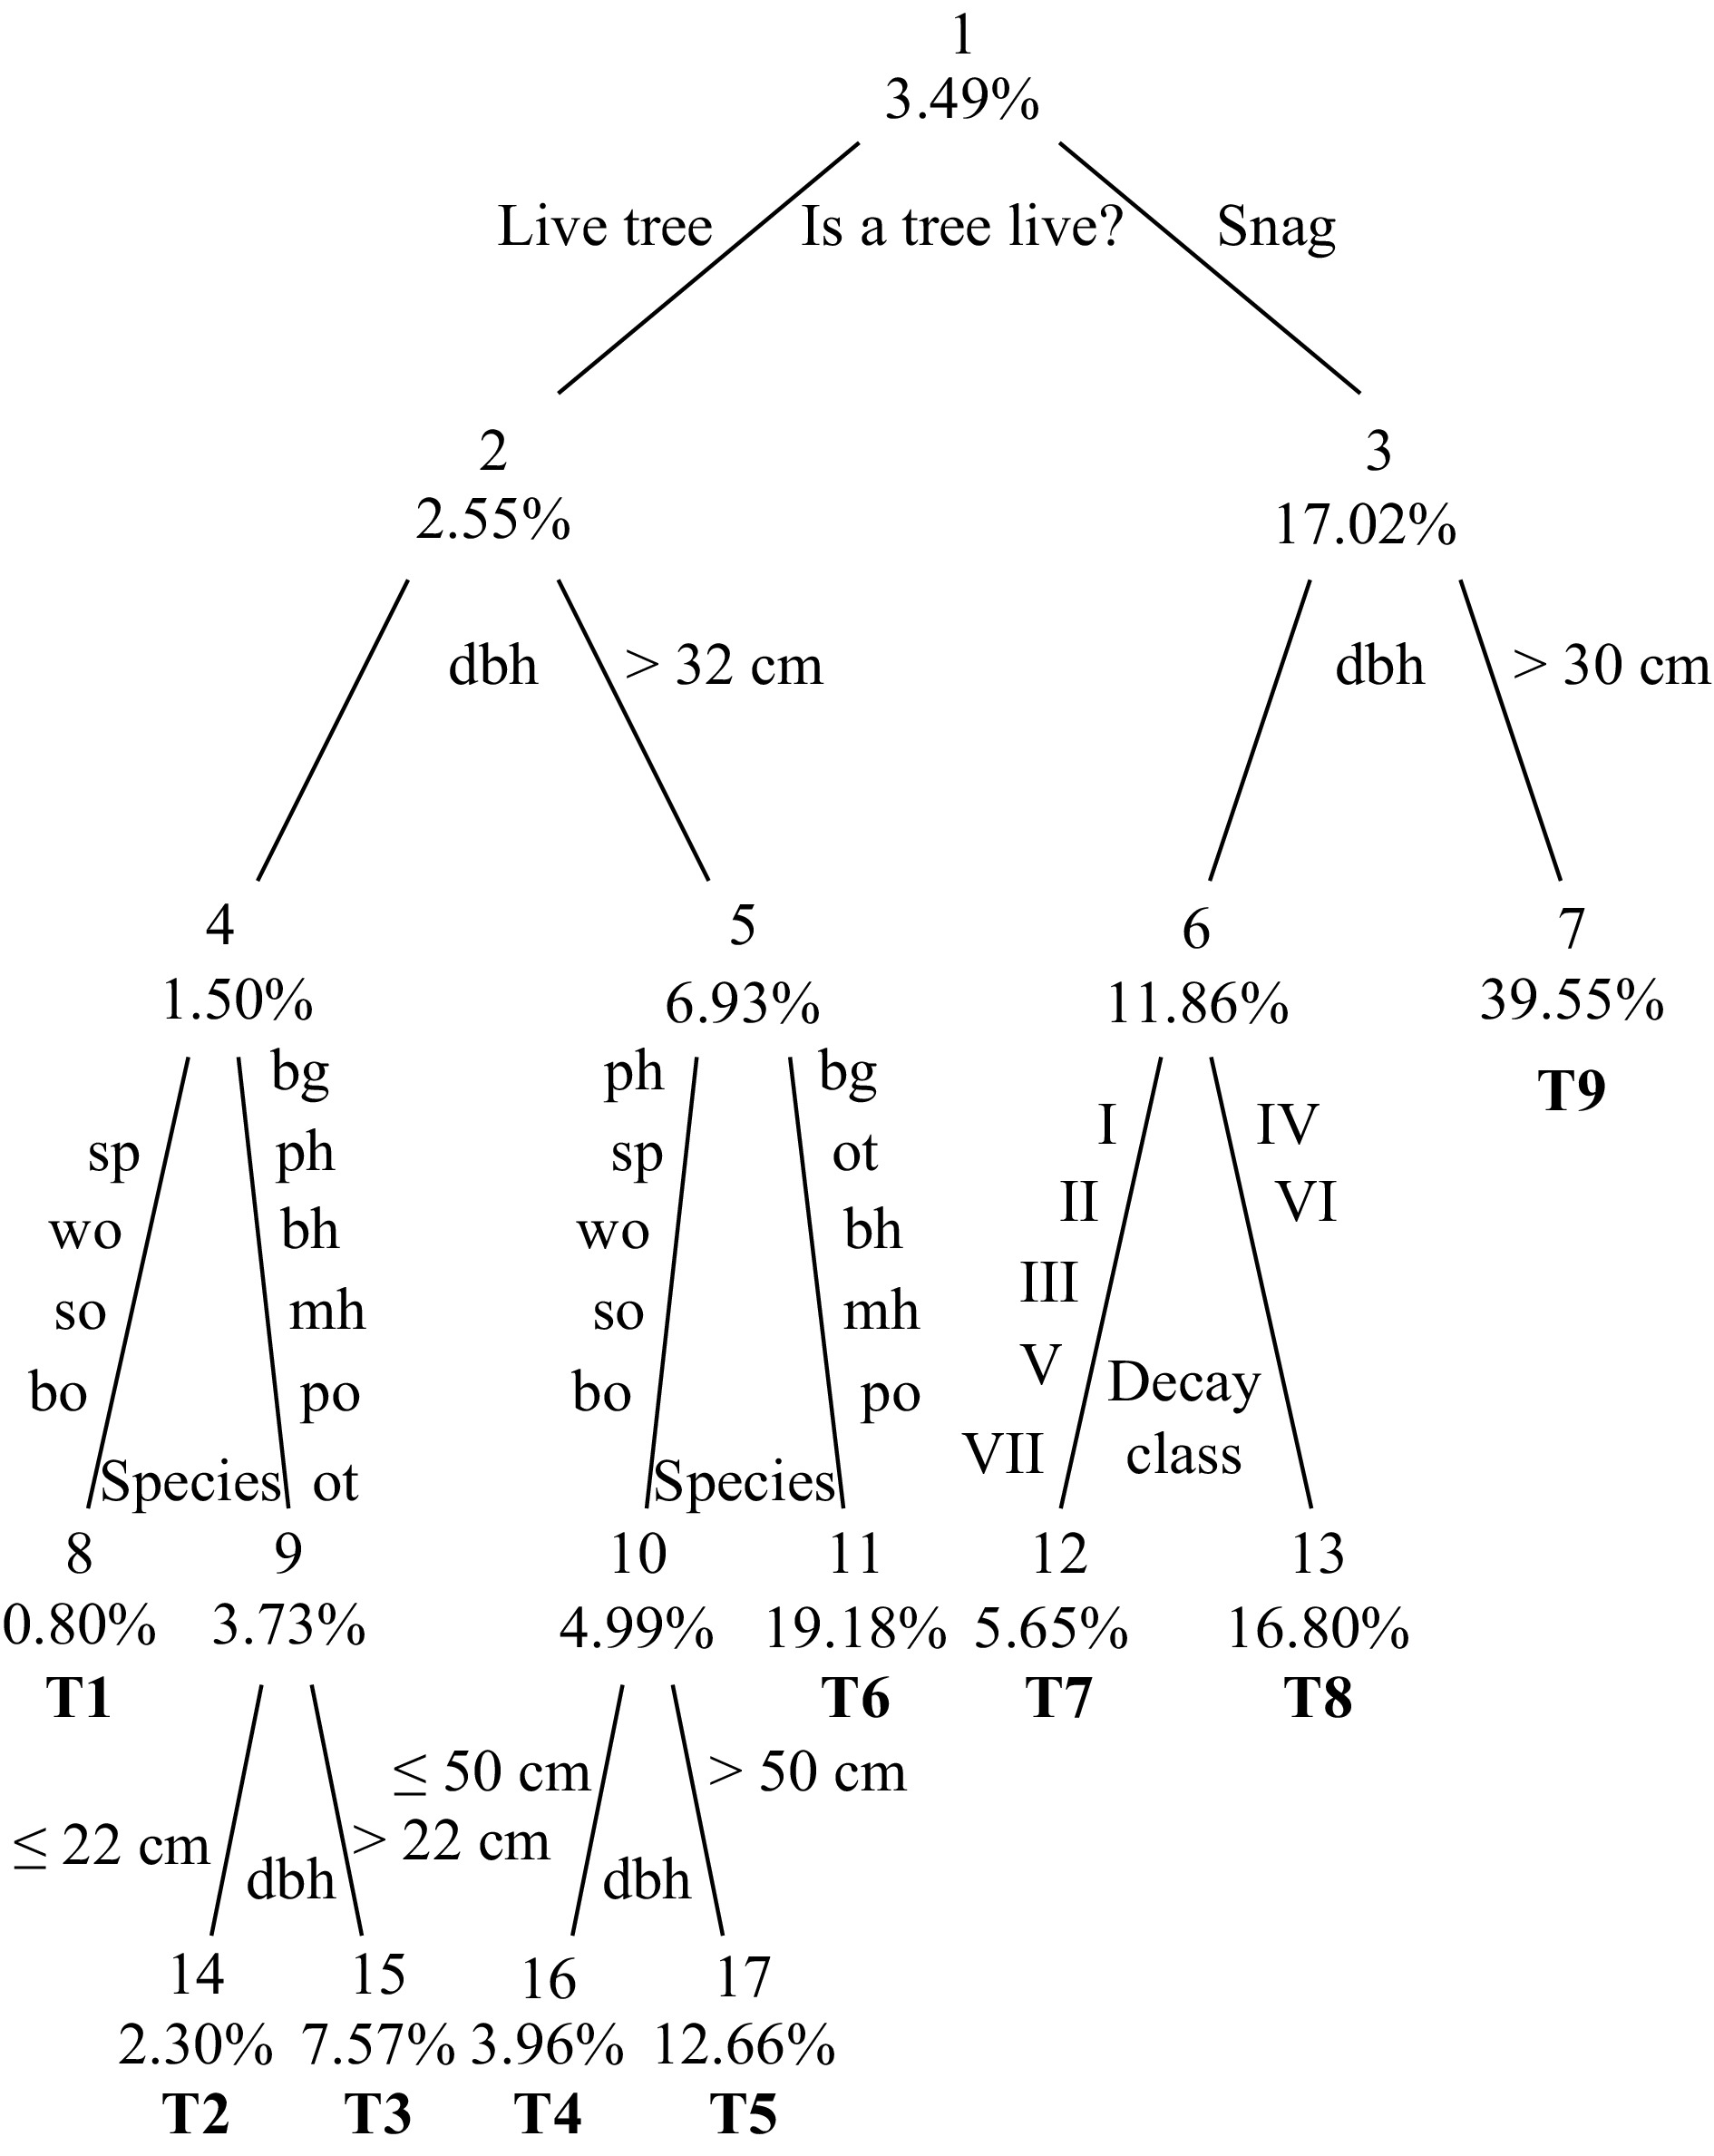
Figure 2. The classification and regression tree (CART) classifier of cavity tree distribution based on tree attributes. Nodes are numbered 1 through 17, and terminal nodes have the additional labels T1 through T9. Groups of nodes (nodes 2, 3; nodes 4, 5, 6, 7; nodes 8, 9, 10, 11, 12, 13; and nodes T1 through T9) represent strata in a hierarchical system of the CART model based on tree status (live or dead), diameter at breast height (dbh), species, and decay class.
-
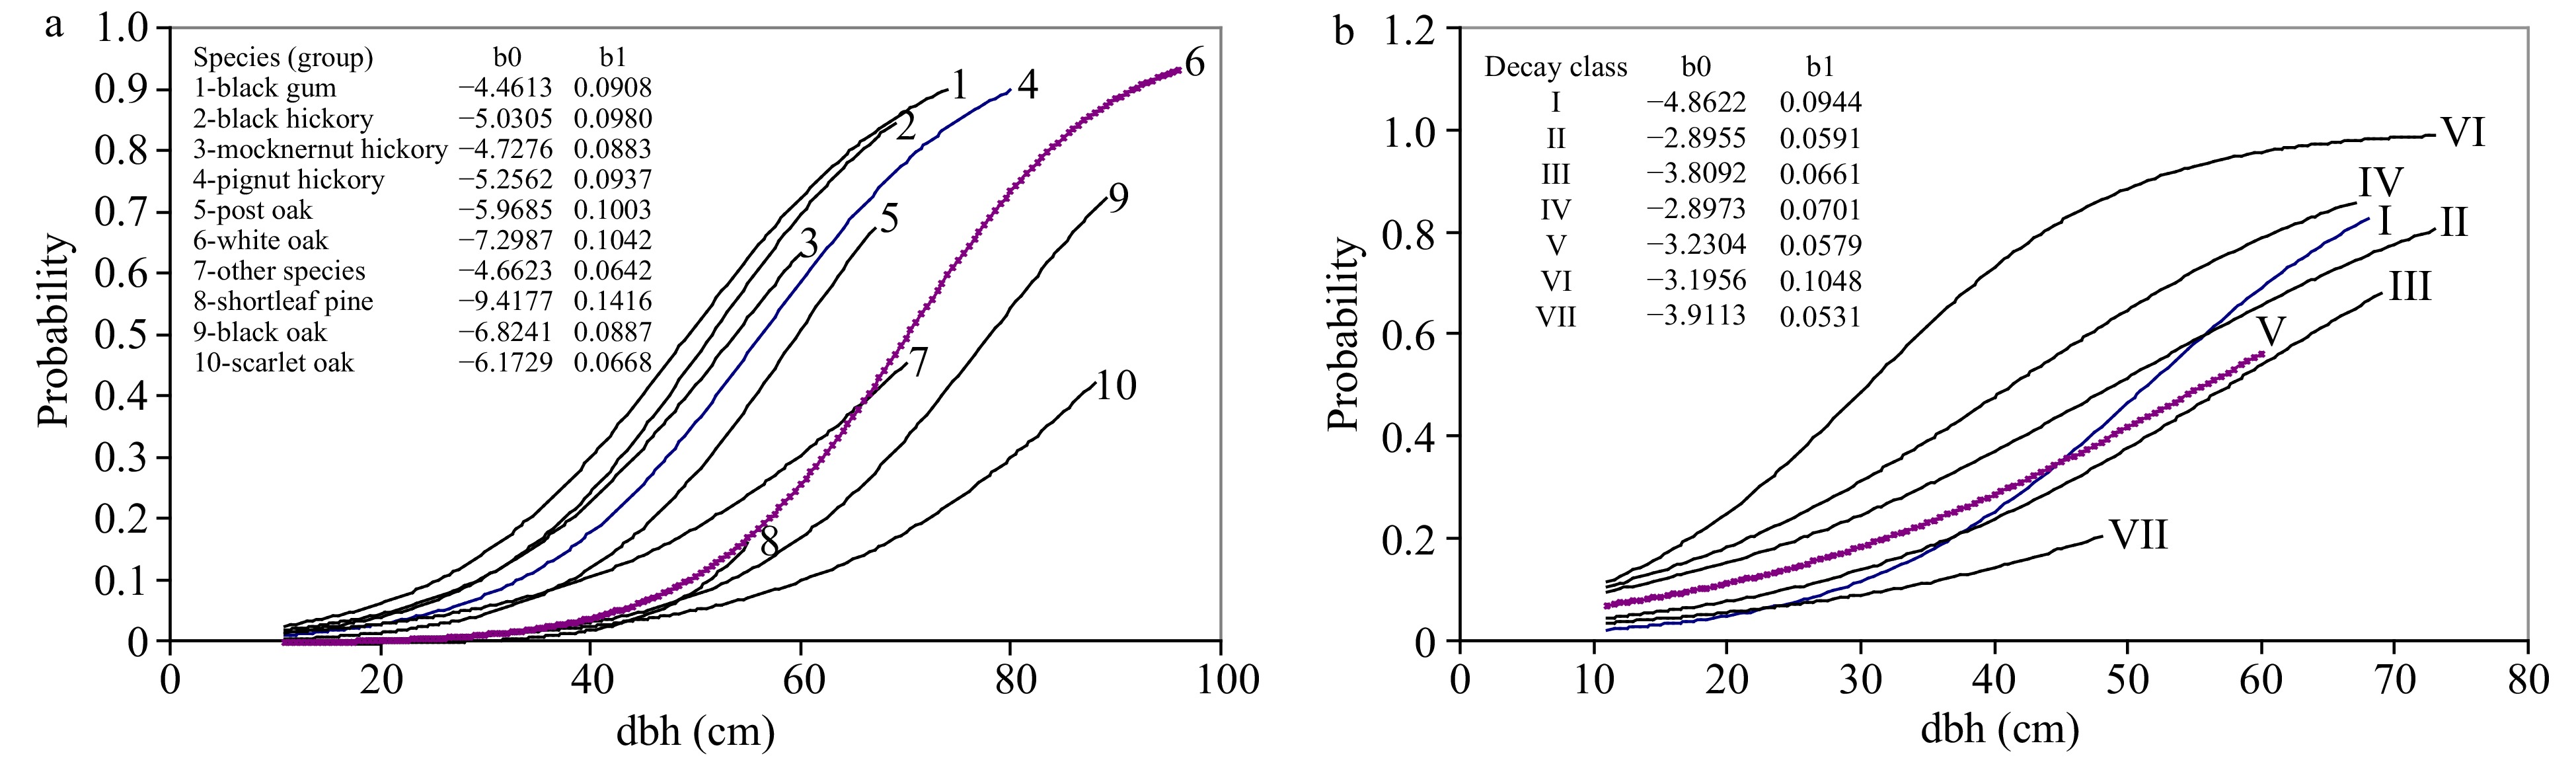
Figure 3. Change in the probability that a tree bears at least one cavity predicted by the logistic regression (LR) model for (a) live trees and (b) dead trees. The estimated regression coefficients for the LR models were listed besides the fitted probability curves.
-

Figure 4. Changes in the mean CTD and 95% CI with virtual spatial scales: (a) test dataset; (b) sample mean (design-based) method; (c) CART model; (d) LR model. The mean CTD and 95% CI were estimated based on 100 simulation runs.
-

Figure 5. Changes in the mean relative error (RE) and 95% CI with virtual spatial scales: (a) sample mean method; (b) CART model; (c) LR model; (d) relative efficiency (REFF) of the CART and LR models relative to the sample mean (design-based) method. The change of REFF with spatial scales in panel (d) showed that compared with the LR model and the sample mean (design-based) method, the application of CART model and additional tree information could greatly reduce relative errors in CTD prediction at large spatial scales (sample sizes).
Figures
(5)
Tables
(0)