-
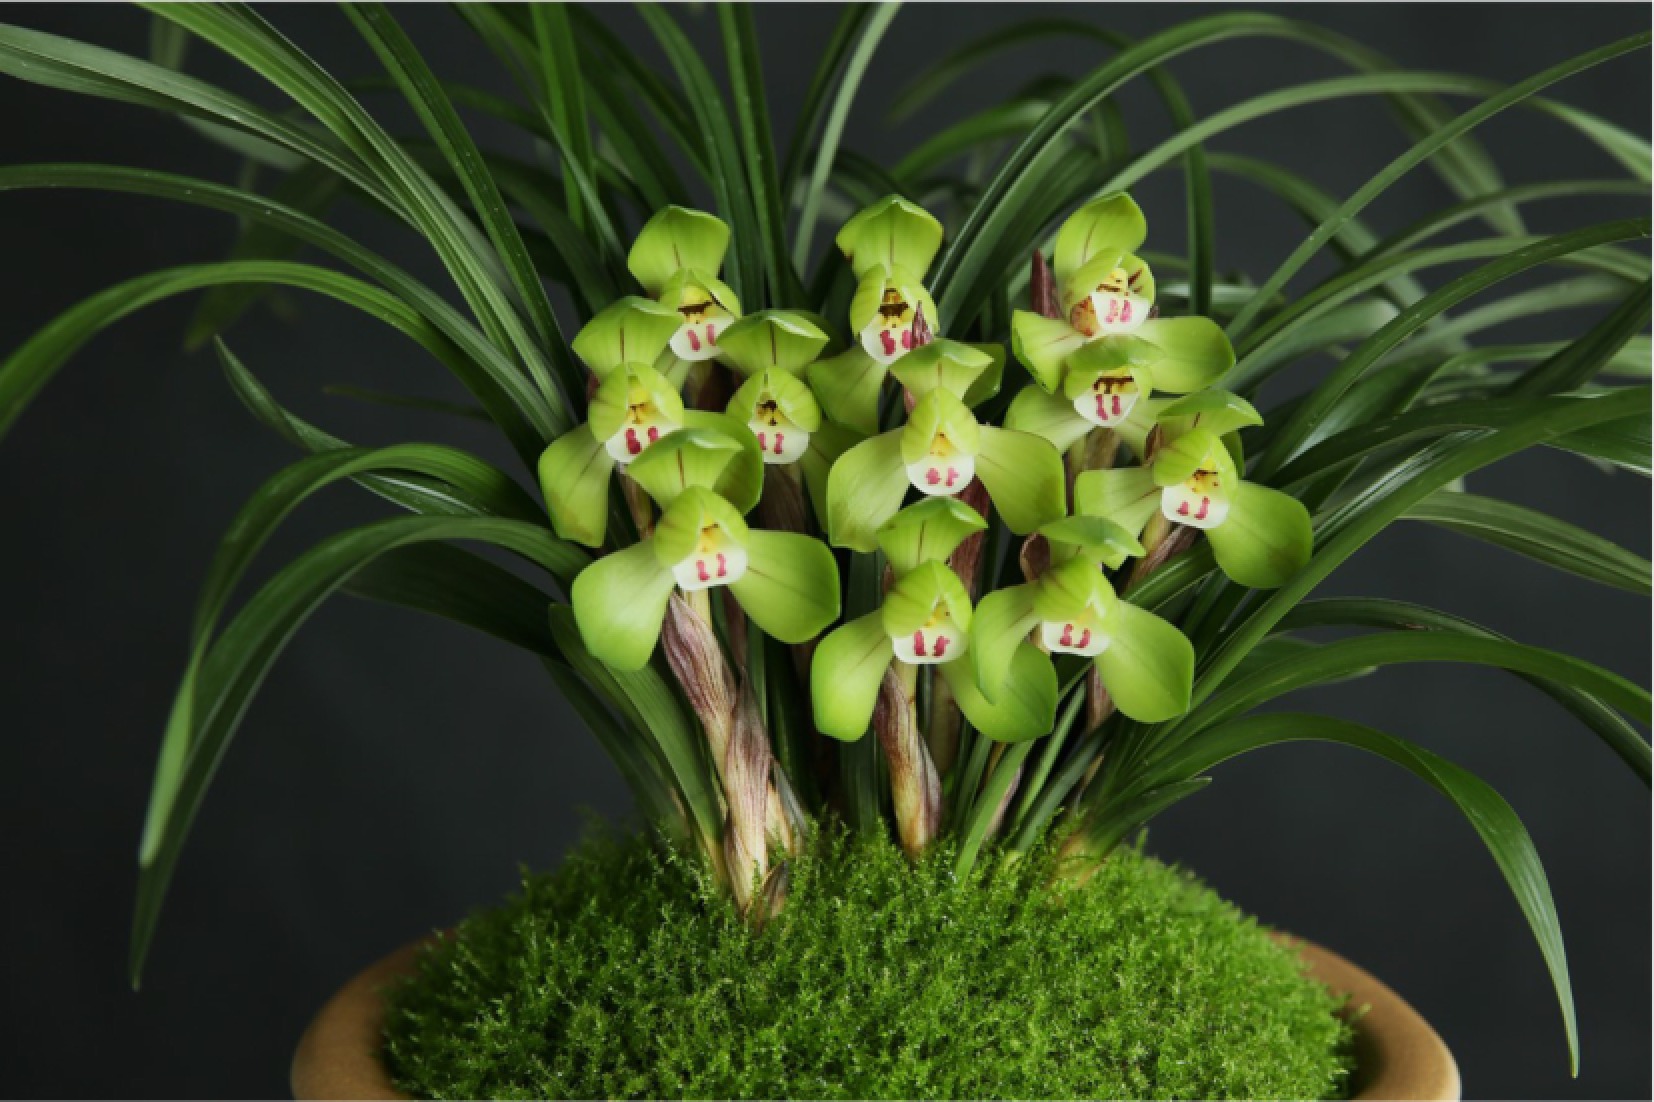
Figure 1.
A flowering plant of Cymbidium goeringii 'Da Fu Gui'.
-
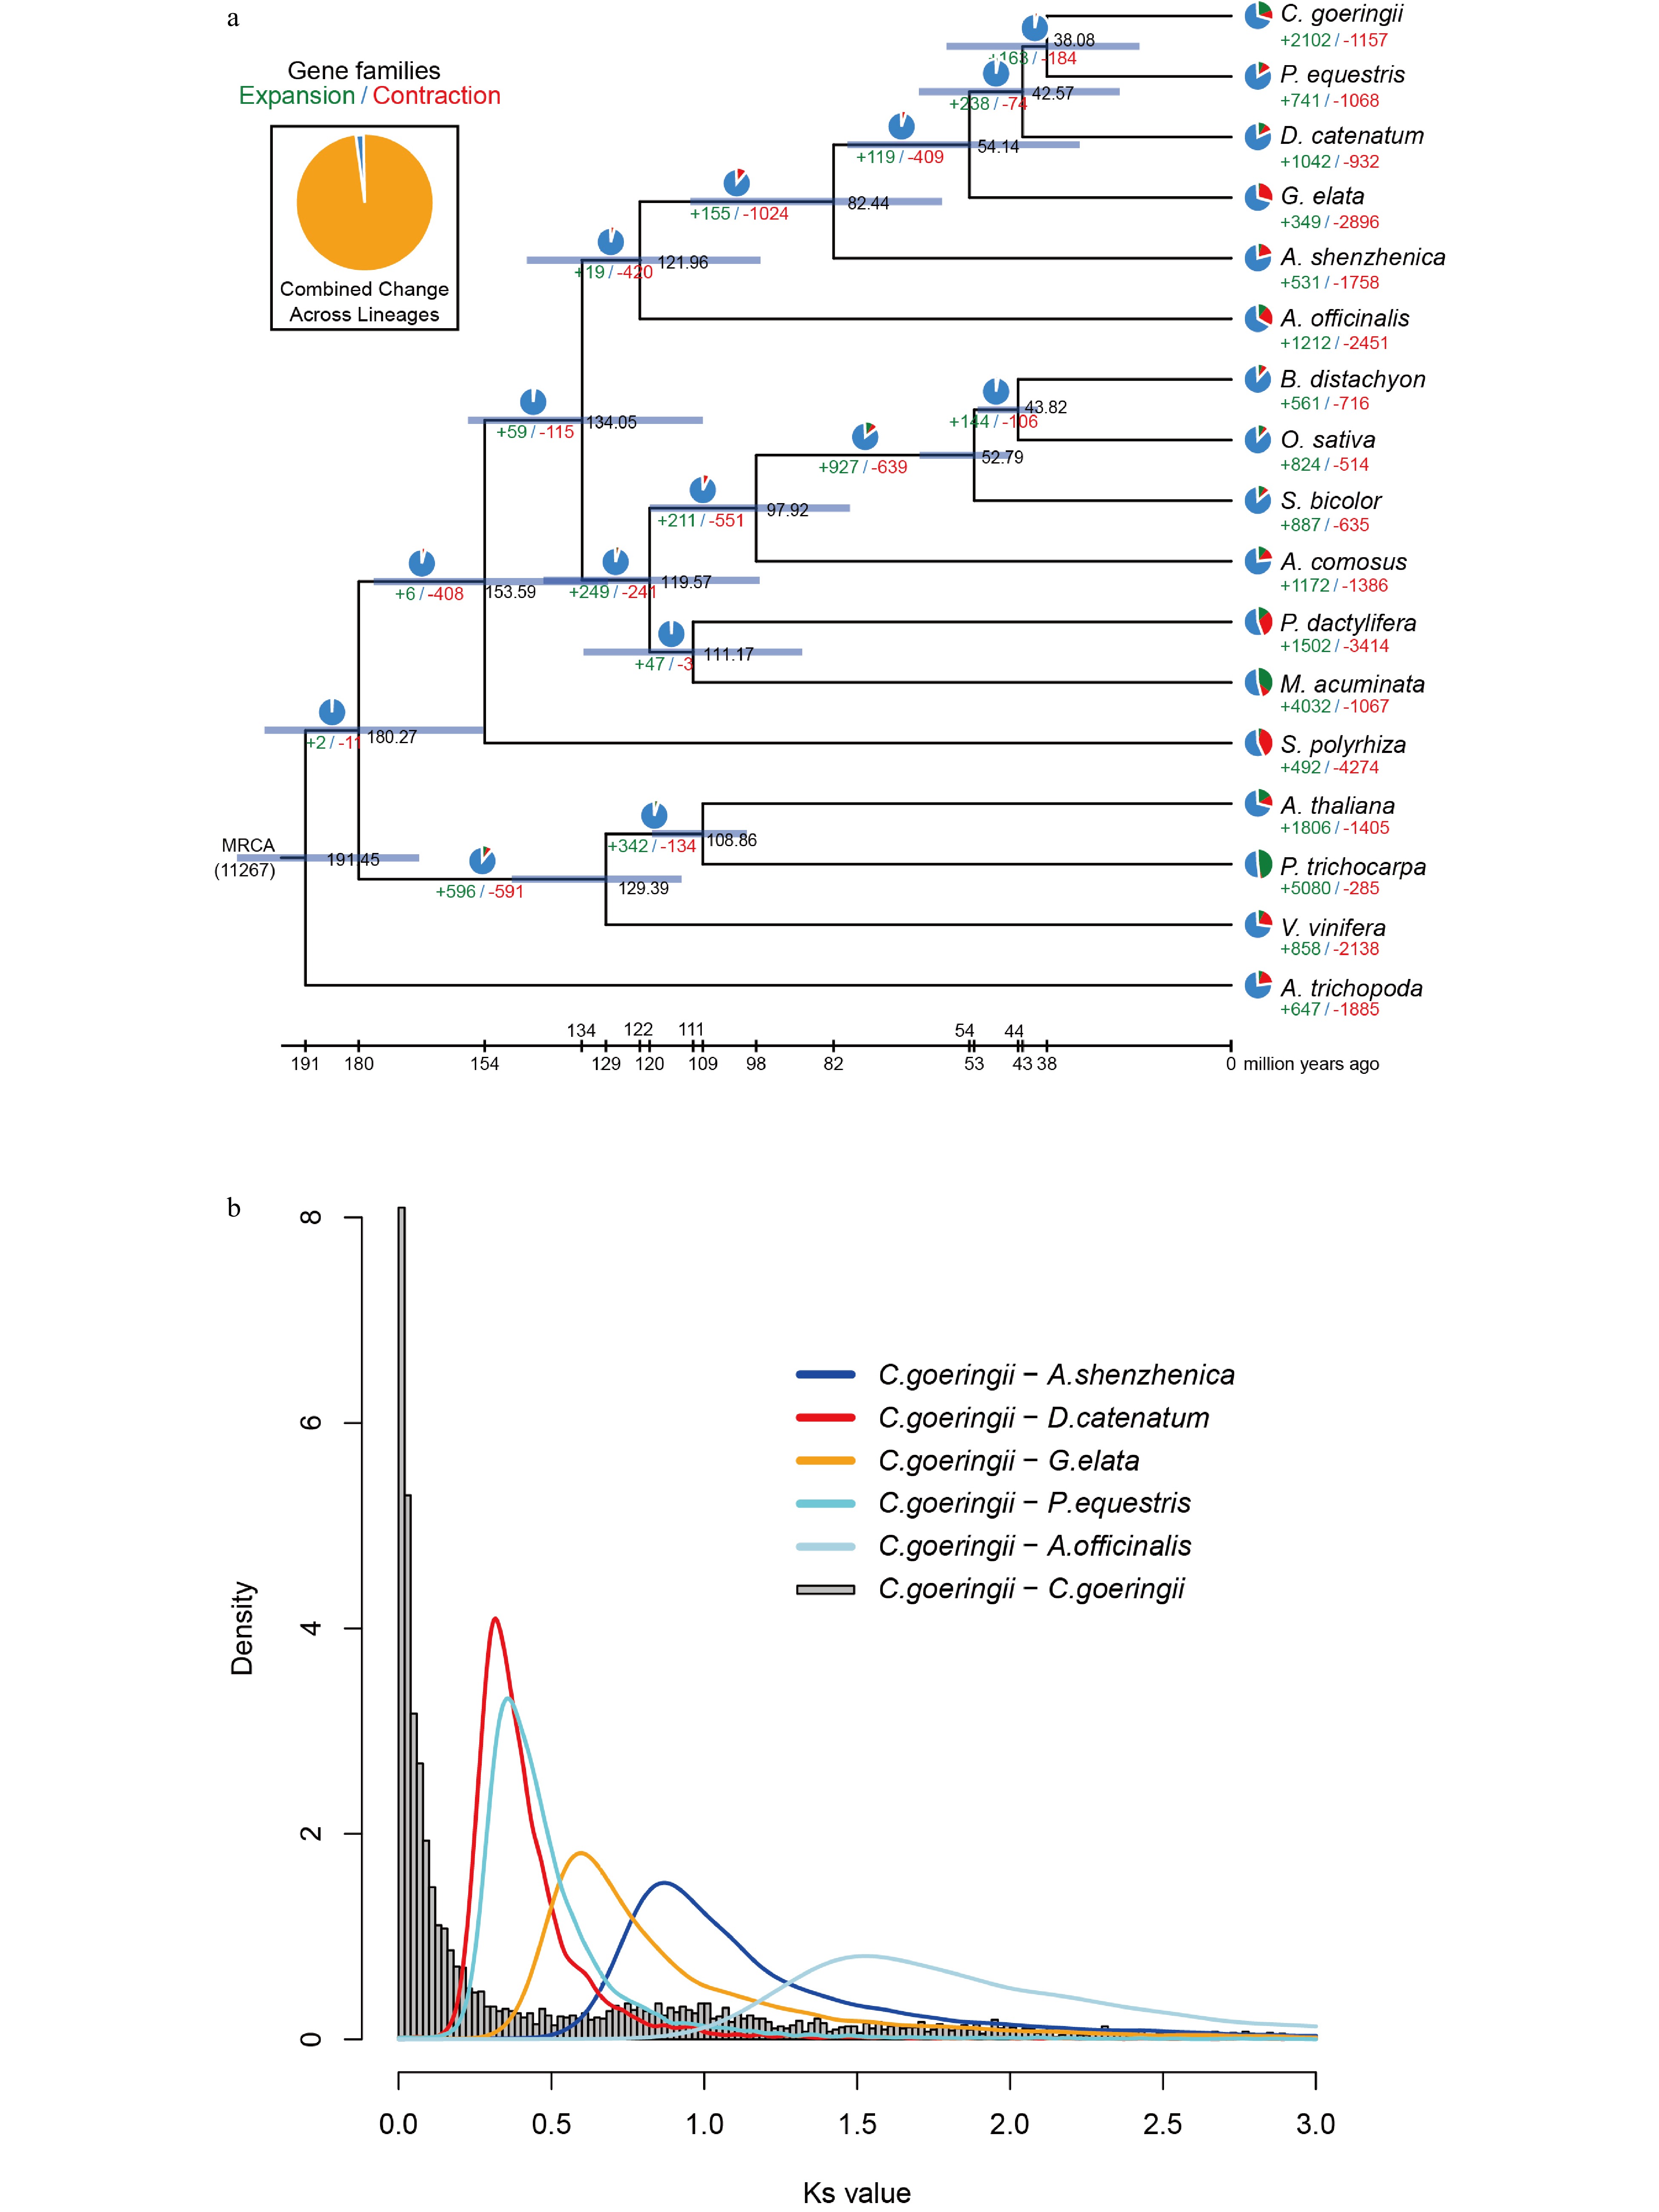
Figure 2.
Gene family evolution and whole-genome duplication of the C. goeringii genome. (a) The expansion and contraction of gene families and phylogenetic relationships and divergence times between C. goeringii and other plant species. The numbers in green represent the number of expanded gene families, and the numbers in red represent the number of contracted gene families. The blue colour in the circle indicates the gene families with a constant copy number. (b) Ks distribution of C. goeringii. C. goeringii showed two peaks at 0.8−1.0 and 1.7, indicating that C. goeringii experienced a τ event and a WGD event shared with the other extant orchids.
-
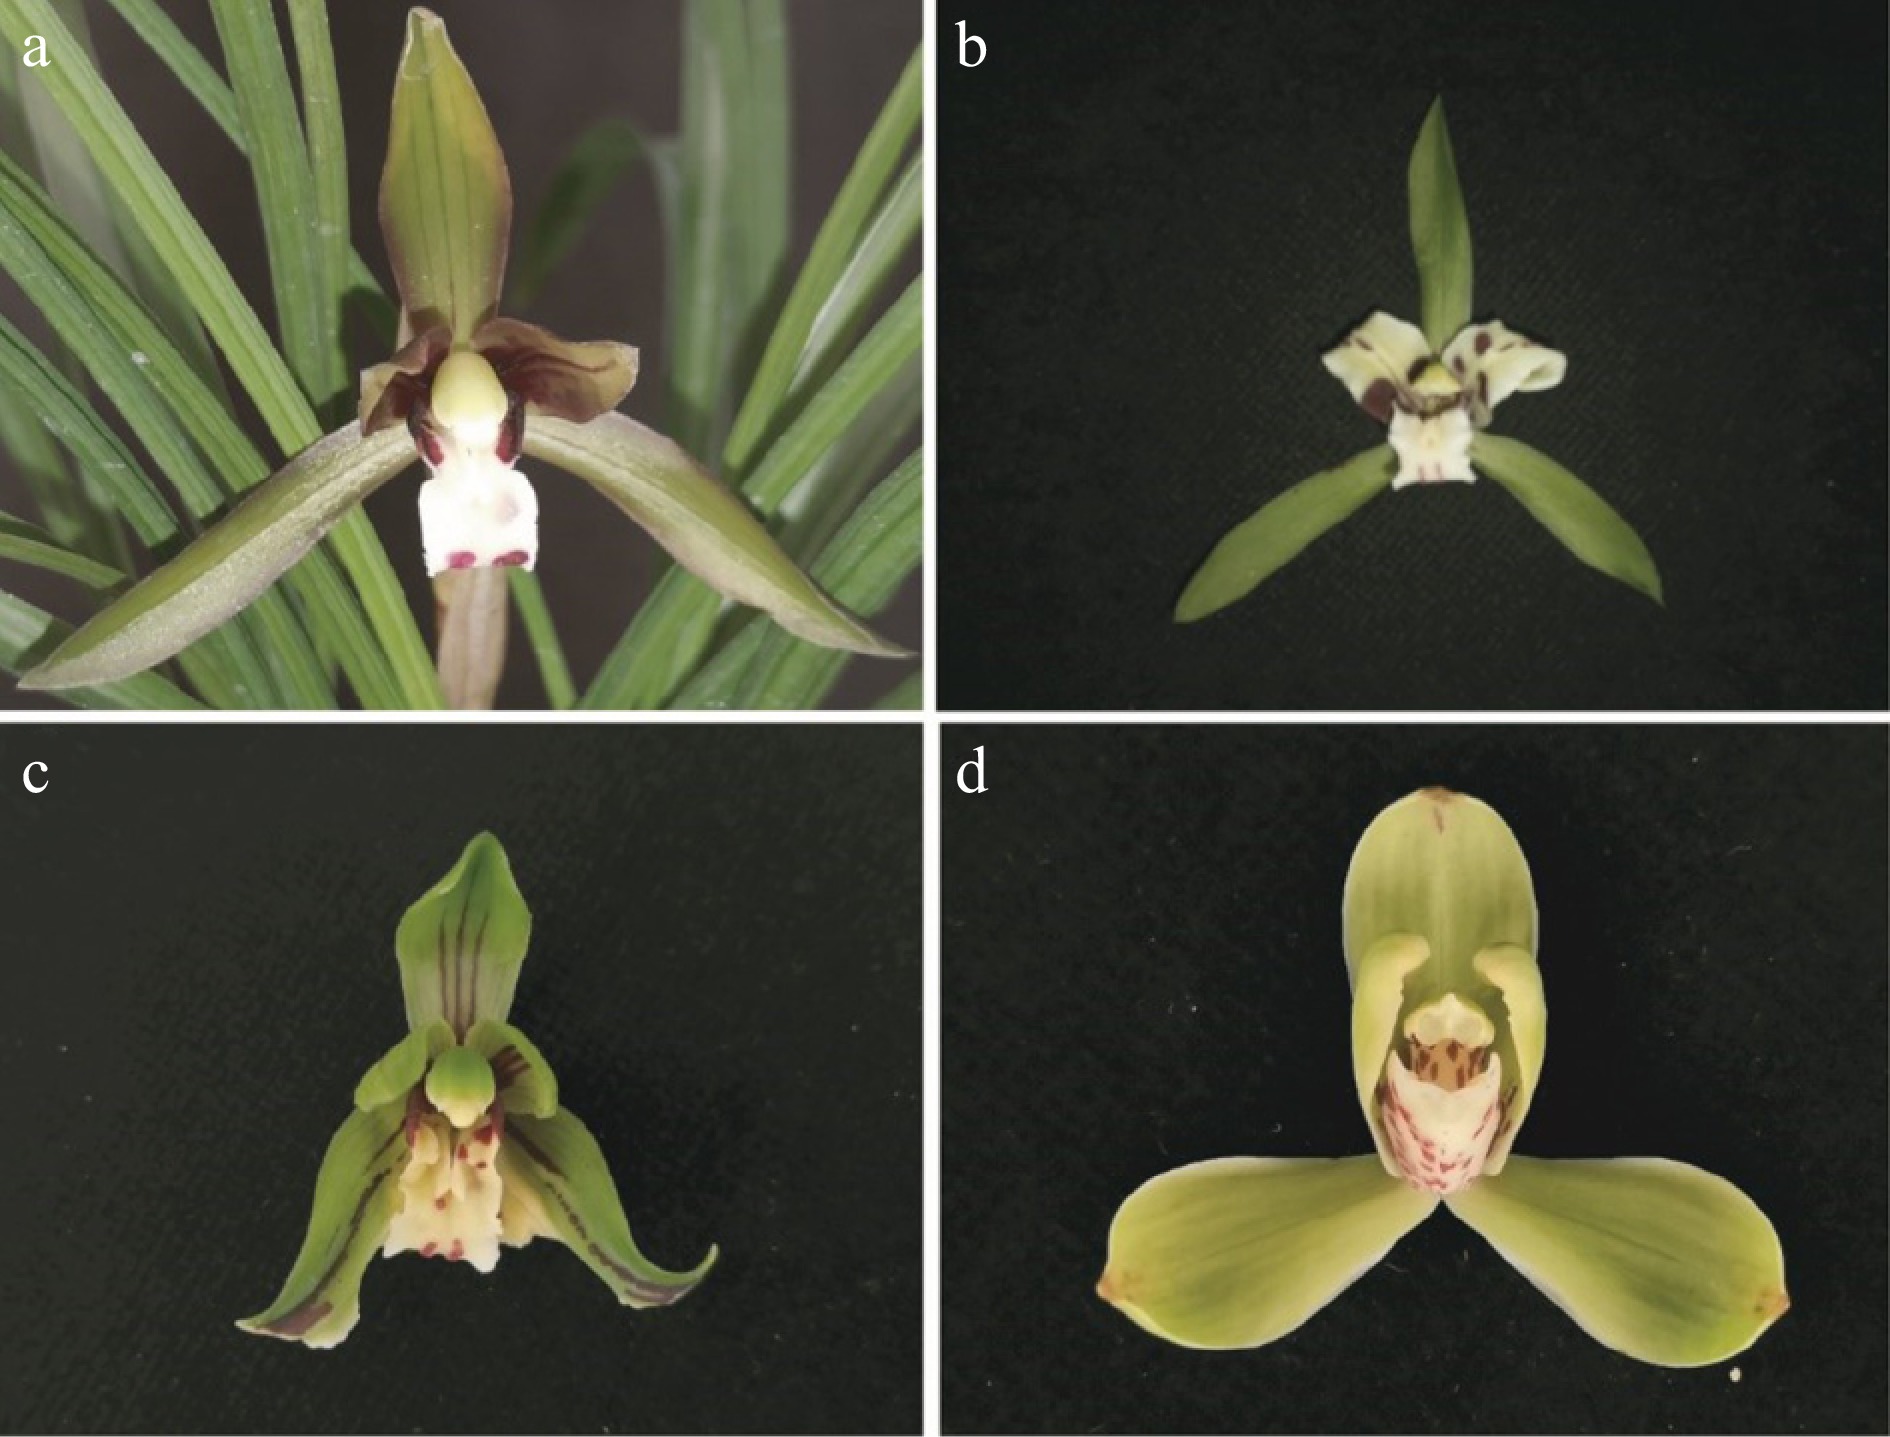
Figure 3.
Normal flower morphology and mutants. (a) Normal flower; (b) lip-like petal mutant; (c) lip-like sepal mutant; (d) column-like petal mutant.
-
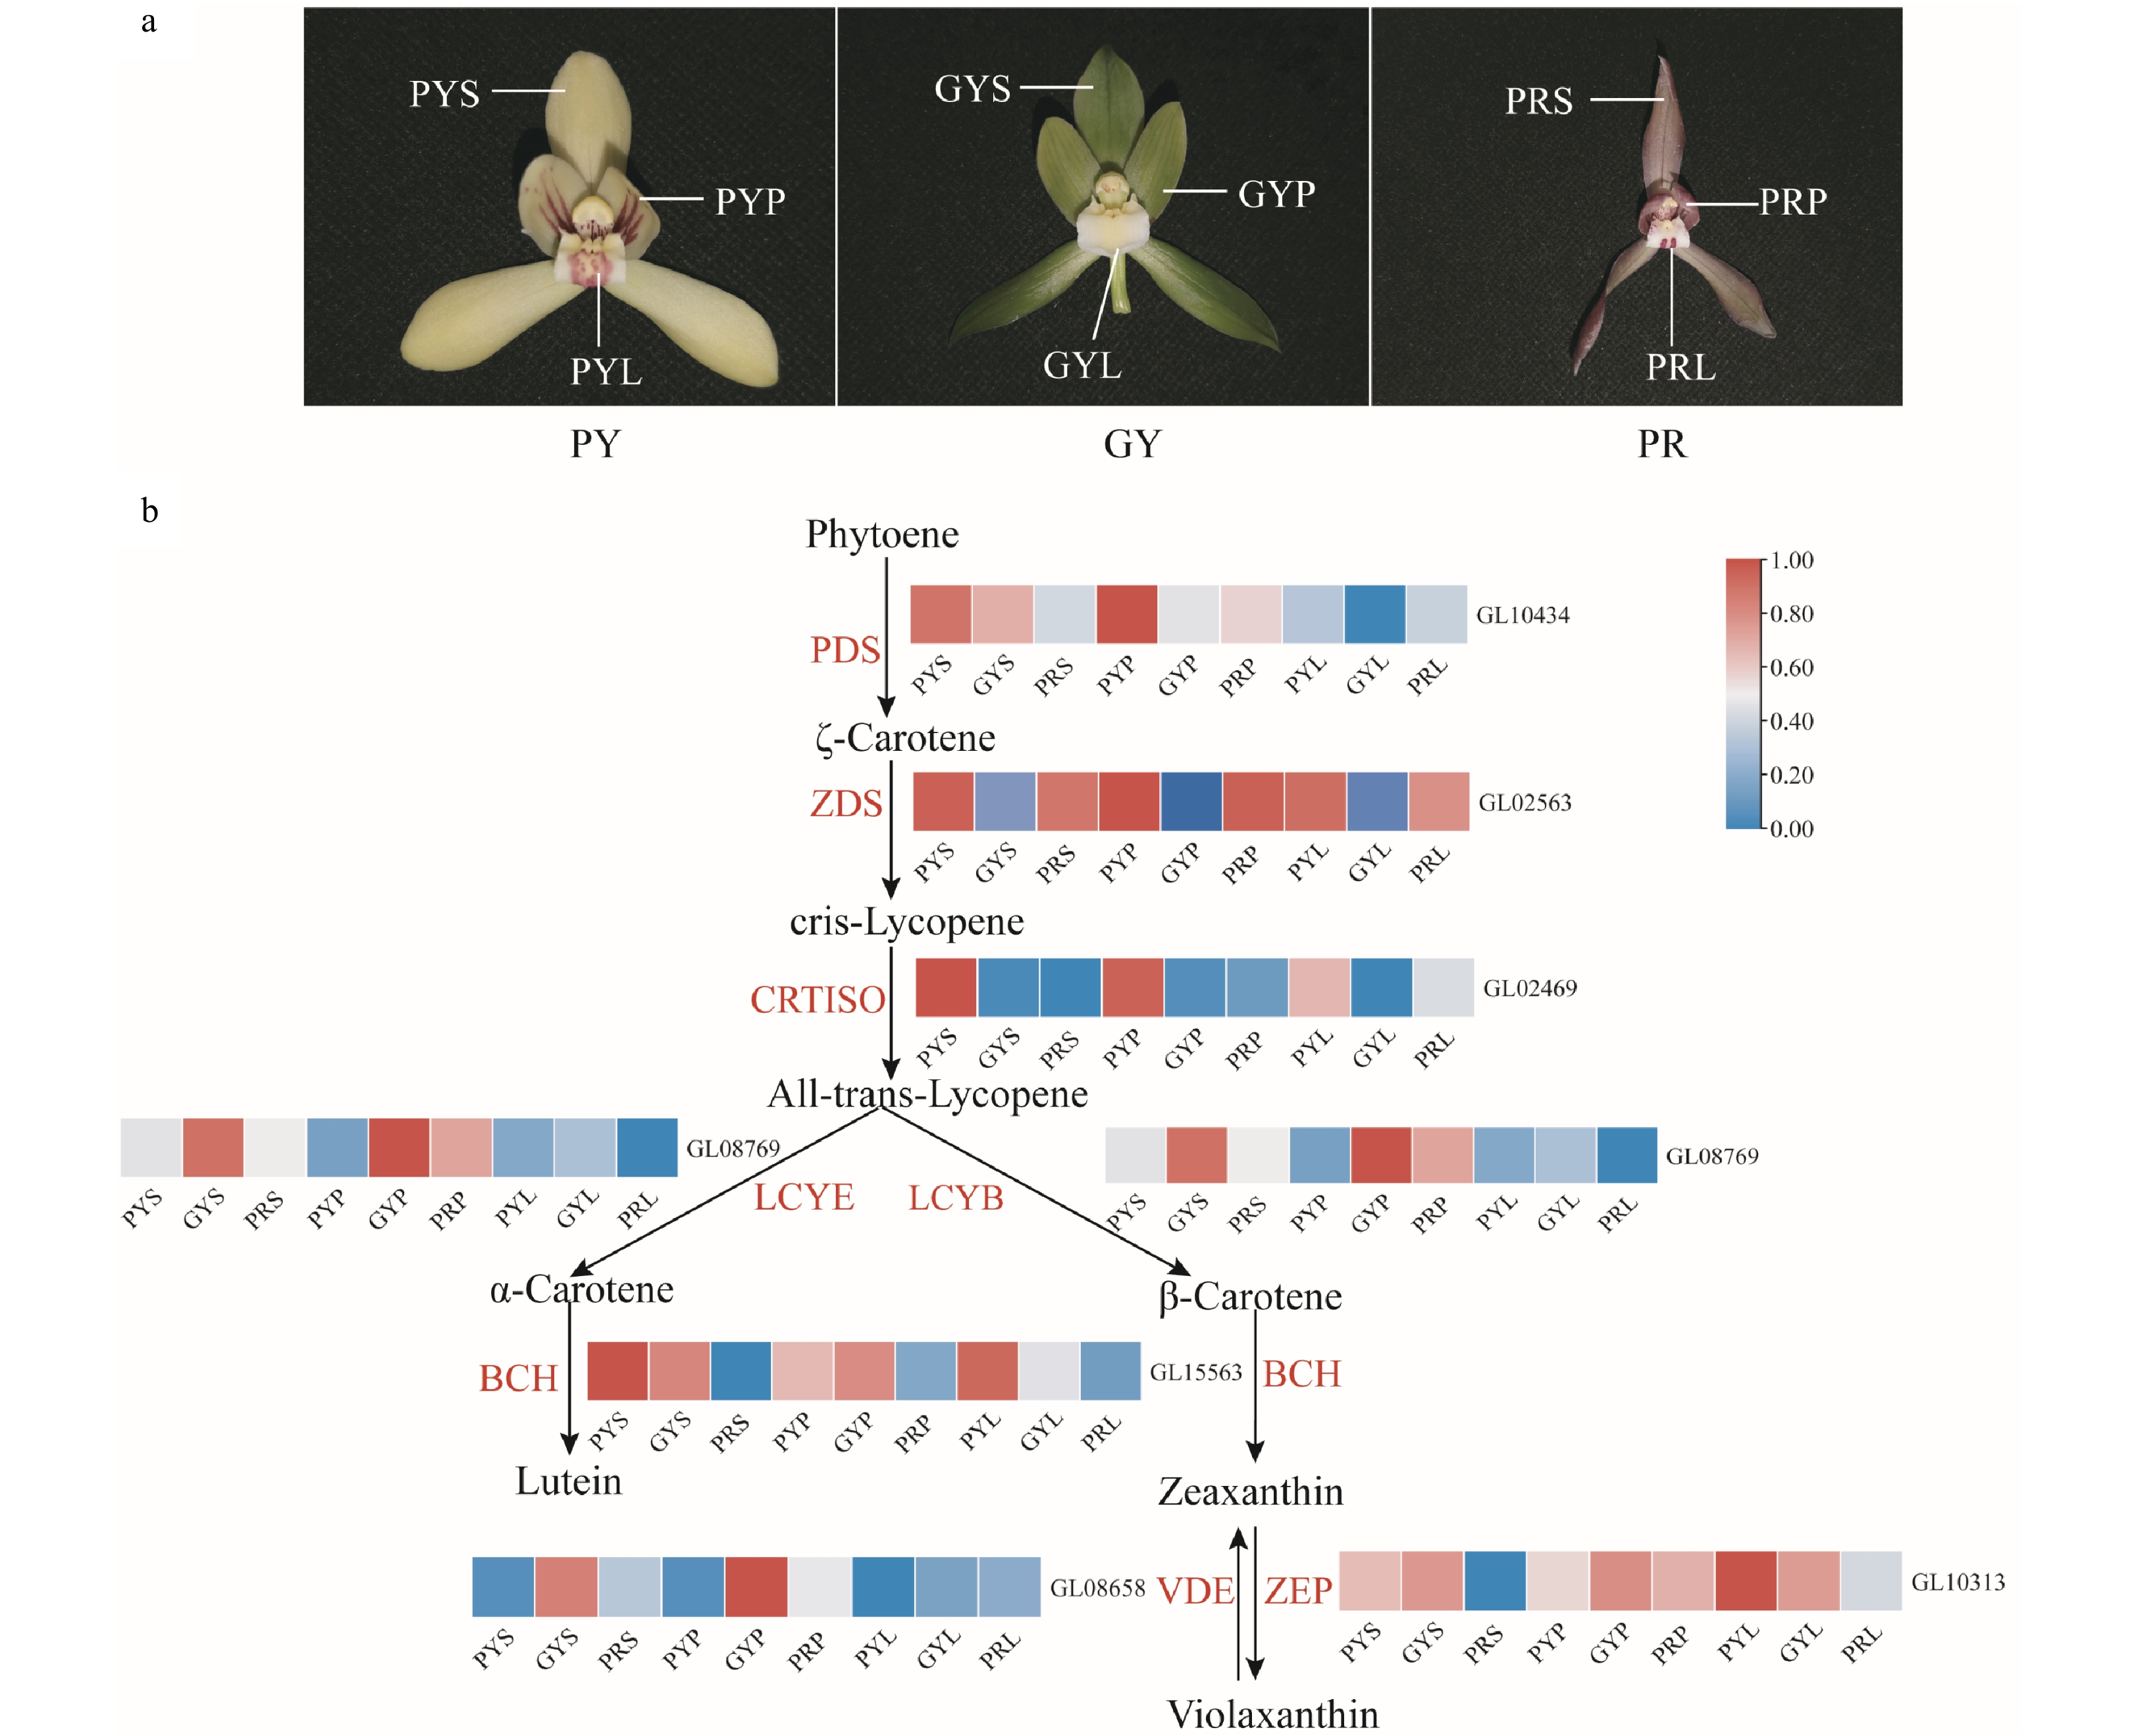
Figure 4.
Expression regulation of carotenoid metabolic pathway-related genes involved in flower colours in C. goeringii. (a) Three flower colour types. PY, pale-yellow flower with purple-red spots; GY, green-yellow flower; PR, purple-red flower. (b) The pathway of floral carotenoid biosynthesis. PYS, sepals of pale-yellow flowers with purple-red spots; PYP, petals of pale-yellow flowers with purple-red spots; PYL, lips of pale-yellow flowers with purple-red spots; GYS, sepals of green-yellow flower; GYP, petals of green-yellow flower; GYL, lips of green-yellow flower; PRS, sepals of purple-red flower; PRP, petals of purple-red flower; PRL, lips of purple-red flower. The heatmap was plotted from the FPKM value and performed with min-max normalisation. Red indicates high levels of expression, while blue indicates low levels of expression. The abbreviated names of enzymes (for full names see Supplemental Table S23) involved at each step are shown in red in each catalytic step[18].
-
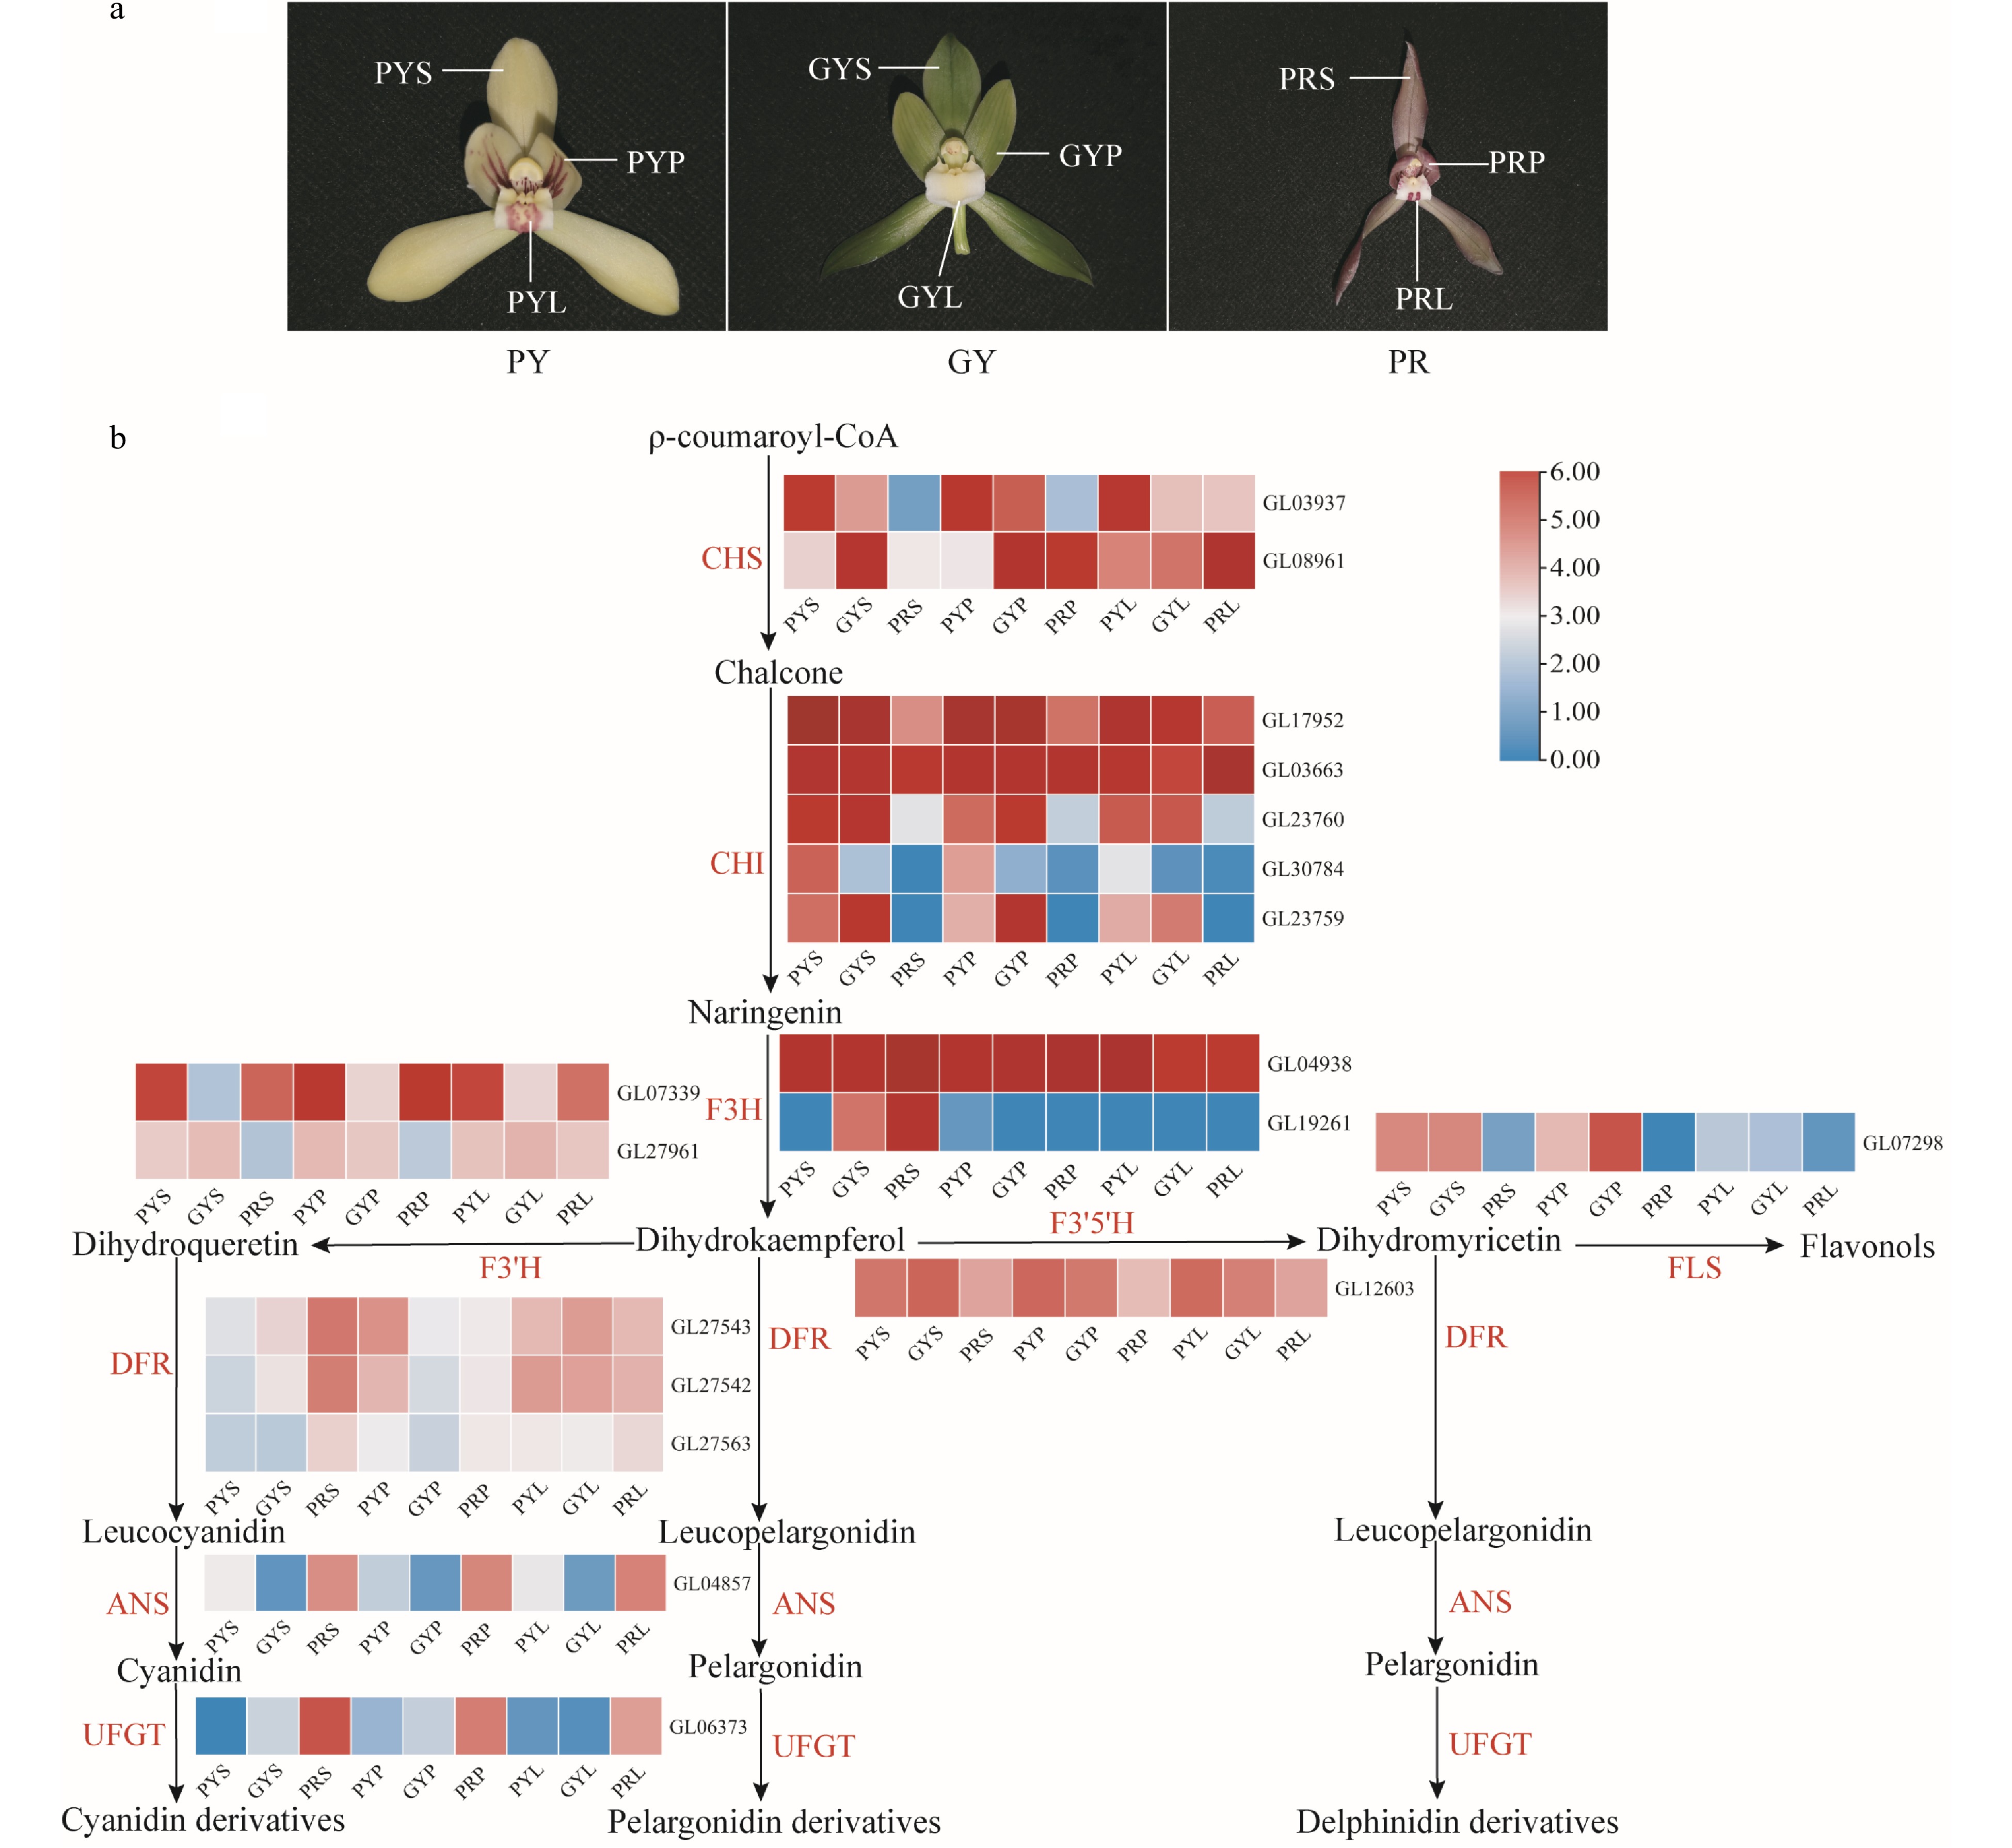
Figure 5.
Expression regulation of anthocyanin metabolic pathway-related genes involved in coloured flowers of C. goeringii. (a) Three flower colour types. PY, pale-yellow flower with purple-red spots; GY, green-yellow flower; PR, purple-red flower. (b). The pathway of floral anthocyanin biosynthesis. PYS, sepals of pale-yellow flower with purple-red spots; PYP, petals of pale-yellow flower with purple-red spots; PYL, lips of pale-yellow flower with purple-red spots; GYS, sepals of green-yellow flower; GYP, petals of green-yellow flower; GYL, lips of green-yellow flower; PRS, sepals of purple-red flower; PRP, petals of purple-red flower; PRL, lips of purple-red flower. The heatmap was plotted from the FPKM value and performed using min-max normalisation. The red indicates high levels of expression, while blue indicates low levels of expression. The abbreviated names of enzymes (for full names seeSupplemental Table S23) in each catalytic step[19] are shown in red.
-
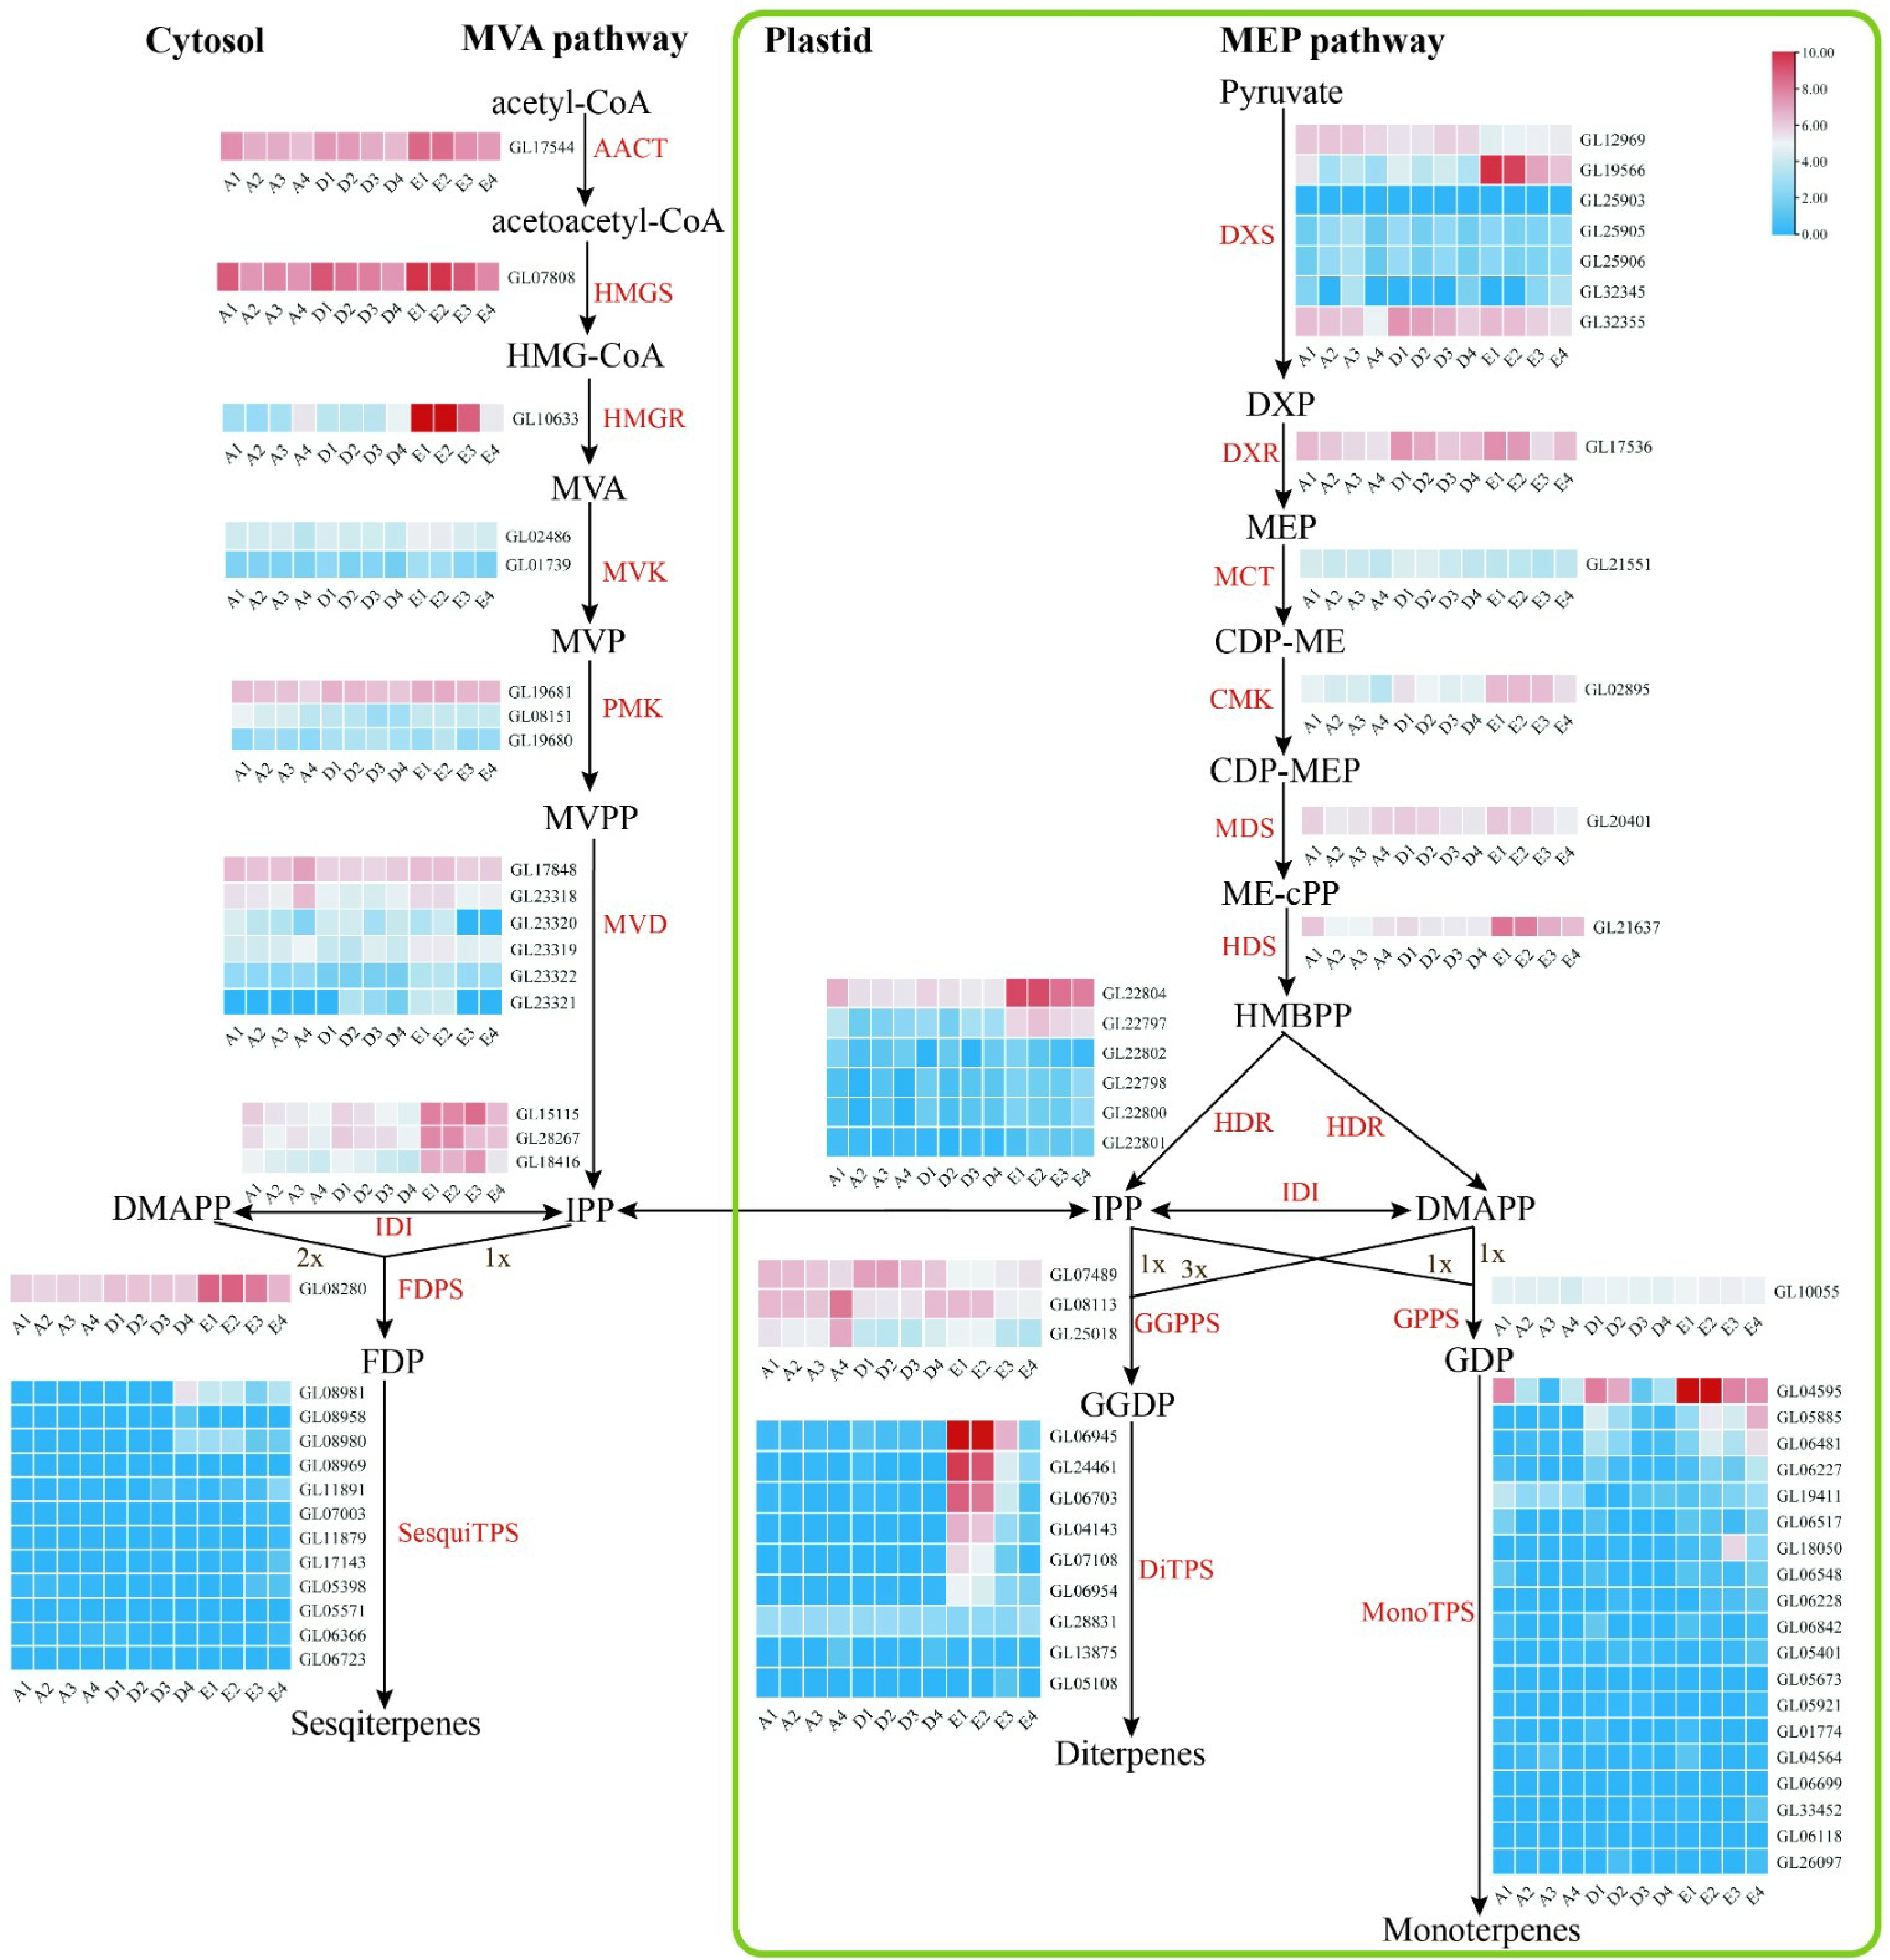
Figure 6.
Floral scent metabolic pathway and expression regulation of genes in C. goeringii. Tissue-specific relative expression profiles (red–blue scale) of genes implicated in terpenoid biosynthesis (heat map). Intermediates are shown in black, and the enzymes (for full names see Supplemental Table S23) involved in each step are shown in red. A1, sepals of 0.5−0.8 cm floral bud; A2, petals of 0.5−0.8 cm floral bud; A3, lips of 0.5−0.8 cm floral bud; A4, column of 0.5−0.8 cm floral bud; B1, sepals of 2−2.5 cm floral bud; B2, petals of 2−2.5 cm floral bud; B3, lips of 2−2.5 cm floral bud; B4, column of 2−2.5 cm floral bud; C1, sepals of blooming flower; C2, petals of blooming flower; C3, lips of blooming flower; C4, column of blooming flower. The abbreviated names of enzymes (for full names see Supplemental Table S23) in each catalytic step[24] are shown in red.
-
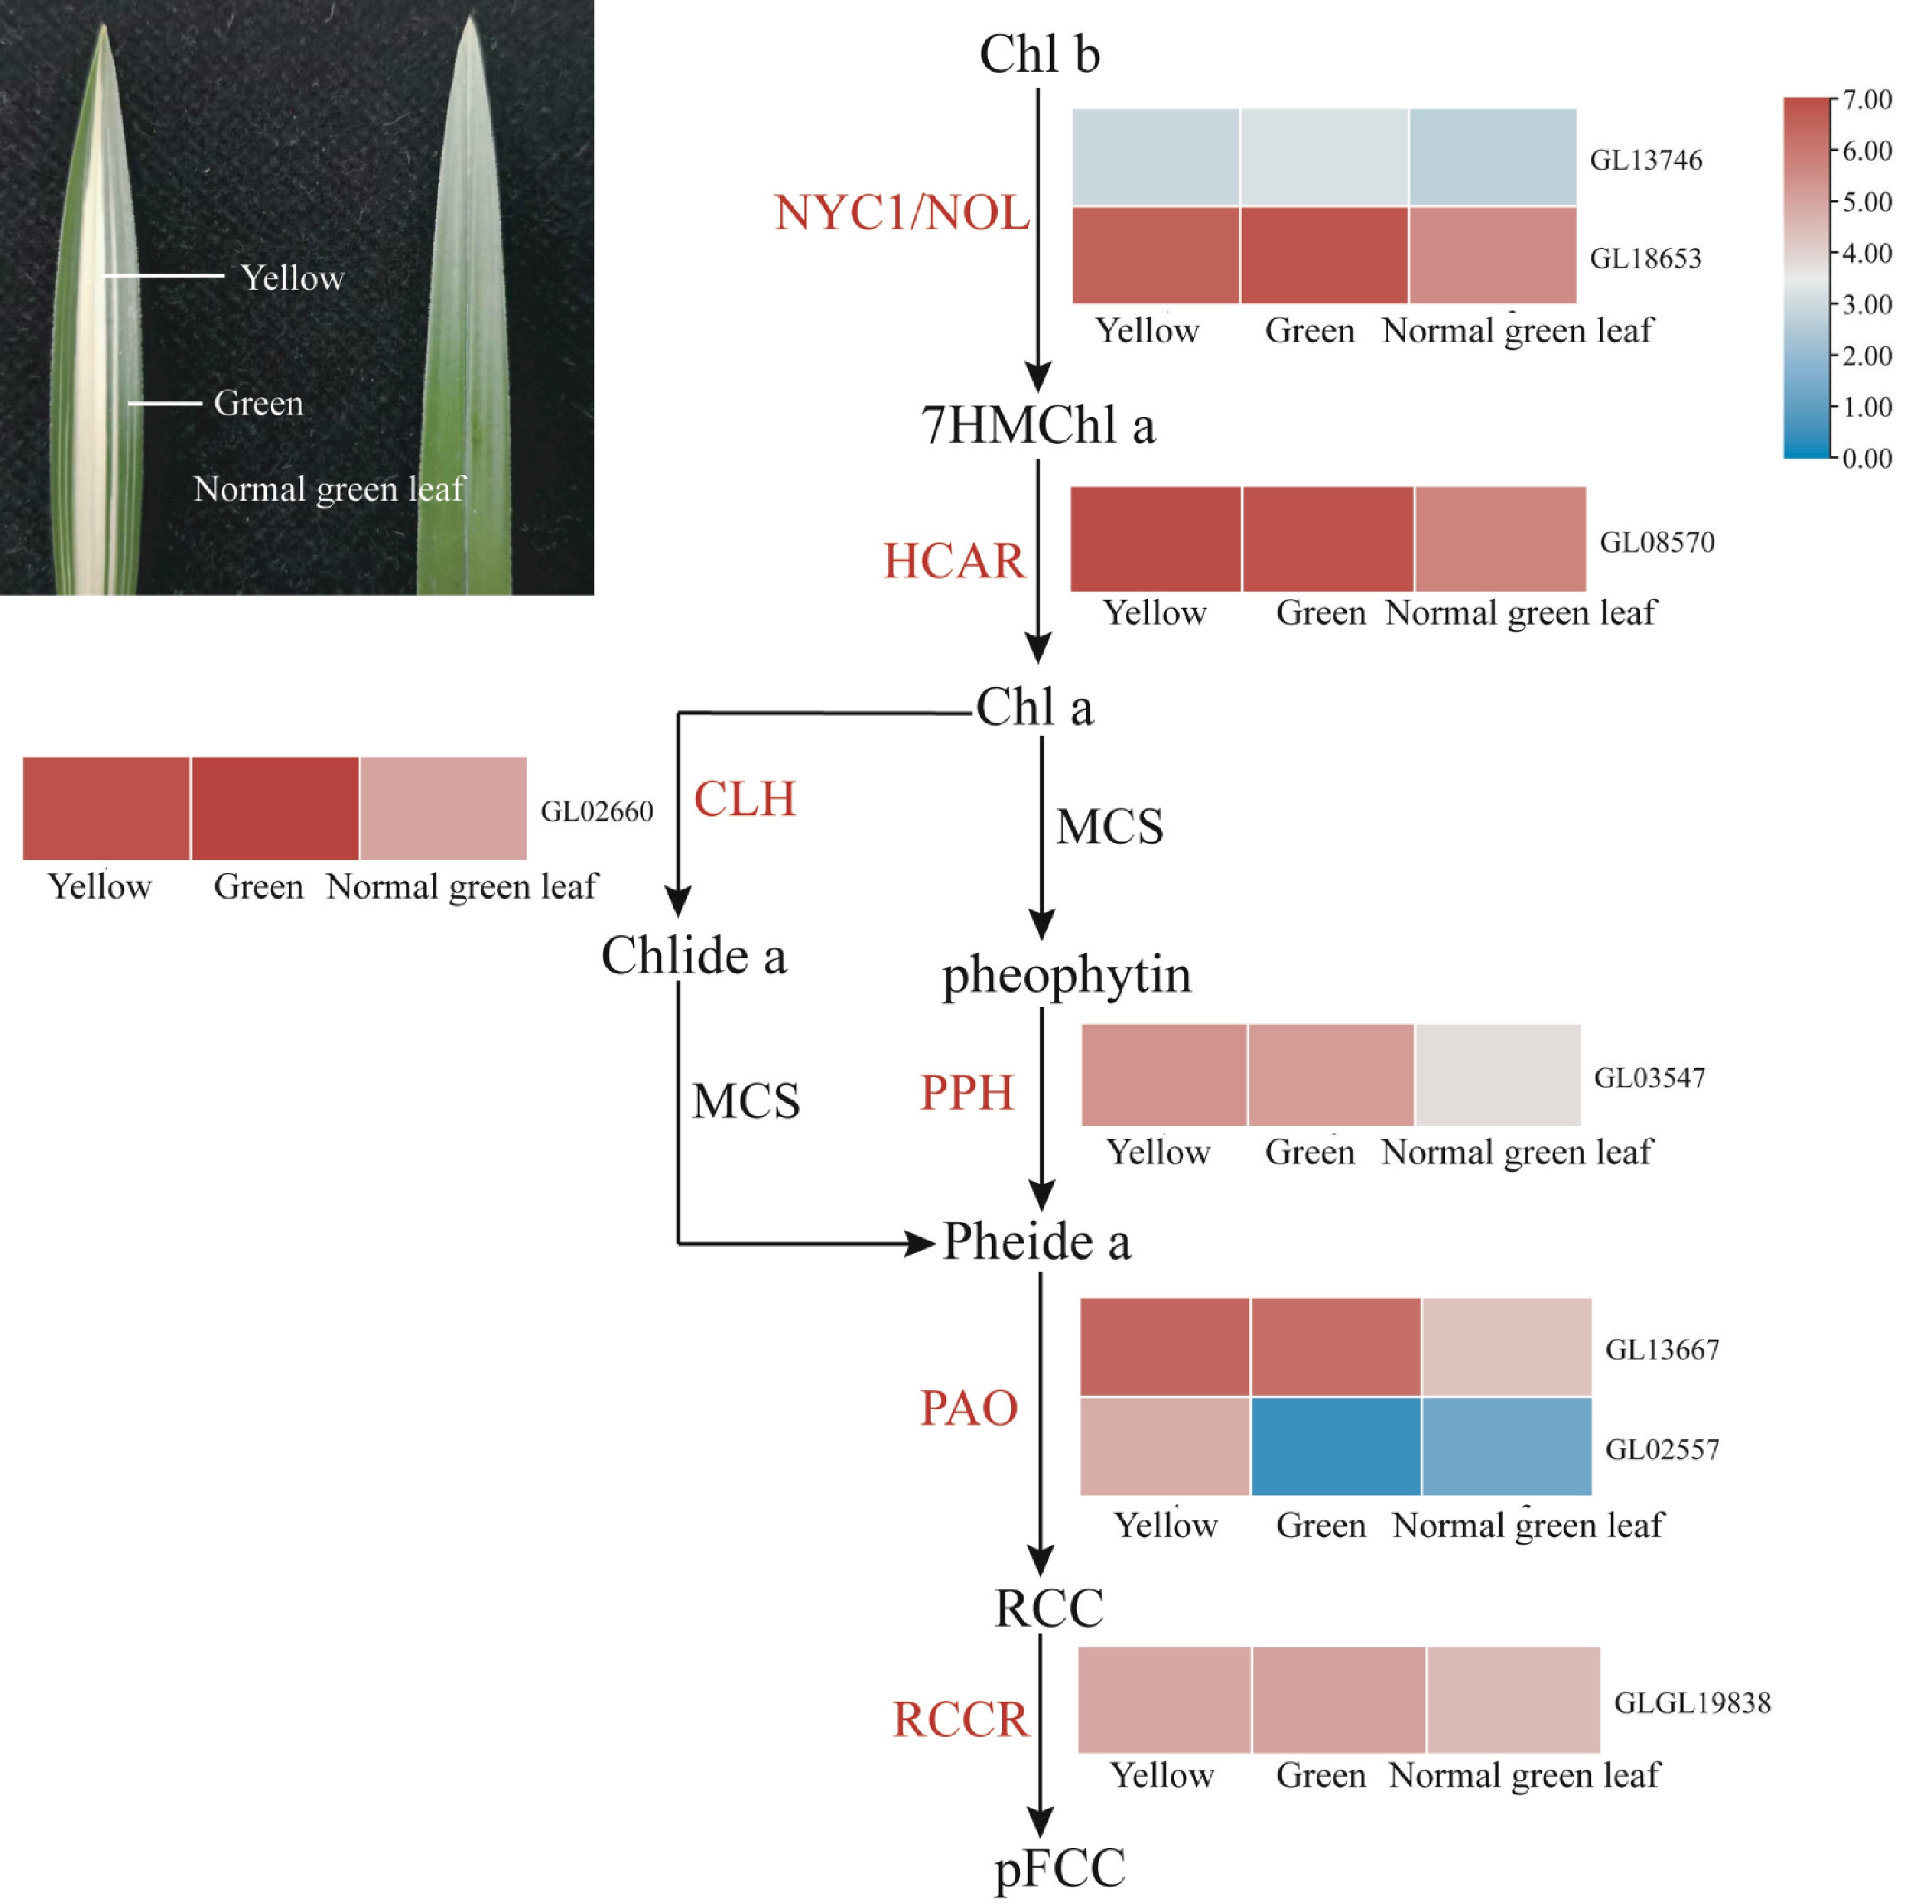
Figure 7.
Expression regulation of genes involved in chlorophyll degradation in coloured leaves of C. goeringii. Intermediates are shown in black, and the enzymes (for full names see Supplemental Table S23) involved at each step are shown in red. Normal green leaf, tissue of normal green leaf; Yellow, yellow tissue of yellow-green leaf mutant type; Green, green tissue of yellow-green leaf mutant type.
-
Category A. shenzhenica[7] P. equestris[10] D. catenatum[9] C. ensifolium[12] C. goeringii* Type II (Total) 27 29 35 38 44 MIKCc 25 28 32 34 38 A 2 3 4 4 4 AGL6 2 3 3 3 4 AGL12 1 0 0 0 0 AGL15 0 0 0 0 0 ANR1 4 2 3 1 1 AP3 2 4 4 4 4 B-PI 1 1 1 1 1 Bs 1 1 2 7 1 C/D 4 5 4 4 4 E 3 6 5 4 6 FLC 0 0 0 0 0 OsMADS32 1 0 1 1 1 SOC1 2 2 2 3 4 SVP 2 1 3 2 4 MIKC* 2 1 3 4 6 Type I (Total) 9 22 28 33 30 Mα 5 10 15 27 26 Mβ 0 0 0 0 0 Mγ 4 12 13 6 4 Total 36 51 63 71 74 * This study. Table 1.
MADS gene family of five orchid species.
Figures
(7)
Tables
(1)