-
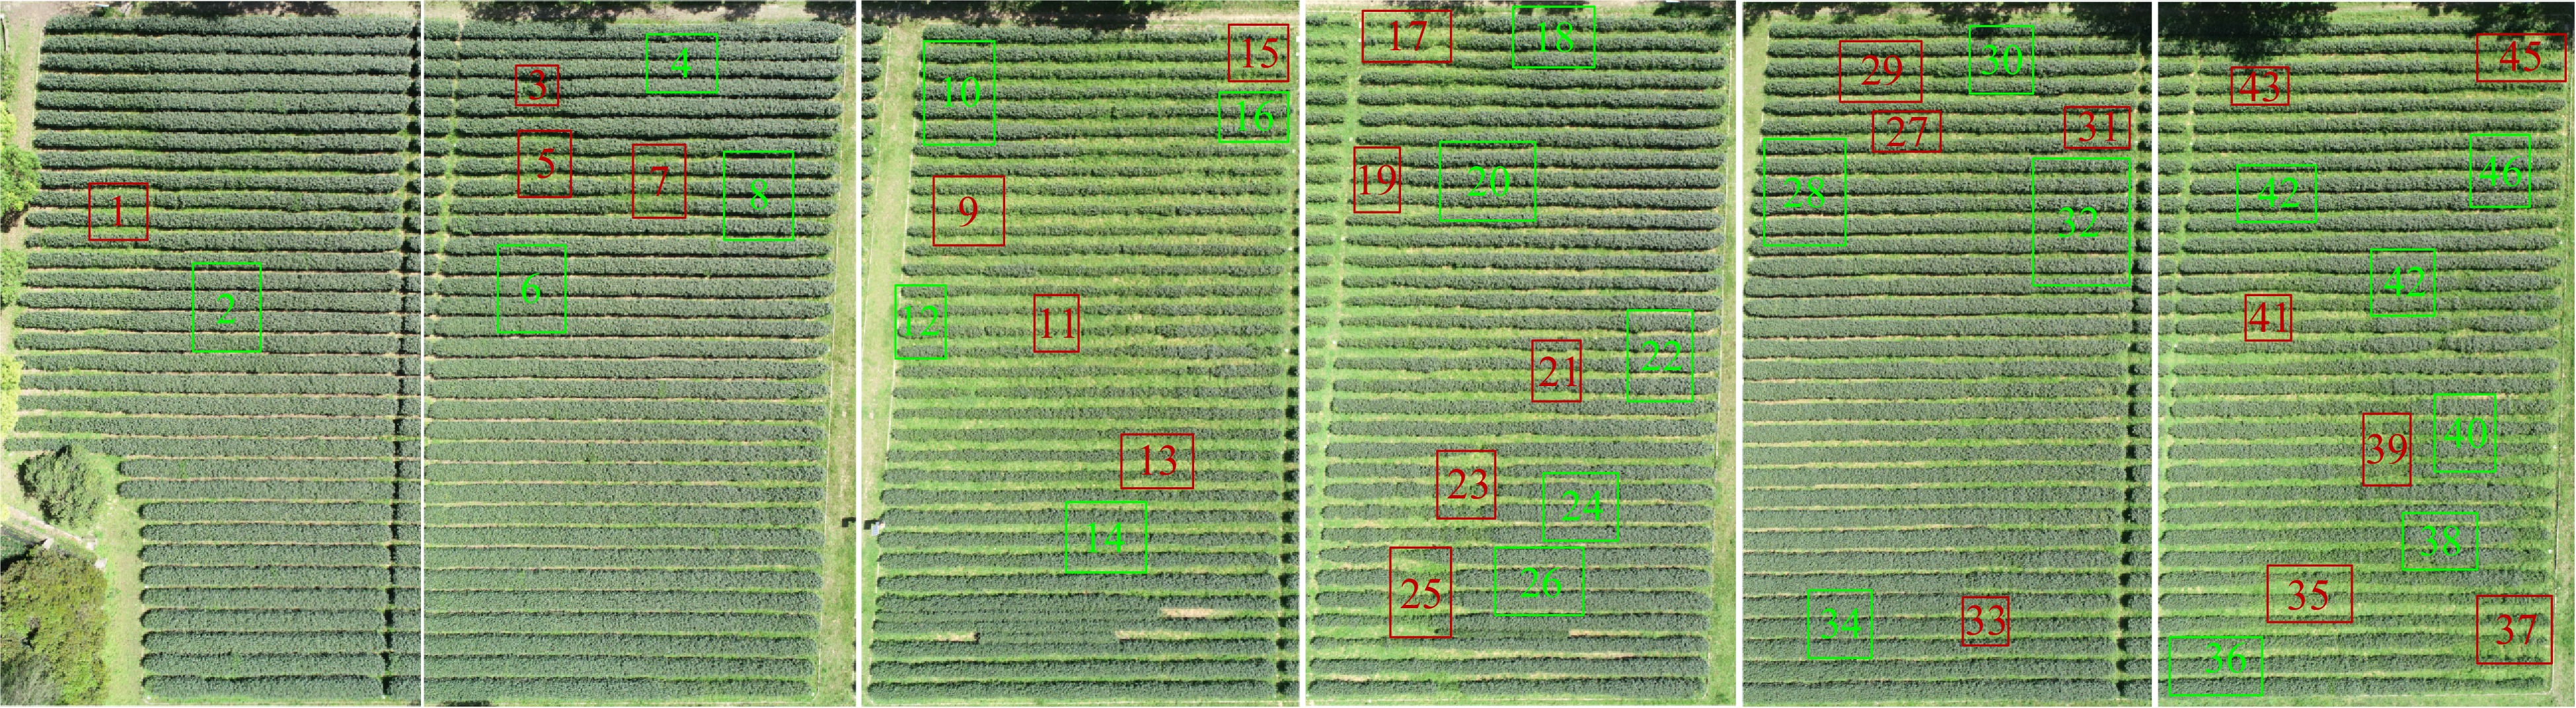
Figure 1. The study area and sampling sites of Plot 1 (red boxes) and 2 (green boxes).
-

Figure 2. The changes in and relationships of NDVI (a–e), TVI (f–j) and yield (k–o) with new and old leaf nutrient (N, P, K, Ca, Al) concentrations. Different lowercase letters ns, *, ** and *** indicate no significant difference, significant differences at the p < 0.05, 0.01 and 0.001 level, respectively.
-

Figure 3. The changes in and relationship of NDVI (a−c), TVI (d−f) and yield (g−i) with soil pH, Ca and Al concentration in the 0−20 and 20−40 cm soil depths. Different lowercase letters ** and *** indicate significant differences at the p < 0.01 and 0.001 level, respectively.
-

Figure 4. The changes in and relationships of leaf K concentration with leaf Ca (a) and Al concentration (d), and soil Ca (b, c) and Al (e, f) availability in the 0−20 and 20−40 cm soil depths. Different lowercase letters ** and *** indicate significant differences at the p < 0.01 and 0.001 level, respectively.
-
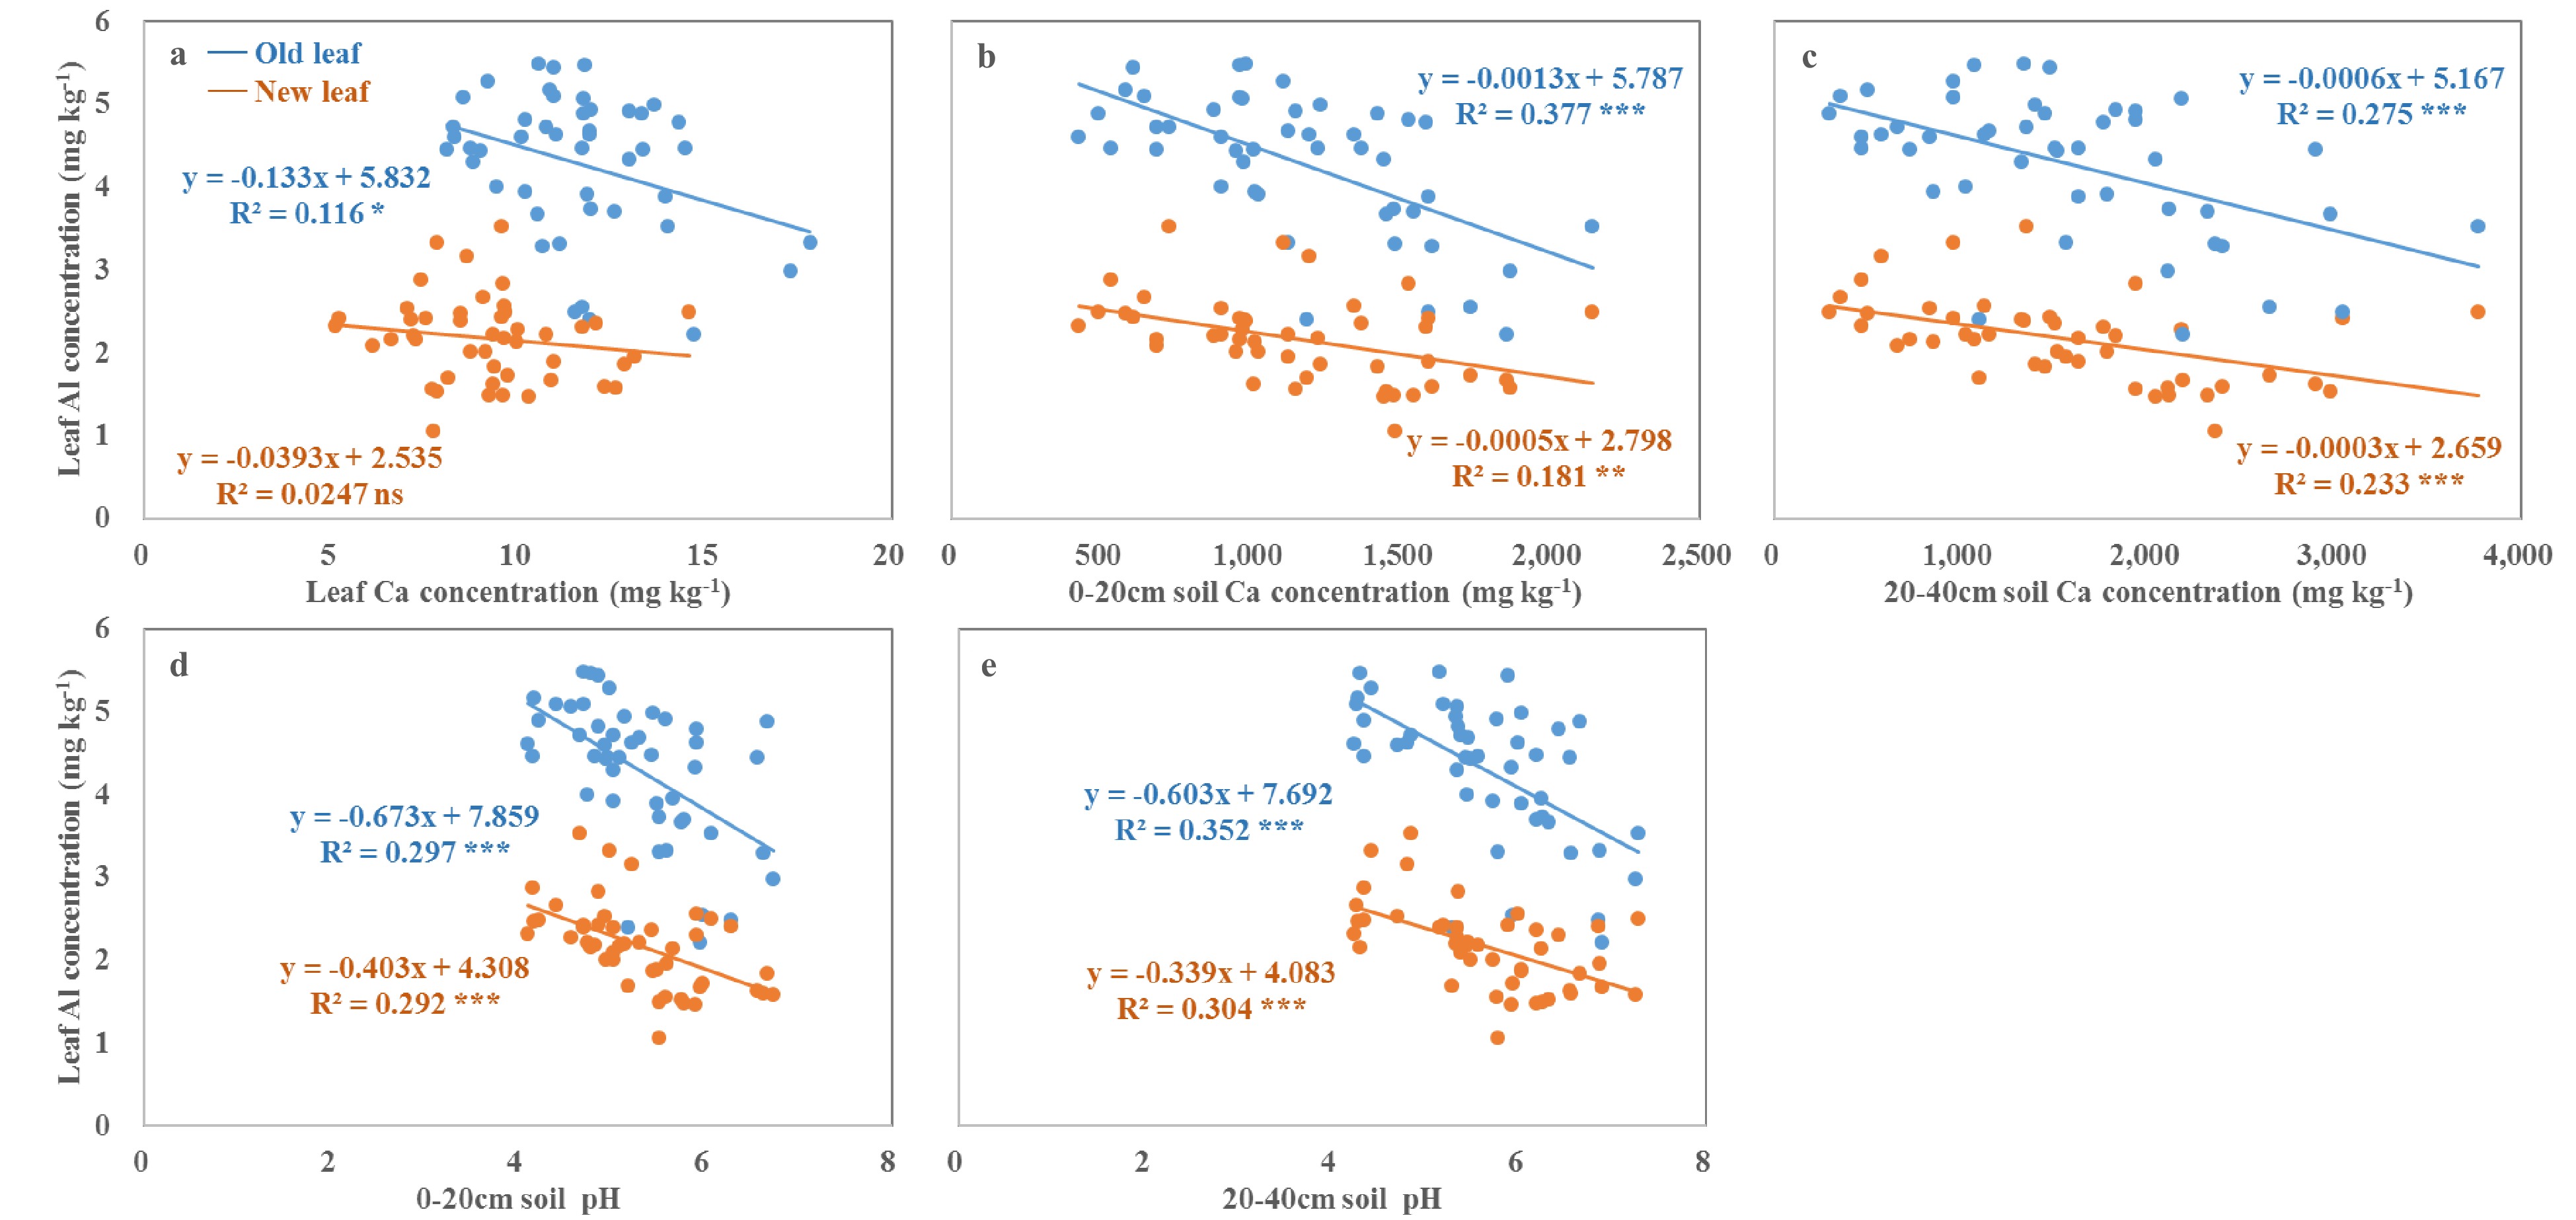
Figure 5. The changes in and relationships of leaf Al concentration with leaf Ca (a) concentration, and soil Ca availability (b, c) and pH (d, e) in the 0−20 and 20−40 cm soil depths. Different lowercase letters ns, *, ** and *** indicate no significant difference, significant differences at the p < 0.05, 0.01 and 0.001 level, respectively.
-
NDVI TVI Yield(g m−2) Number of buds per m2 Weight of buds per hundred (g) Plot 1 0.828 ± 0.02 b 23.58 ± 2.69 a 46.9 ± 4.6 b 1,712 ± 197 b 2.76 ± 0.26 b Plot 2 0.862 ± 0.01 a 18.89 ± 1.54 b 68.1 ± 6.8 a 2,118 ± 184 a 3.23 ± 0.36 a Significance among treatments was tested using one-way ANOVA at p < 0.05. Different letters in a single row indicate a significant difference between treatments. NDVI, Normalized Difference Vegetation Index; TVI, Transformed Vegetation Index. Table 1. The NDVI, TVI, yield, number of buds per m2 and weight of buds per hundred of Plots 1 and 2 (mean ± standard error).
-
N (g kg−1) P (g kg−1) K (g kg−1) Ca (g kg−1) Al (g kg−1) Bud with two leaves Plot 1 38.0 ± 3.4 a 5.8 ± 0.6 a 17.2 ± 1.8 a 2.14 ± 0.35 a 0.17 ± 0.05 a Plot 2 40.7 ± 3.6 a 5.4 ± 0.3 a 18.0 ± 0.6 a 2.08 ± 0.31 a 0.16 ± 0.04 a New leaves Plot 1 20.0 ± 1.1 b 2.0 ± 0.2 a 8.5 ± 1.1 b 10.26 ± 1.97 a 1.84 ± 0.39 b Plot 2 22.5 ± 1.4 a 1.9 ± 0.1 a 10.3 ± 0.8 a 8.02 ± 1.53 b 2.50 ± 0.40 a Old leaves Plot 1 16.9 ± 1.3 b 2.0 ± 0.3 a 7.0 ± 0.8 b 12.98 ± 1.94 a 3.76 ± 0.85 b Plot 2 19.6 ± 1.5 a 2.3 ± 0.5 a 9.3 ± 1.2 a 10.19 ± 1.38 b 4.82 ± 0.40 a Significance among treatments was tested using one-way ANOVA at p < 0.05. Different letters in a single row indicate a significant difference between treatments. Table 2. The N, P, K, Ca and Al concentration of bud, new and old leaves of Plots 1 and 2 (mean ± standard error).
-
pH SOC
(%)${{\text{NO}}_3^- \text {-N}}$
(mg kg−1)${{\text{NH}}_4^+ \text {-N}}$
(mg kg−1)AP
(mg kg−1)AK
(mg kg−1)Ca
(mg kg−1)Al
(mg kg−1)0−20 cm Plot 1 6.30 ± 0.50 a 1.82 ± 0.35 a 16.0 ± 11.6 a 2.53 ± 1.96 a 106 ± 41 a 198 ± 45 a 1444 ± 293 a 831 ± 53 b Plot 2 4.99 ± 0.52 b 1.96 ± 0.28 a 15.2 ± 7.3 a 3.43 ± 2.18 a 103 ± 70 a 202 ± 37 a 869 ± 270 b 911 ± 67 a 20−40 cm Plot 1 5.84 ± 0.47 a 1.17 ± 0.34 a 11.7 ± 6.0 a 1.44 ± 0.77 a 215 ± 174 a 168 ± 40 a 2039 ± 709 a 766 ± 52 b Plot 2 4.75 ± 0.35 b 1.33 ± 0.21 a 11.8 ± 6.1 a 1.98 ± 1.31 a 135 ± 111 a 163 ± 48 a 1070 ± 532 b 862 ± 97 a Significance among treatments was tested using one-way ANOVA at p < 0.05. Different letters in a single row indicate a significant difference between treatments. SOC, soil organic carbon; ${{\text{NO}}_3^- \text {-N}}$ , nitrate;${{\text{NH}}_4^+ \text {-N}}$ , ammonium; AP, available Phosphorus; AK, available potassium.Table 3. Soil chemical properties of Plots 1 and 2 in the 0−20 and 20−40 cm soil depth (mean ± standard error).
Figures
(5)
Tables
(3)