-
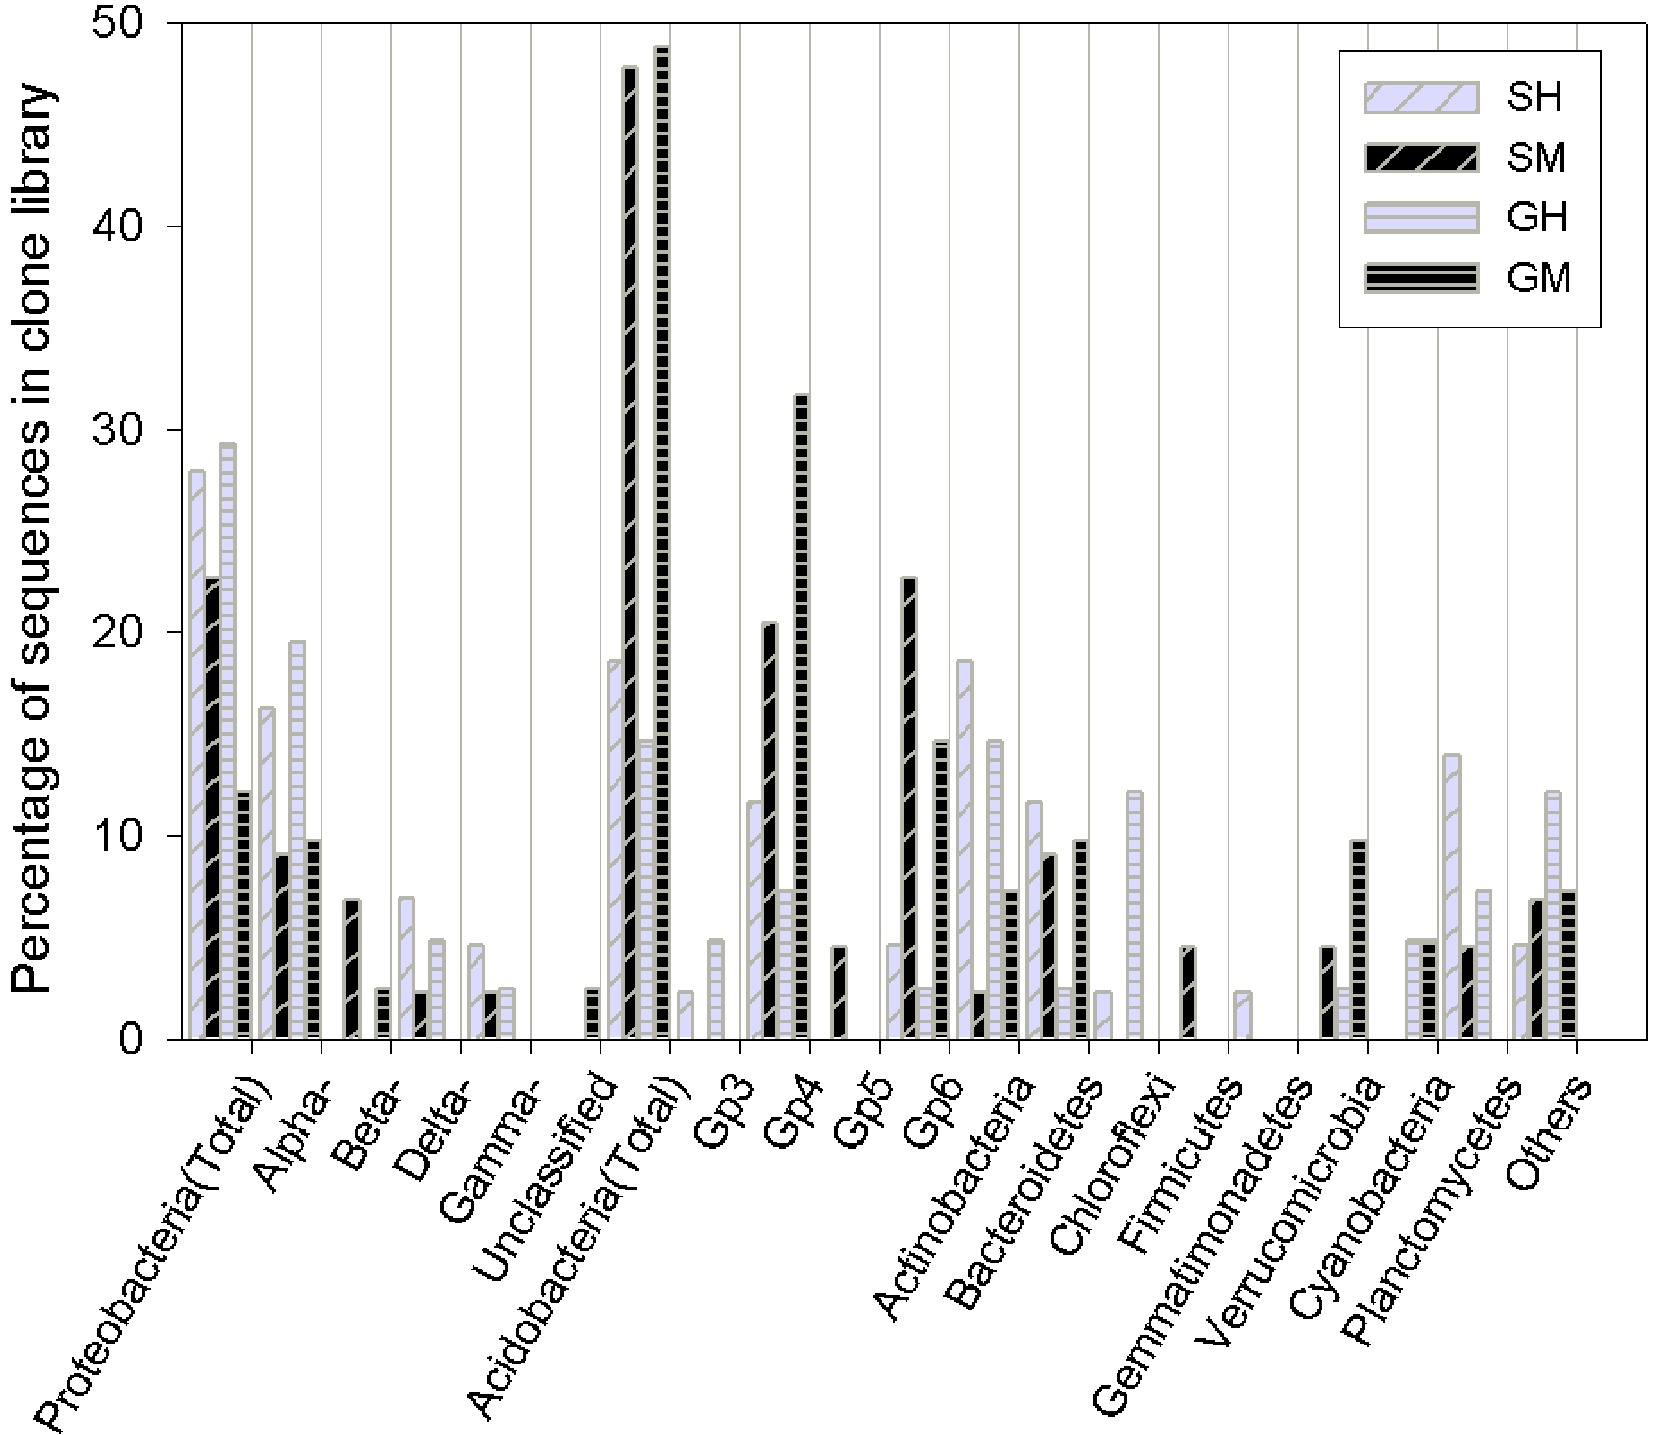
Figure 1. Bar charts of the bacterial clone library composition at the phylum level (as well as the subdivision level for Proteobacteria and Acidobacteria) for the vegetated soil in Yuanjiang Hot Valley. SH: Shrub humus samples, SM: Shrub mineral samples, GH: Grass humus samples, GM: Grass mineral samples. The 'others' category includes: fusobacteria and the candidate phyla, OP10 and TM7.
-
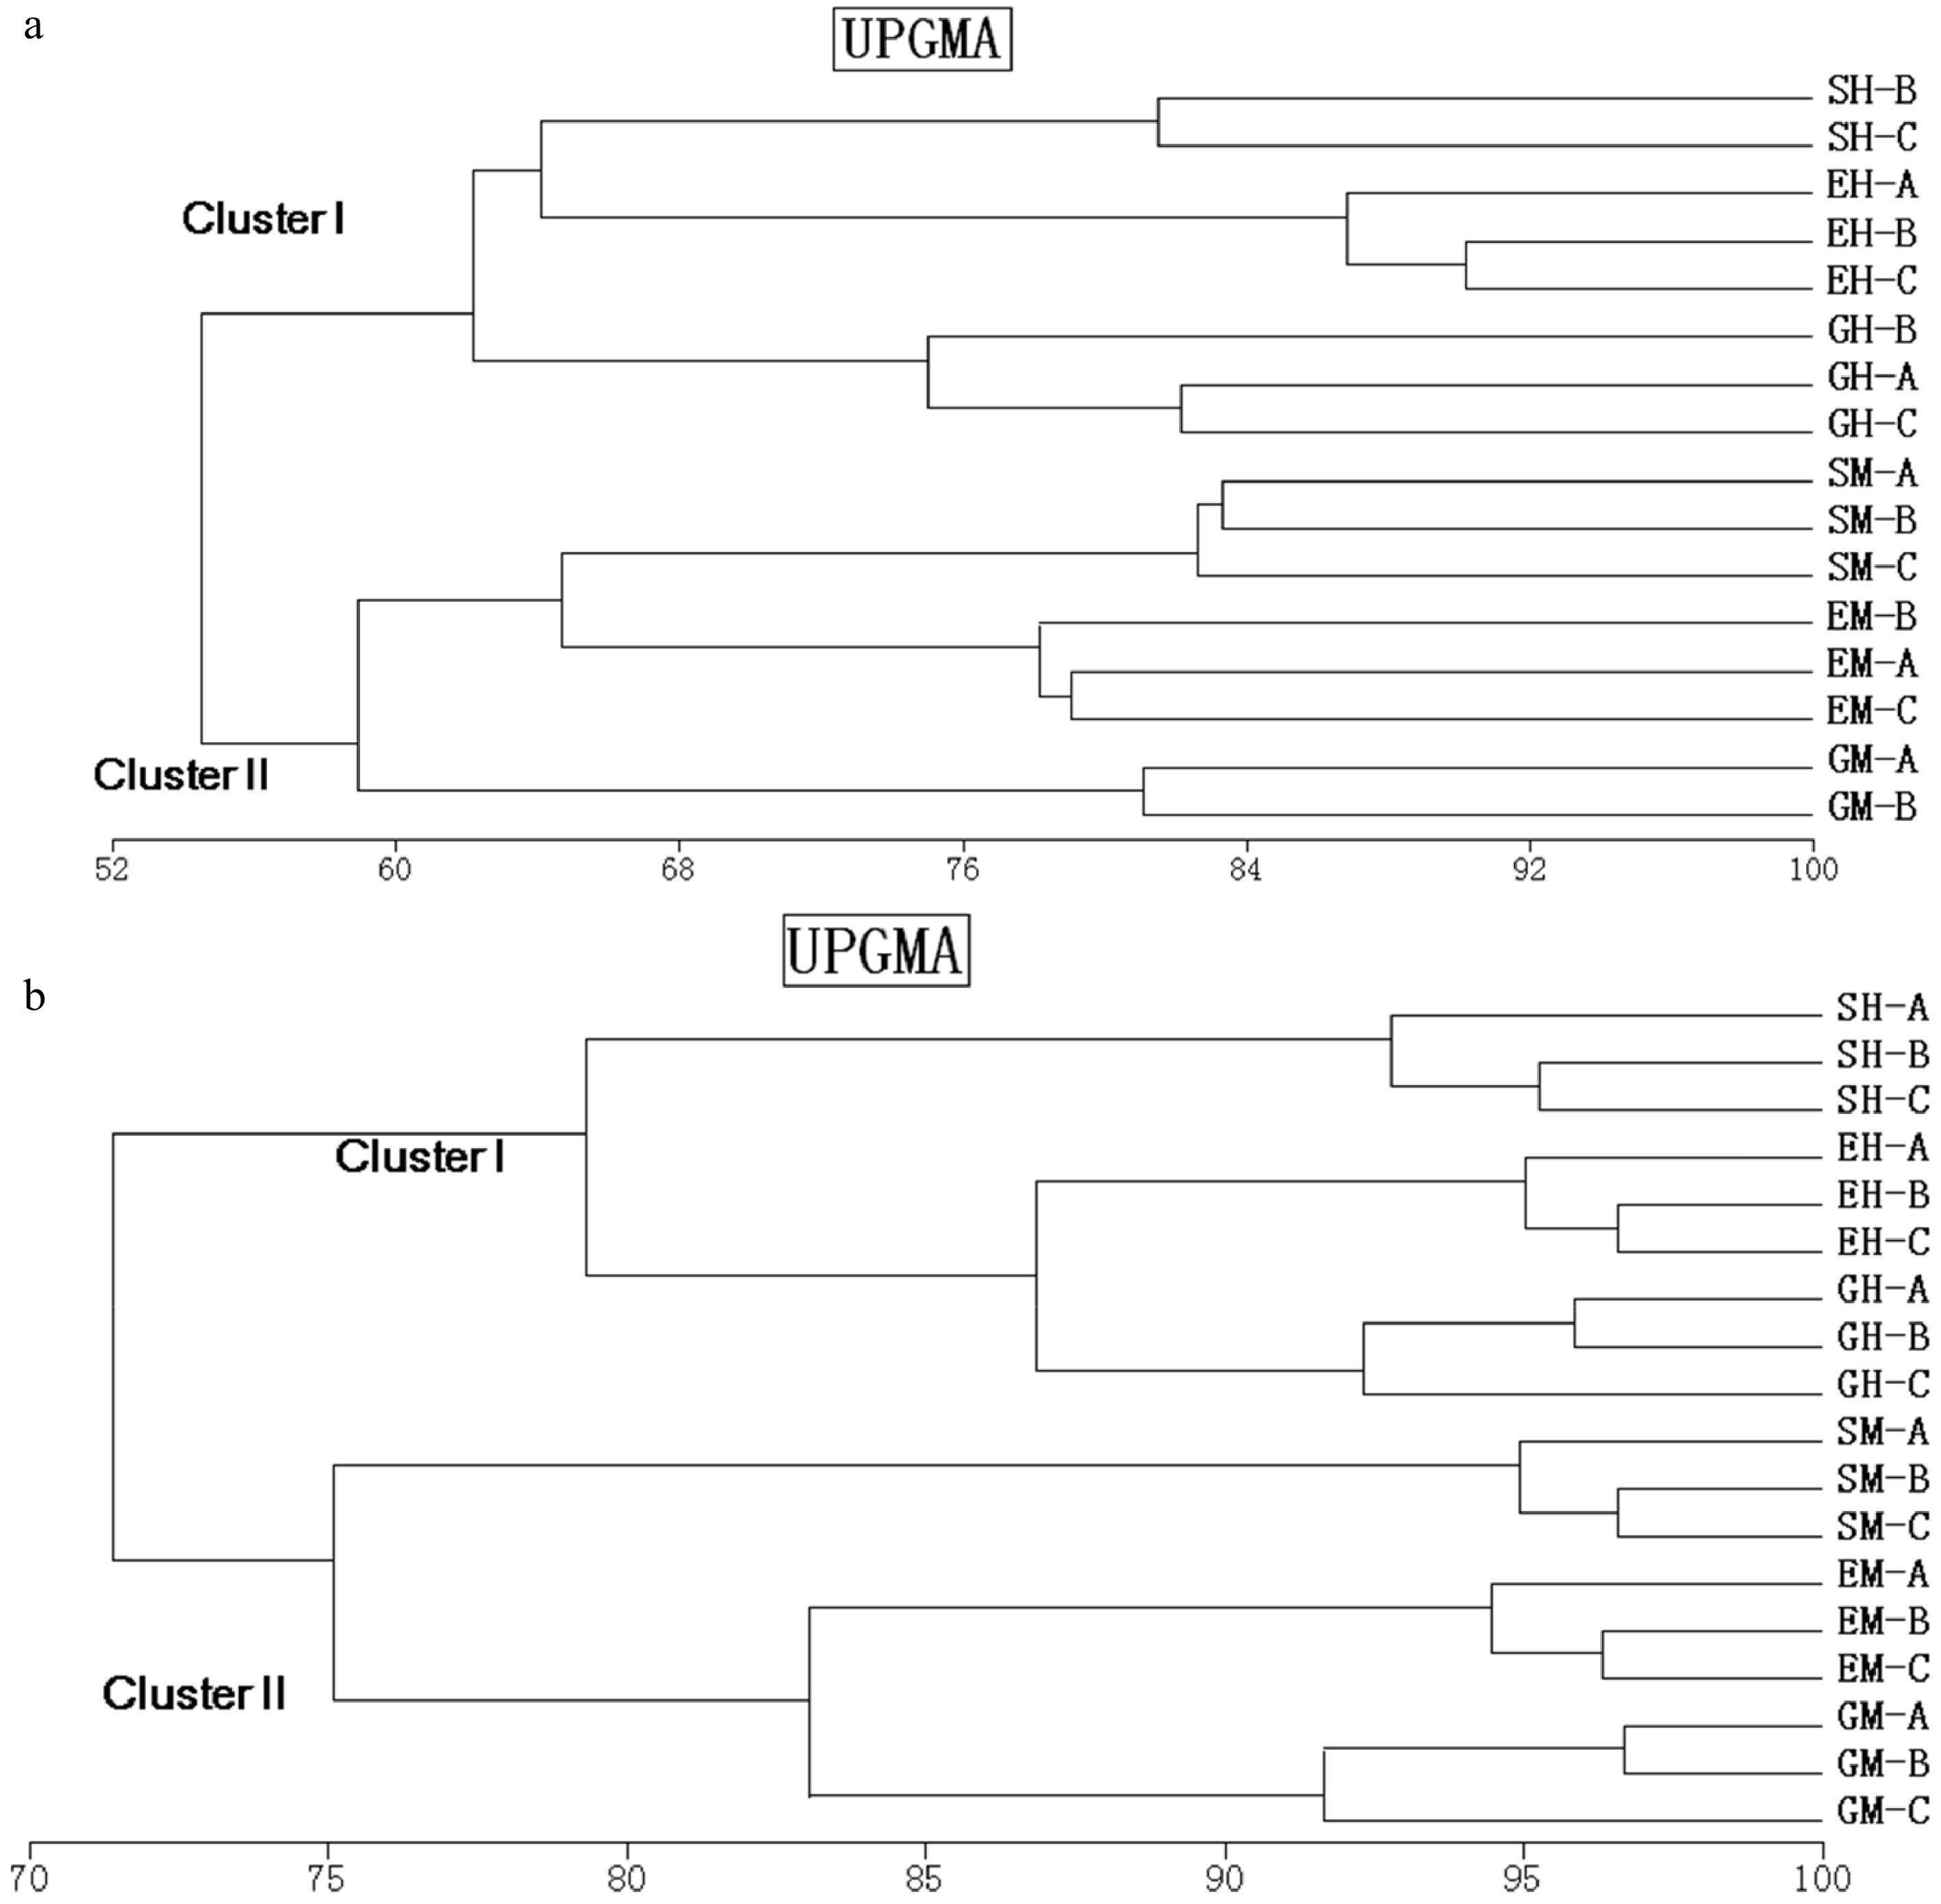
Figure 2. Dendrogram obtained after the cluster analysis with UPGMA, and the similarity coefficient of Pearson, comparing one set of replicates of bacterial 16S rRNA (a) and 18S rRNA (b) gene fragments amplified from shrubland, grassland, and ecotone DNA templates obtained from different soil horizons. SM: Shrub mineral samples, GH: Grass humus samples, GM: Grass mineral samples, EH: Ecotone humus samples; EM: Ecotone mineral samples.
-
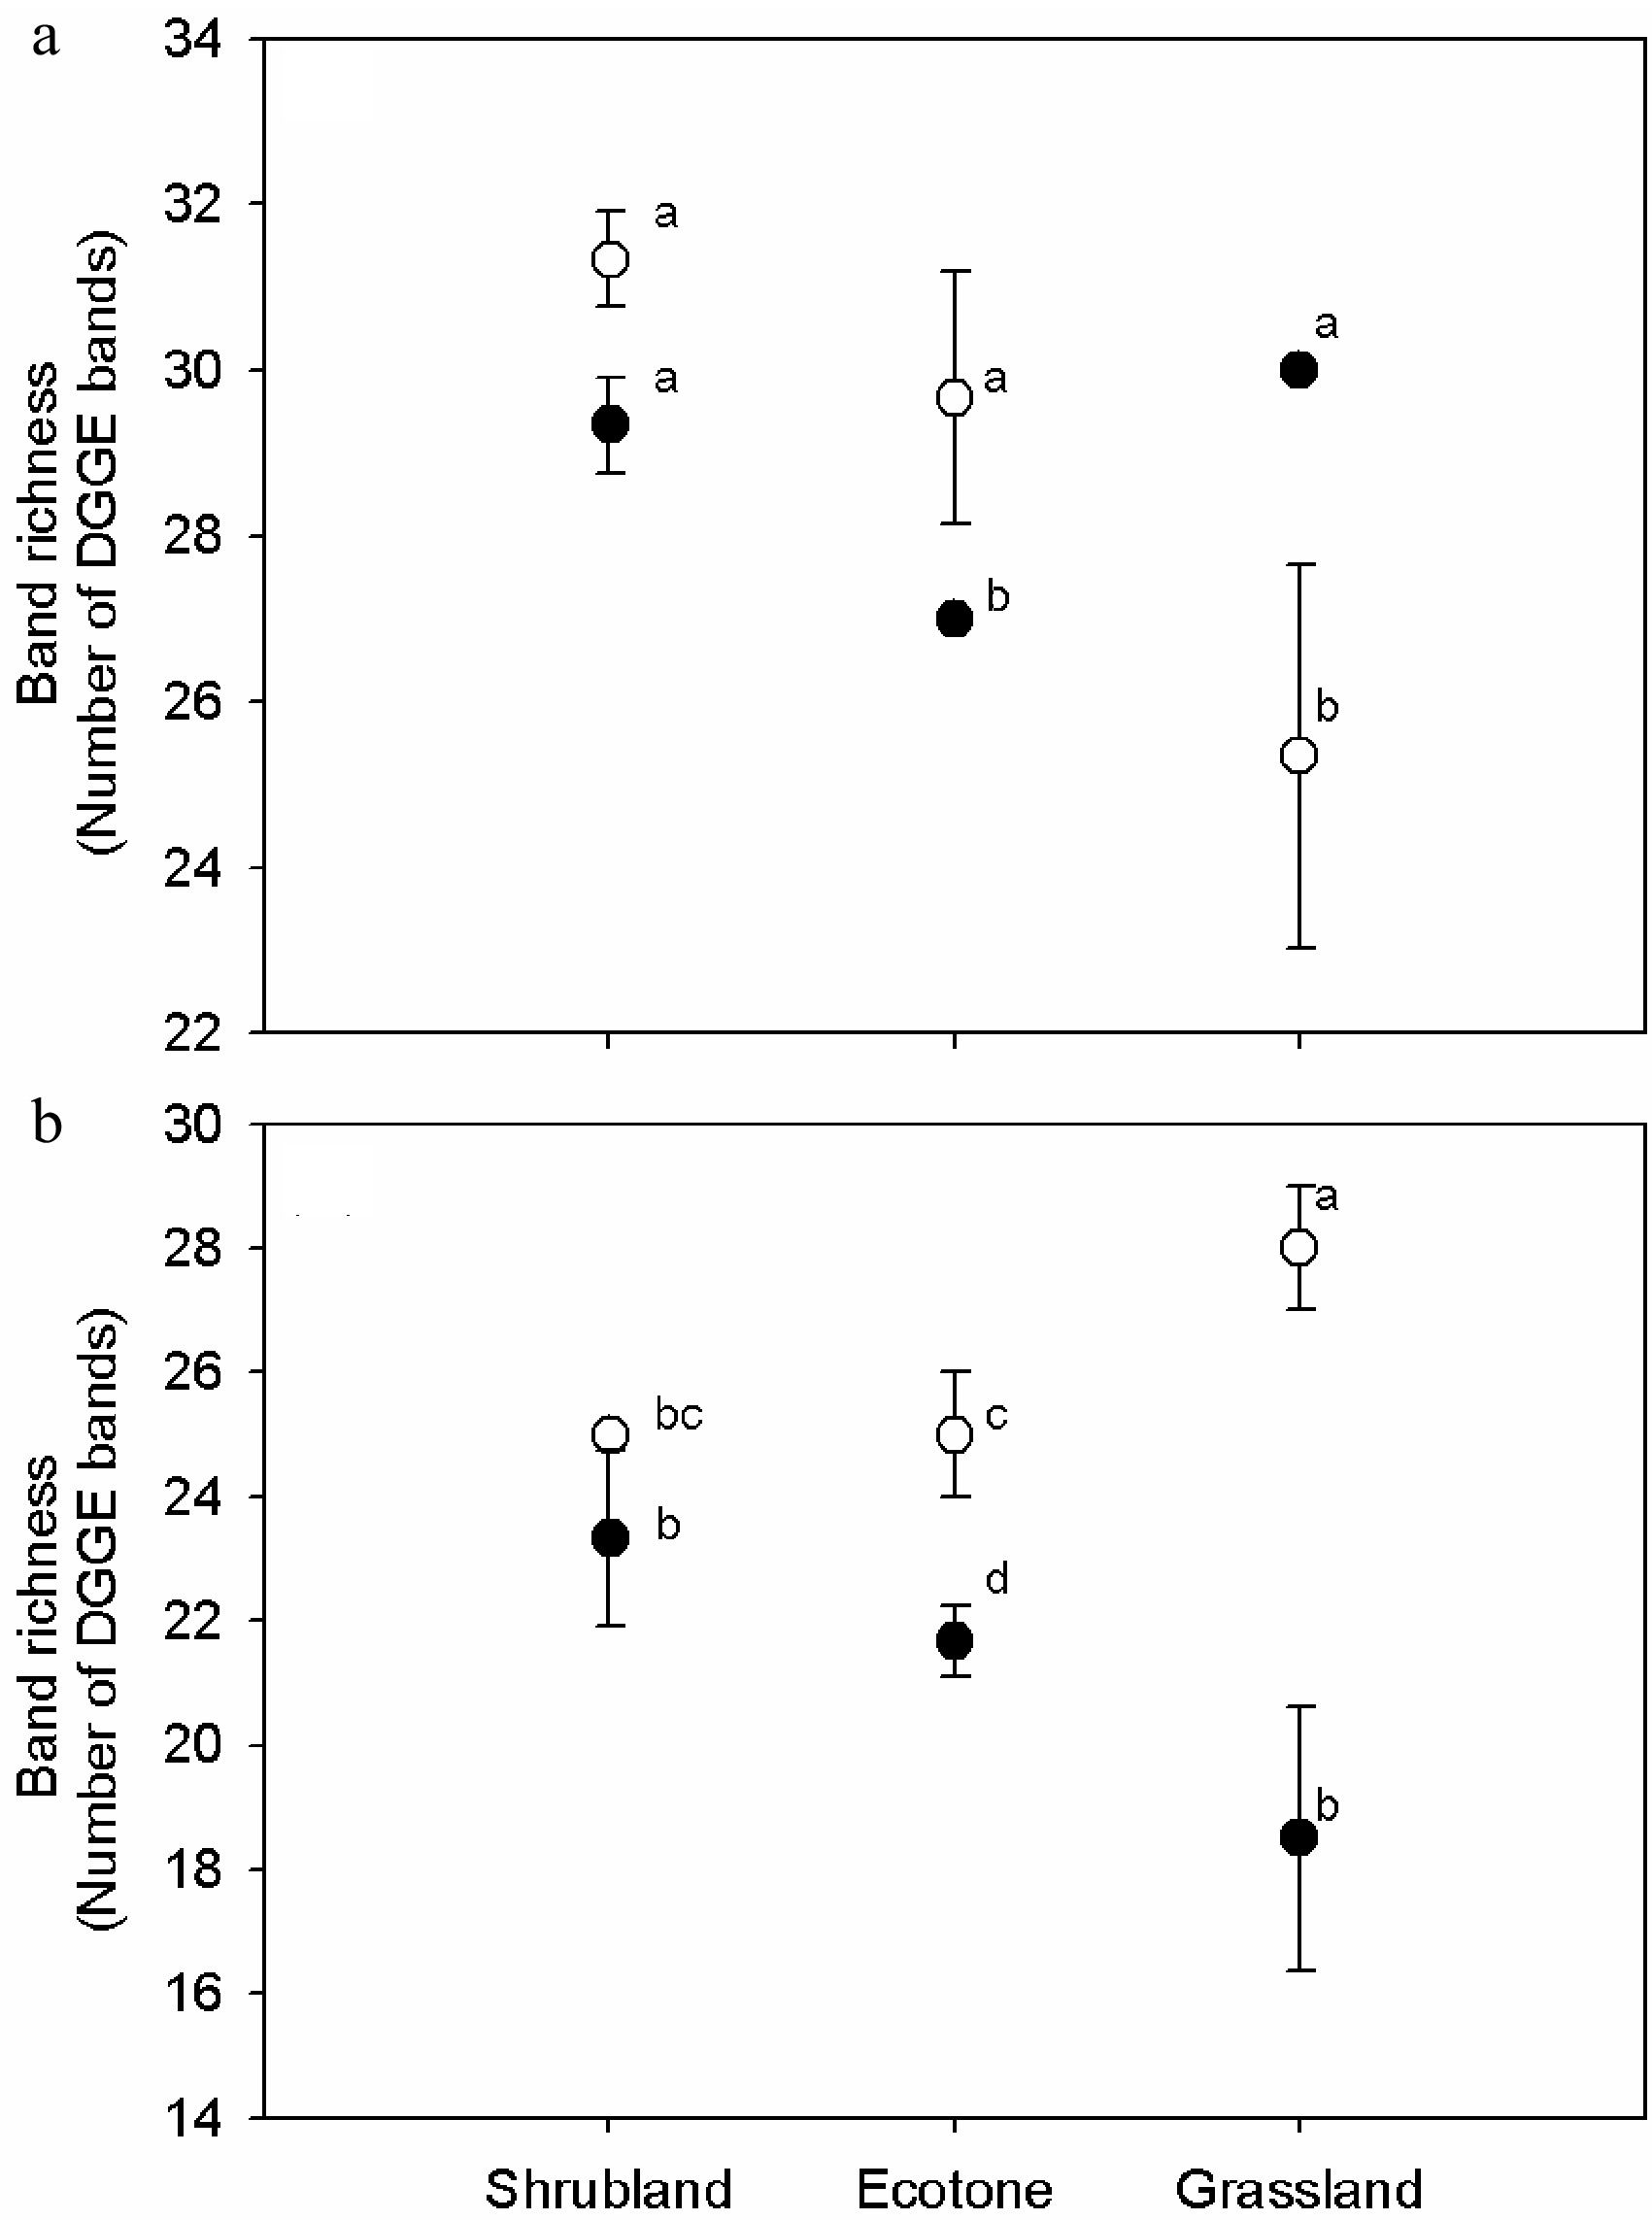
Figure 3. Variations of (a) 16S and (b) 18S rRNA gene DGGE band richness in the humus soil and mineral horizon of the shrub mix and grass. One-way ANOVA was used for statistical testing between samples. Values with the same letter are not significantly different (p > 0.01). Open and closed circles stand for humus and mineral soil samples, respectively.
-
Shrub Grass SH SM GH GM Bacteria Sb 37.00 35.00 39.00 29.00 Nc 43.00 45.00 41.00 41.00 Evennessd 2.28 2.25 2.29 2.23 Shannon indexe 3.57 3.47 3.65 3.26 Chao1 103.43 78.88 261.00 52.75 Chao1 (95%H)f 210.42 152.27 678.14 99.61 Chao1 (95%L)g 62.45 51.42 116.11 36.99 Fungi Sb 17.00 19.00 15.00 19.00 Nc 33.00 30.00 33.00 33.00 Evennessd 2.10 2.17 1.90 2.18 Shannon indexe 2.59 2.77 2.23 2.79 Chao1 28.25 38.50 42.50 30.00 Chao1 (95%H)f 64.72 91.91 128.50 63.10 Chao1 (95%L)g 19.65 24.22 21.66 21.74 a Calculations were based on OTUs formed at an evolutionary distance of r = 0.03.
b S defined as the number of OTUs.
c N defined as the number of sequences.
d Evenness defined as the Shannon index or H/log S.
e Index of Shannon, Chao 1 were accounted in DOTUR.
f 95% H: 95% higher confidence interval for Chao1.
g 95% L: 95% lower confidence interval for Chao1.
SM: Shrub mineral samples, GH: Grass humus samples, GM: Grass mineral samples.Table 1. Diversity indices for the bacterial and fungal communities as represented in the 16S and 18S rRNA gene librariesa.
-
Soil Sample Shrub Humus (SH) Shrub mineral (SM) Grass Humus (GH) Grass Mineral (GM) Vegetation (S/G) Soil horizon (H/M) (A) Shrub humus (SH) Shrub mineral (SM) 0.96 Grass humus (GH) 1.00 0.06 Grass mineral (GM) 0.06 0.18 0.06 Vegetation (S/G) <0.01 Soil horizon (H/M) <0.01 (B) Shrub humus (SH) Shrub mineral (SM) 0.06 Grass humus (GH) 0.72 0.06 Grass mineral (GM) 1.00 0.24 0.06 Vegetation (S/G) <0.01 Soil horizon (H/M) <0.01 SM: Shrub mineral samples, GH: Grass humus samples, GM: Grass mineral samples H: Pooled humus samples, M: Pooled mineral samples, S: Pooled shrub samples, G: Pooled grass samples. Table 2. P values of sequence library comparisons for 16S (A) and 18S (B) rRNA gene P values are for contrasts between each pair of clone libraries using UniFrac.
-
Bacteria Fungi λ F P λ F P Vegetation 0.168 3.242 0.016 0.217 3.872 0.002 Soil horizon 0.318 7.640 0.002 0.160 2.647 0.004 Vegetation vs. soil horizon 0.228 7.418 0.002 0.128 2.060 0.034 Table 3. P values of sample comparisons for bacteria and fungi genes using the DGGE analysis.
Figures
(3)
Tables
(3)