-
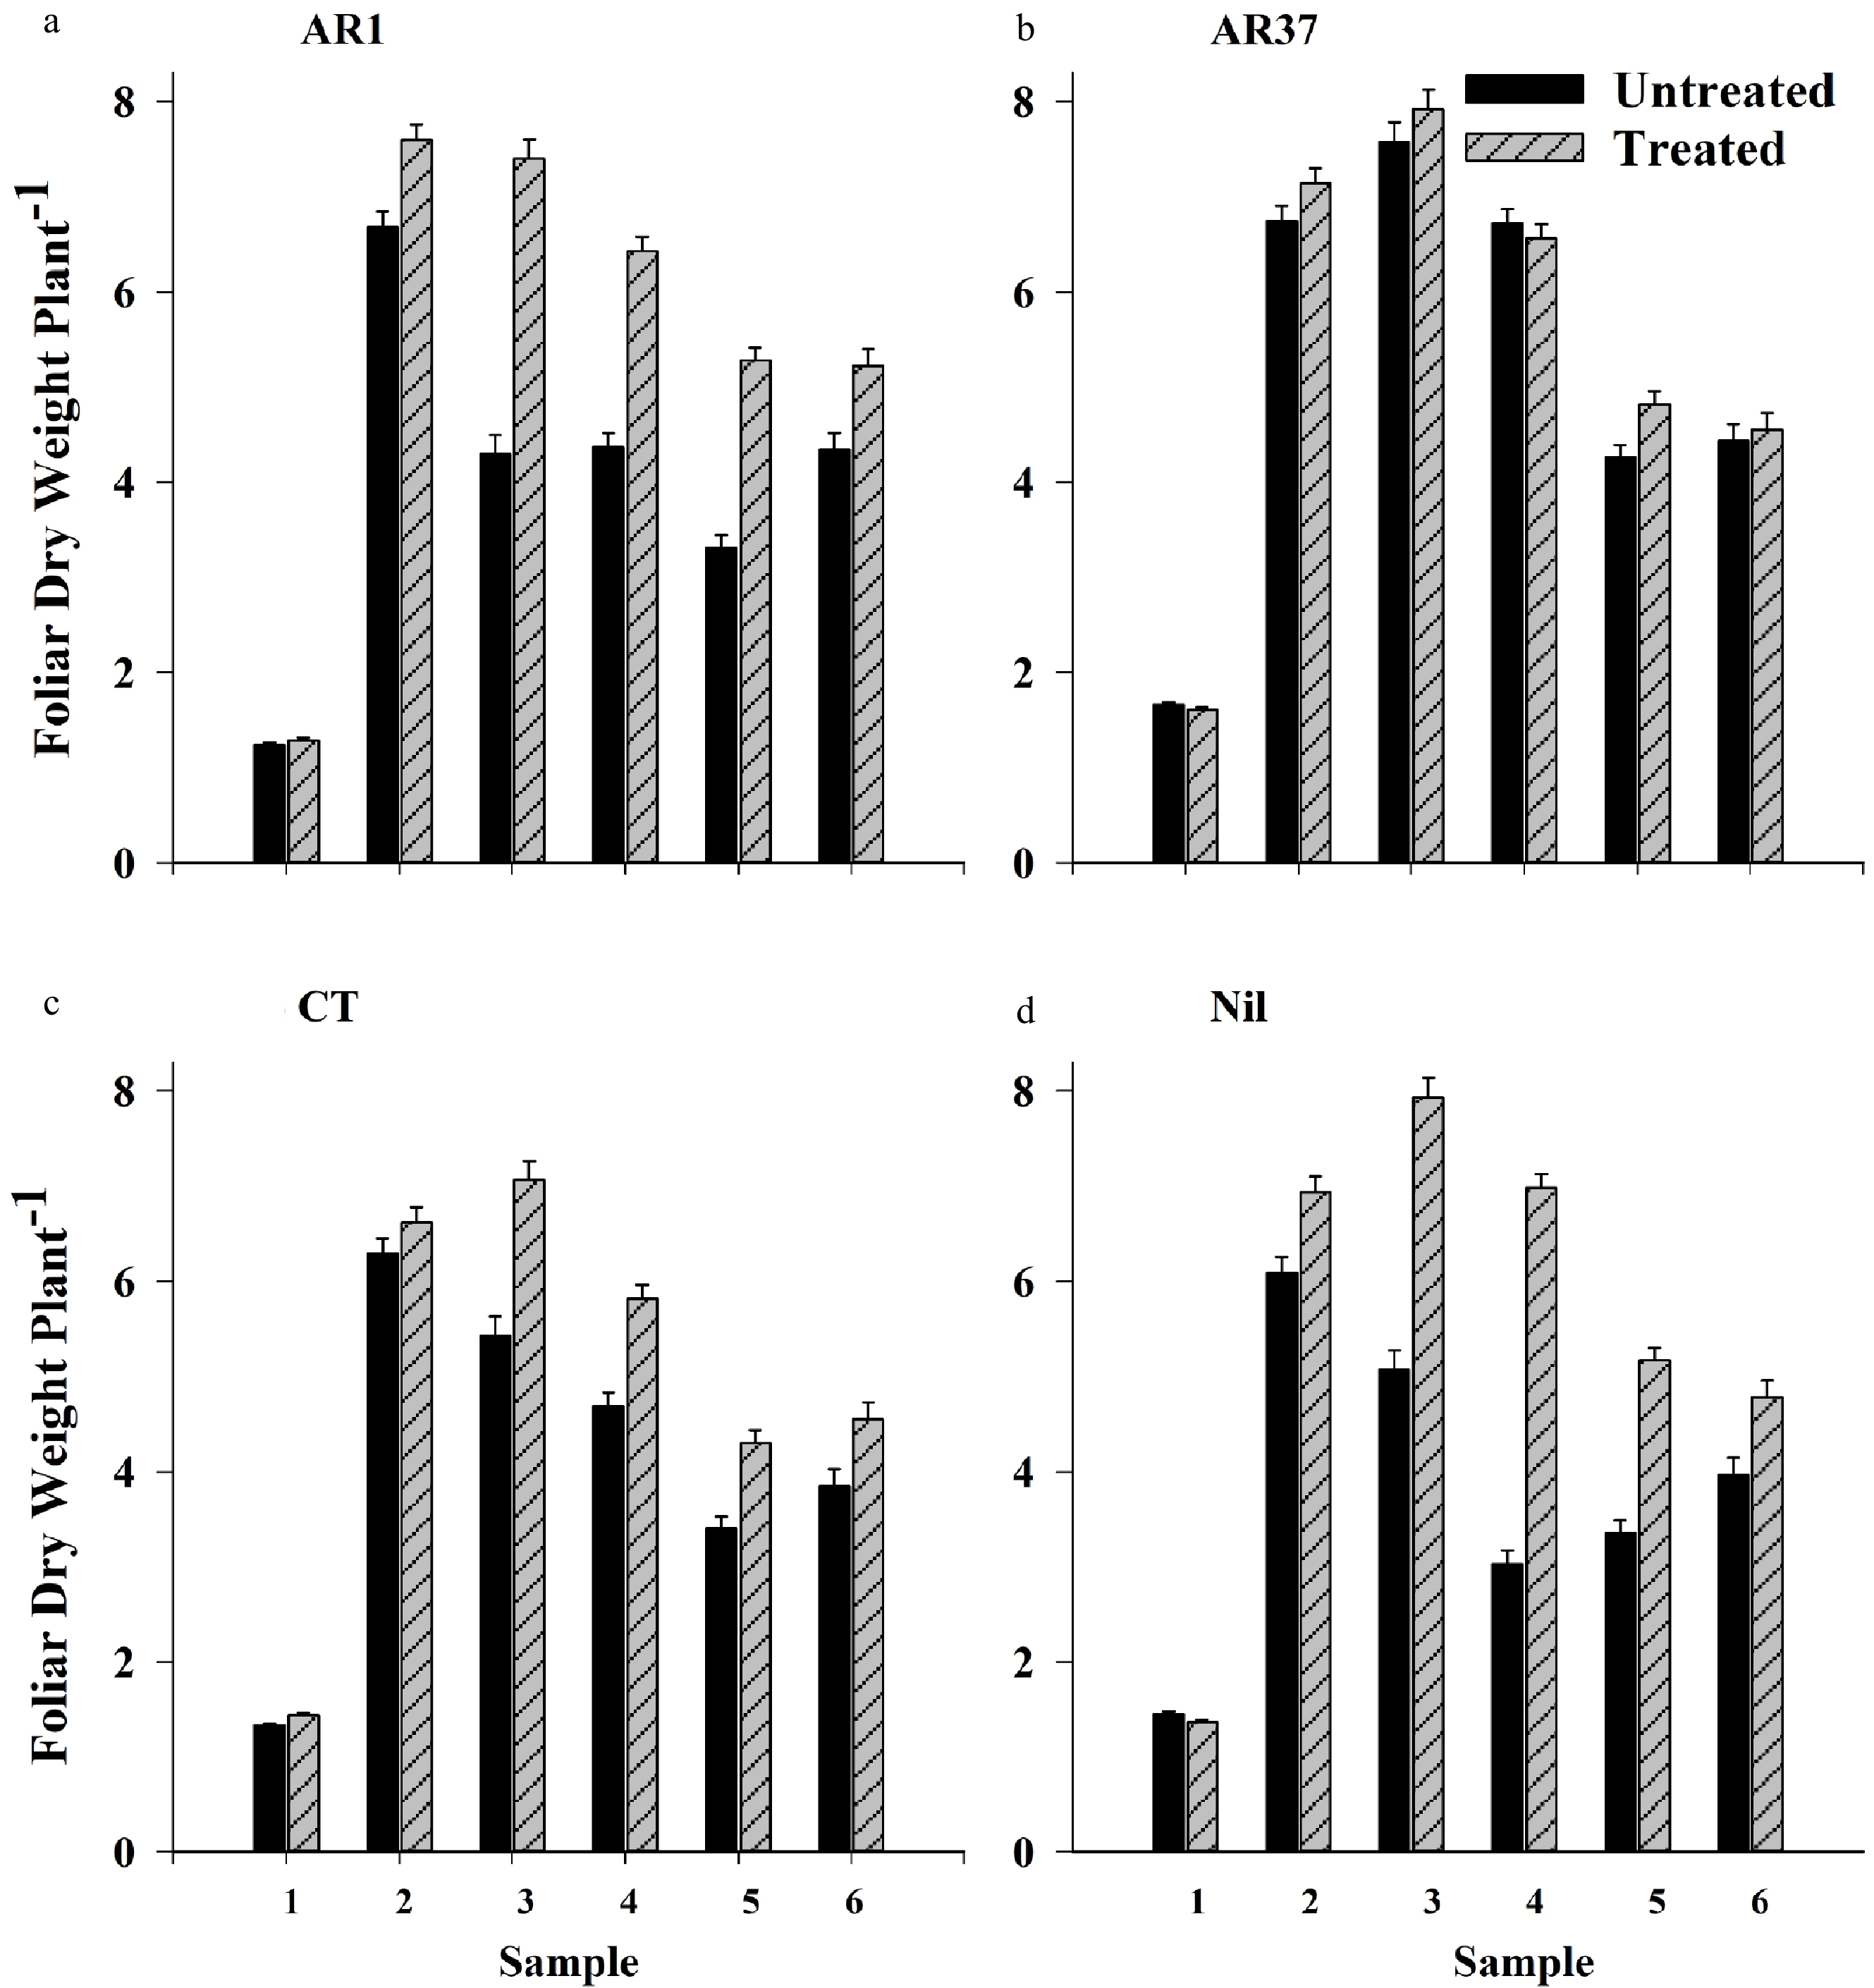
Figure 1. Foliar growth (g plant−1 +SE) of ryegrass infected with endophytes (a) AR1, (b) AR37, (c) CT, or endophyte-free (d) Nil and treated or not treated with insecticide, for six Samples taken over 18 months; 1 – late winter Year 1; 2 – Summer Year 1; 3 – Autumn Year 2; 4 – Spring Year 2; 5 – Summer Year 3; 6 – Autumn Year 3.
-
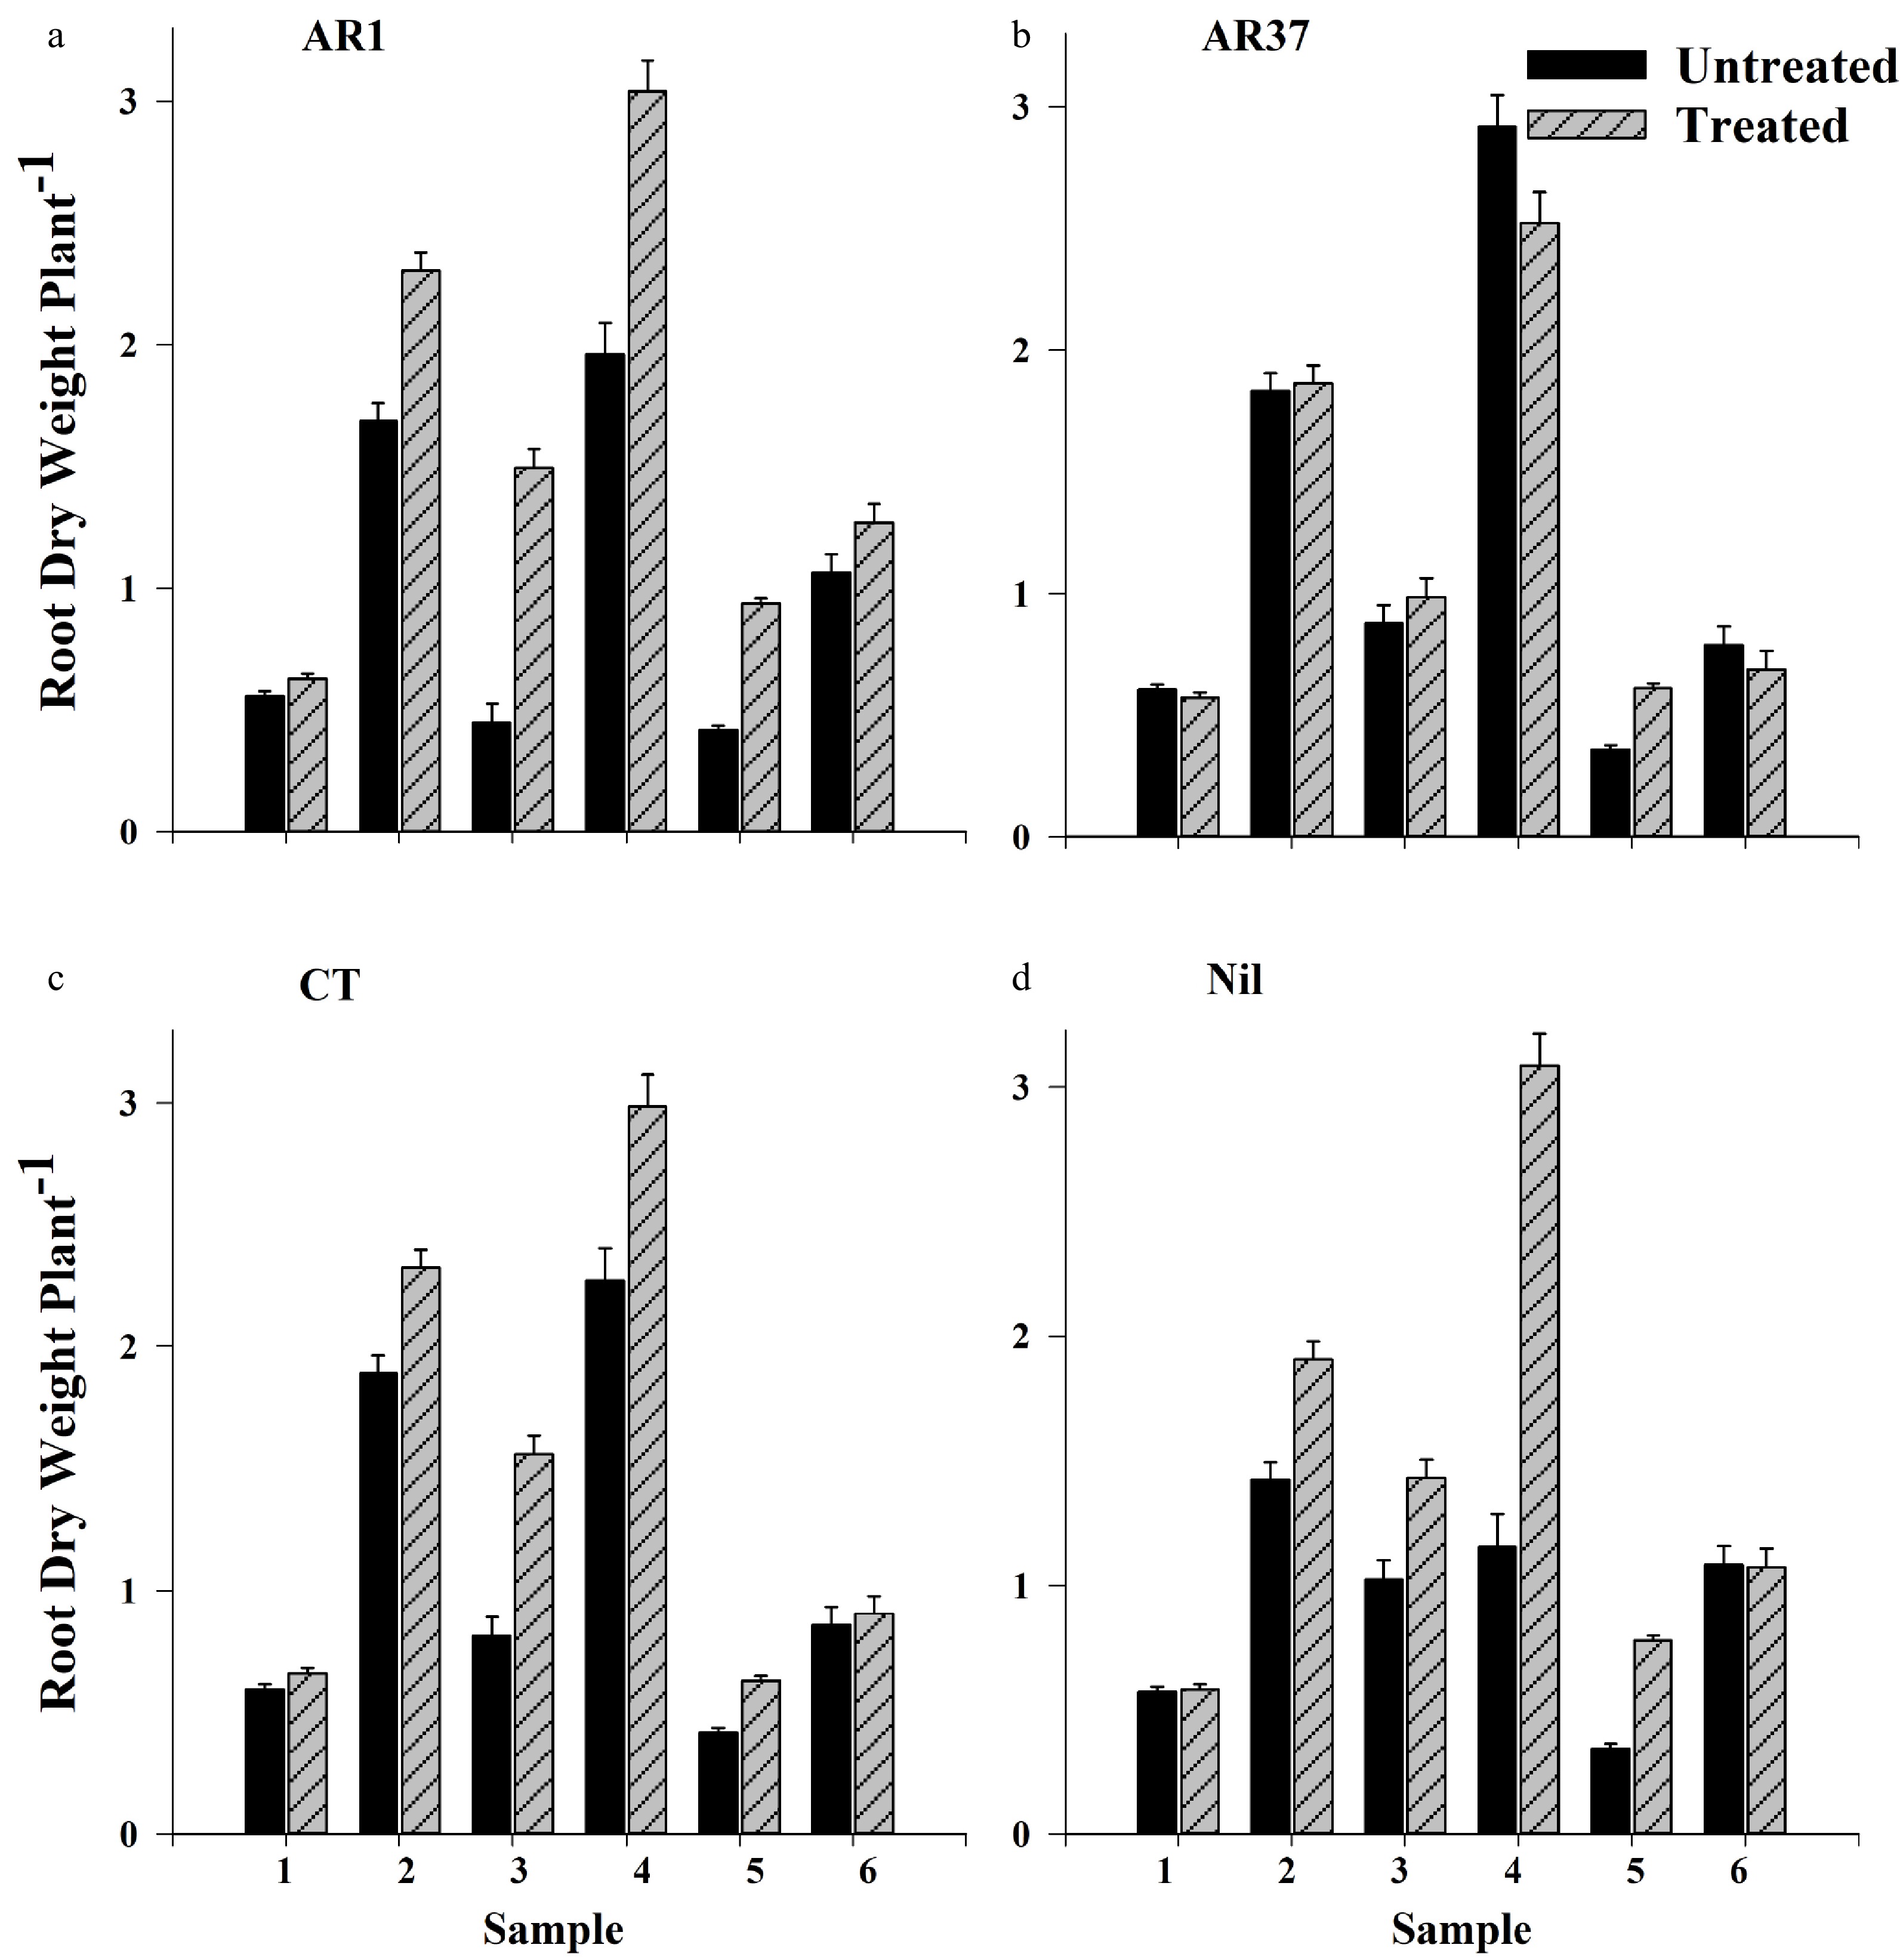
Figure 2. Root outgrowth (g plant−1 +SE) of ryegrass infected with endophytes (a) AR1, (b) AR37, (c) CT, or endophyte-free (d) Nil, and treated or not treated with insecticide, for six Samples taken over 18 months: 1 – late winter Year 1; 2 – Summer Year 1; 3 – Autumn Year 2; 4 – Spring Year 2; 5 – Summer Year 3; 6 – Autumn Year 3.
-
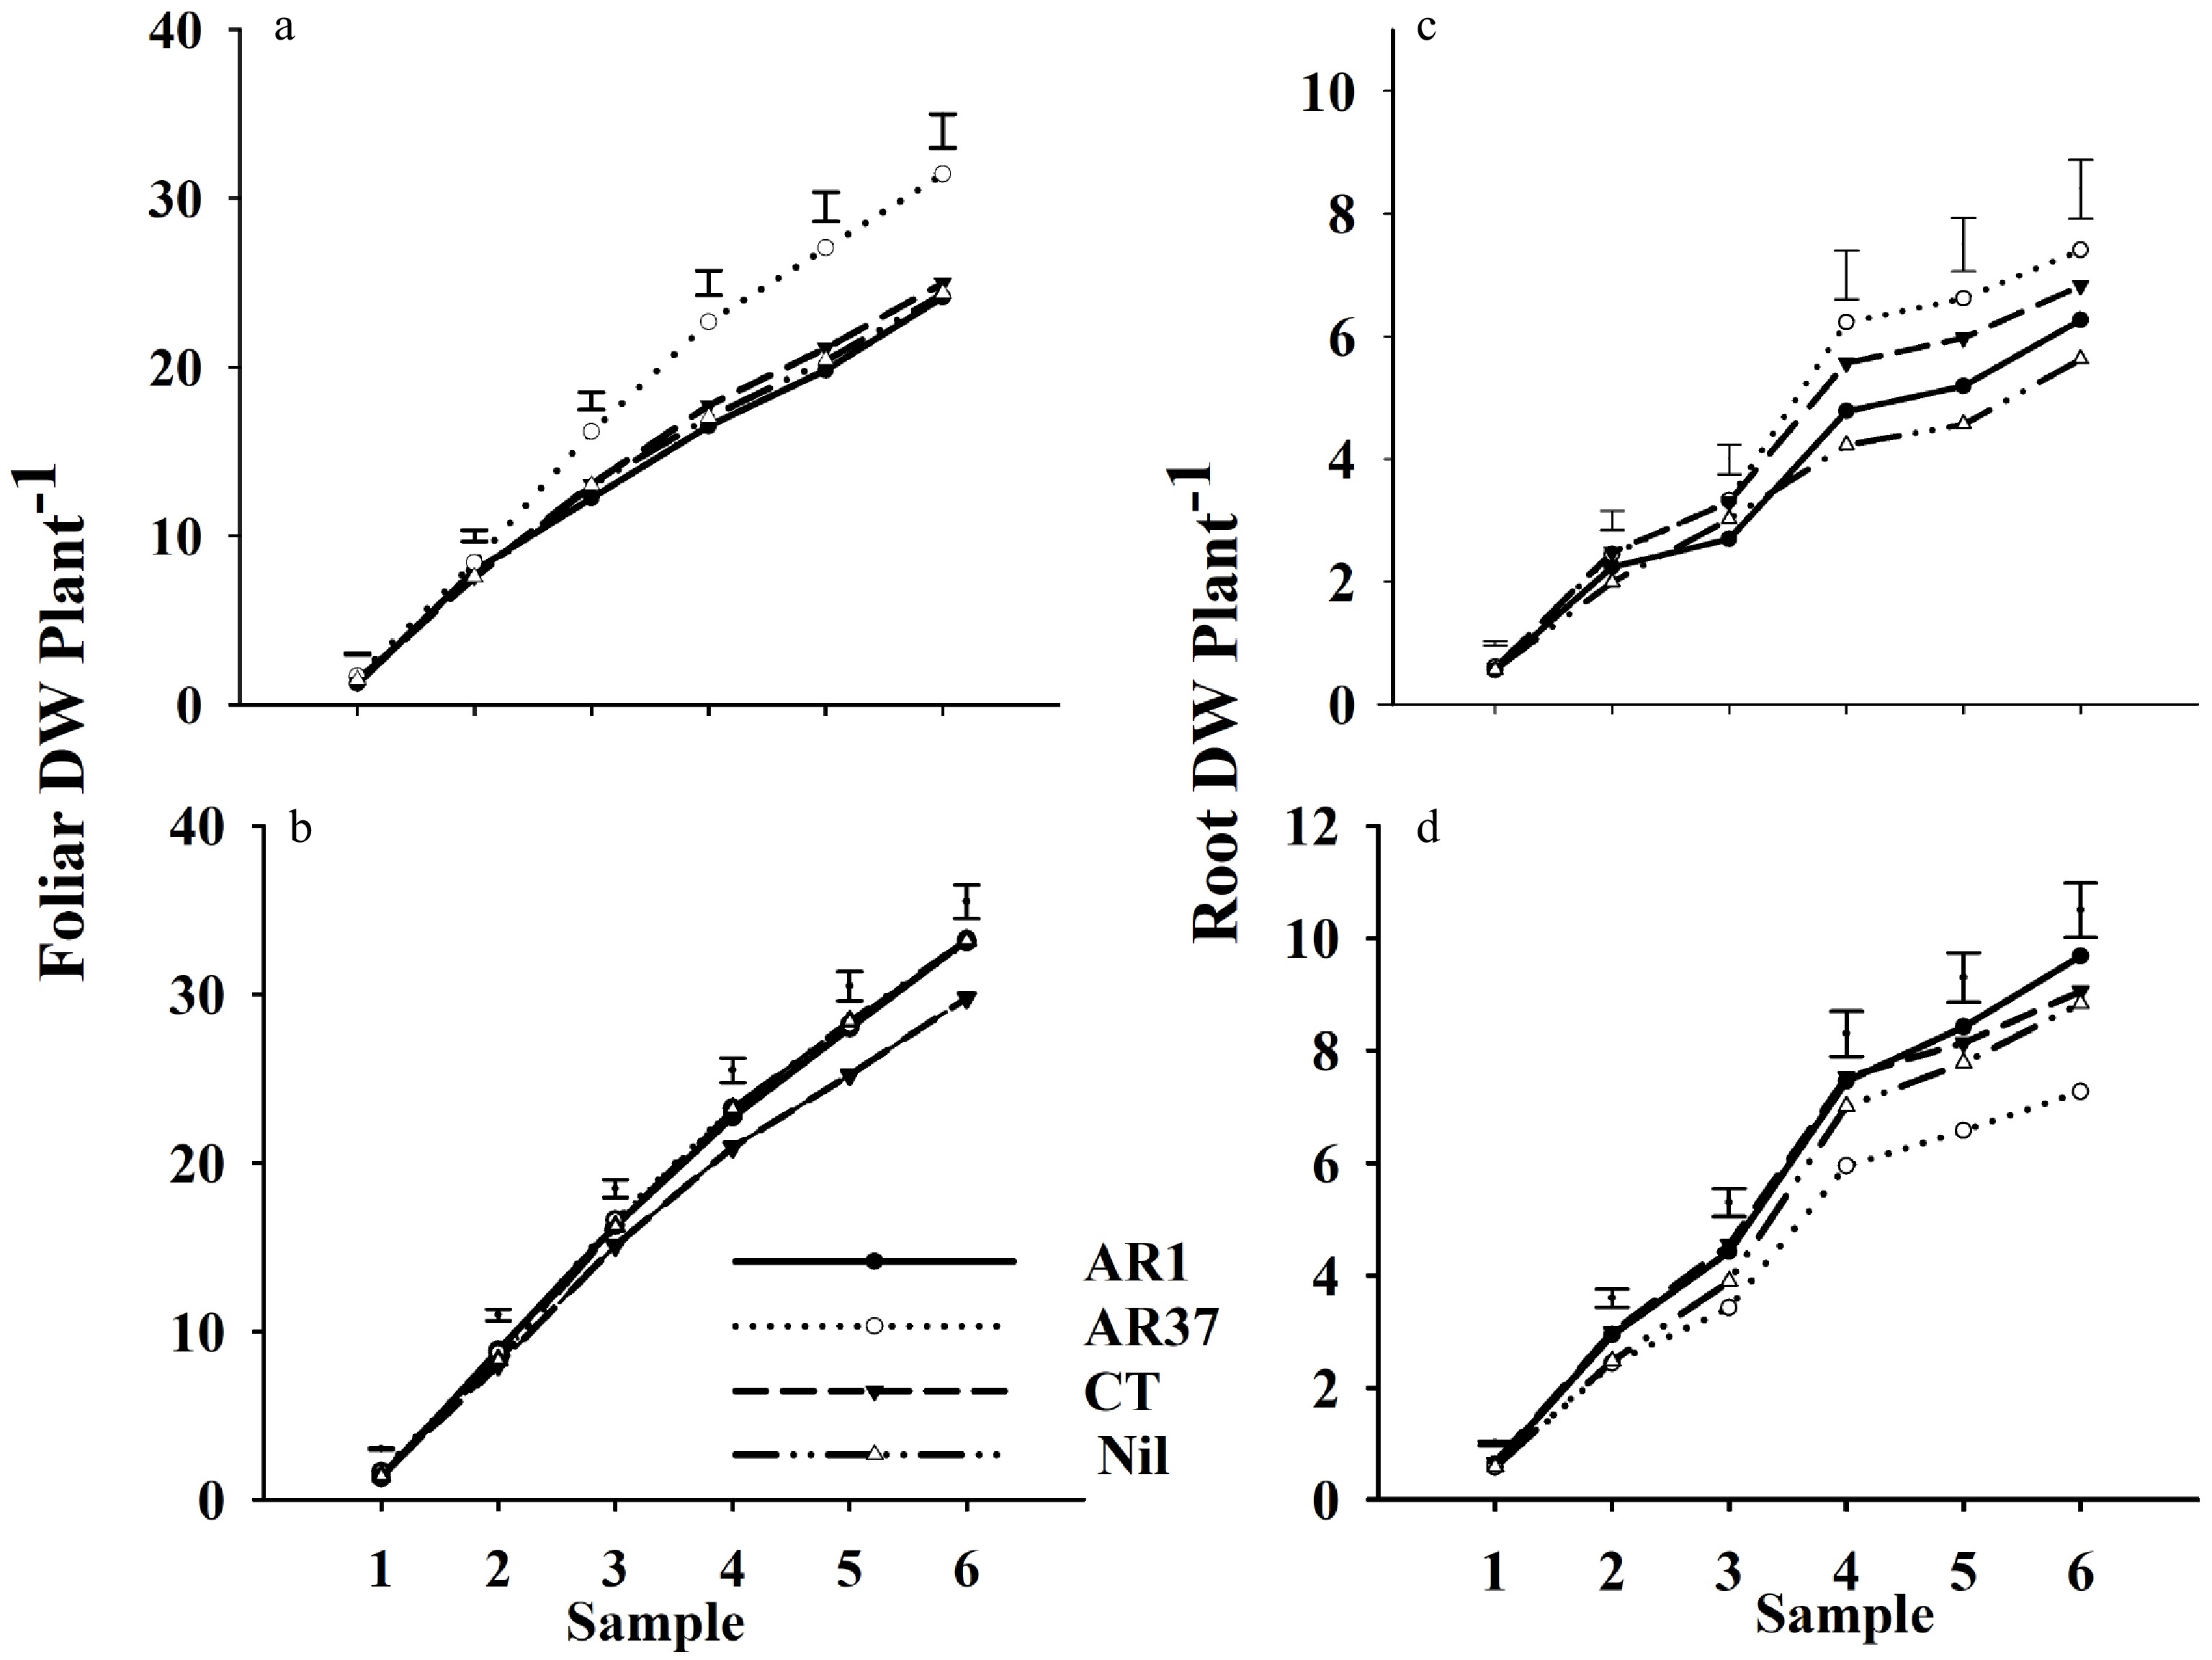
Figure 3. Cumulative dry weight of ryegrass infected with endophytes (a) AR1, (b) AR37, (c) CT, or endophyte-free (d) Nil for foliar growth of plants untreated or treated with insecticide (a, c), and for root outgrowth of plants untreated and treated (b, d) for six Samples taken over 18 months: 1 – late winter Year 1; 2 – Summer Year 1; 3 – Autumn Year 2; 4 – Spring Year 2; 5 – Summer Year 3; 6 – Autumn Year 3. Error bars = SED for endophyte by treatment comparisons.
-
Sample1 AR1 AR37 CT Nil LSD2 UN TR UN TR UN TR UN TR (5%) 1 0.47 0.49 0.38 0.39 0.47 0.46 0.38 0.42 0.104 2 0.25 0.31 0.30 0.27 0.30 0.36 0.23 0.30 0.088 3 0.08 0.20 0.12 0.12 0.13 0.21 0.15 0.17 0.055 4 0.46 0.48 0.44 0.39 0.50 0.52 0.35 0.45 0.135 5 0.12 0.19 0.09 0.12 0.11 0.15 0.10 0.14 0.051 6 0.24 0.24 0.18 0.16 0.22 0.22 0.24 0.20 0.087 Mean 0.26 0.30 0.24 0.22 0.22 0.26 0.27 0.31 0.06 1 1 – Winter Year 1; 2 – Summer Year 1; 3 – Autumn Year 2; 4 – Spring Year 2; 5 – Summer Year 3; 6 – Autumn Year 3.
2 LSD is for comparison between endophyte treatments within each insecticide stratum and not for comparisons between UN and TR plants within each endophyte treatment.
Bold lettering indicates a significant difference (p < 0.05) between treated and untreated plants within each endophyte treatment.Table 1. Root:shoot ratios of ryegrass without endophyte or infected with AR1, AR37 or CT endophytes for plants treated (TR) and untreated (UN) with insecticide. Ratios are calculated from root outgrowth and foliar growth at a 50 mm cutting height measured for six Samples taken over 18 months.
-
Endophyte Leaf sheath (g) Roots (g) % Dead tillers UN TR UN TR Summer Y1 Autumn Y2 Spring Y2 AR1 2.35 3.08 6.94 13.37 2.5 ± 0.8 10.6 ± 4.2 18.7 ± 8.3 AR37 2.59 2.54 8.78 9.26 0.7 ± 0.1 2.1 ± 0.9 3.9 ± 2.1 CT 1.95 2.33 7.52 10.14 1.1 ± 0.3 4.3 ± 1.8 5.4 ± 2.8 Nil 2.16 2.80 6.69 10.54 1.6 ± 0.2 16.4 ± 6.0 43.8 ± 13.4 LSD1 0.4621 2.426 P2 0.001 0.009 0.050 < 0.001 0.001 1 LSD is for comparisons between UN and TR for the same endophyte; bold lettering indicates a significant difference.
2 P value is for differences in percentage of dead tillers between endophyte treatments.
Bold lettering indicates a significant difference (p < 0.05) between treated and untreated plants within each endophyte treatment.Table 2. Back-transformed percentage (±SE) of dead tillers for UN L. perenne plants without endophyte (Nil) or infected with AR1, AR37 or CT endophytes, and dry weight of leaf sheath and main plant roots in the inner bag for TR and UN plants at the final harvest in autumn 2004.
Figures
(3)
Tables
(2)