-

Figure 1. Gene expression pattern and subcellular localization of SlNAC4. (a) Structure of the SlNAC4 protein. A−E represents the 5 subdomains of the conserved NAC domain. (b) Gene expression of SlNAC4 in different organs and fruit ripening stages of tomato. IMG, immature green; MG, mature green; Br, breaker; RR, red ripe. Bars represent ± SD of three independent replicates. SlActin gene was used as the internal control. (c) SlNAC4 co-localized with RIN (a marker protein of the nucleus) in nuclei. CaMV35S::SlNAC4-GFP represents SlNAC4 and GFP fusion protein, CaMV35S::RIN-mCherry represents MADS-RIN and mCherry fusion protein. CaMV35S::GFP co-expressed with CaMV35S::mCherry represent the control. Bars = 20 μm.
-

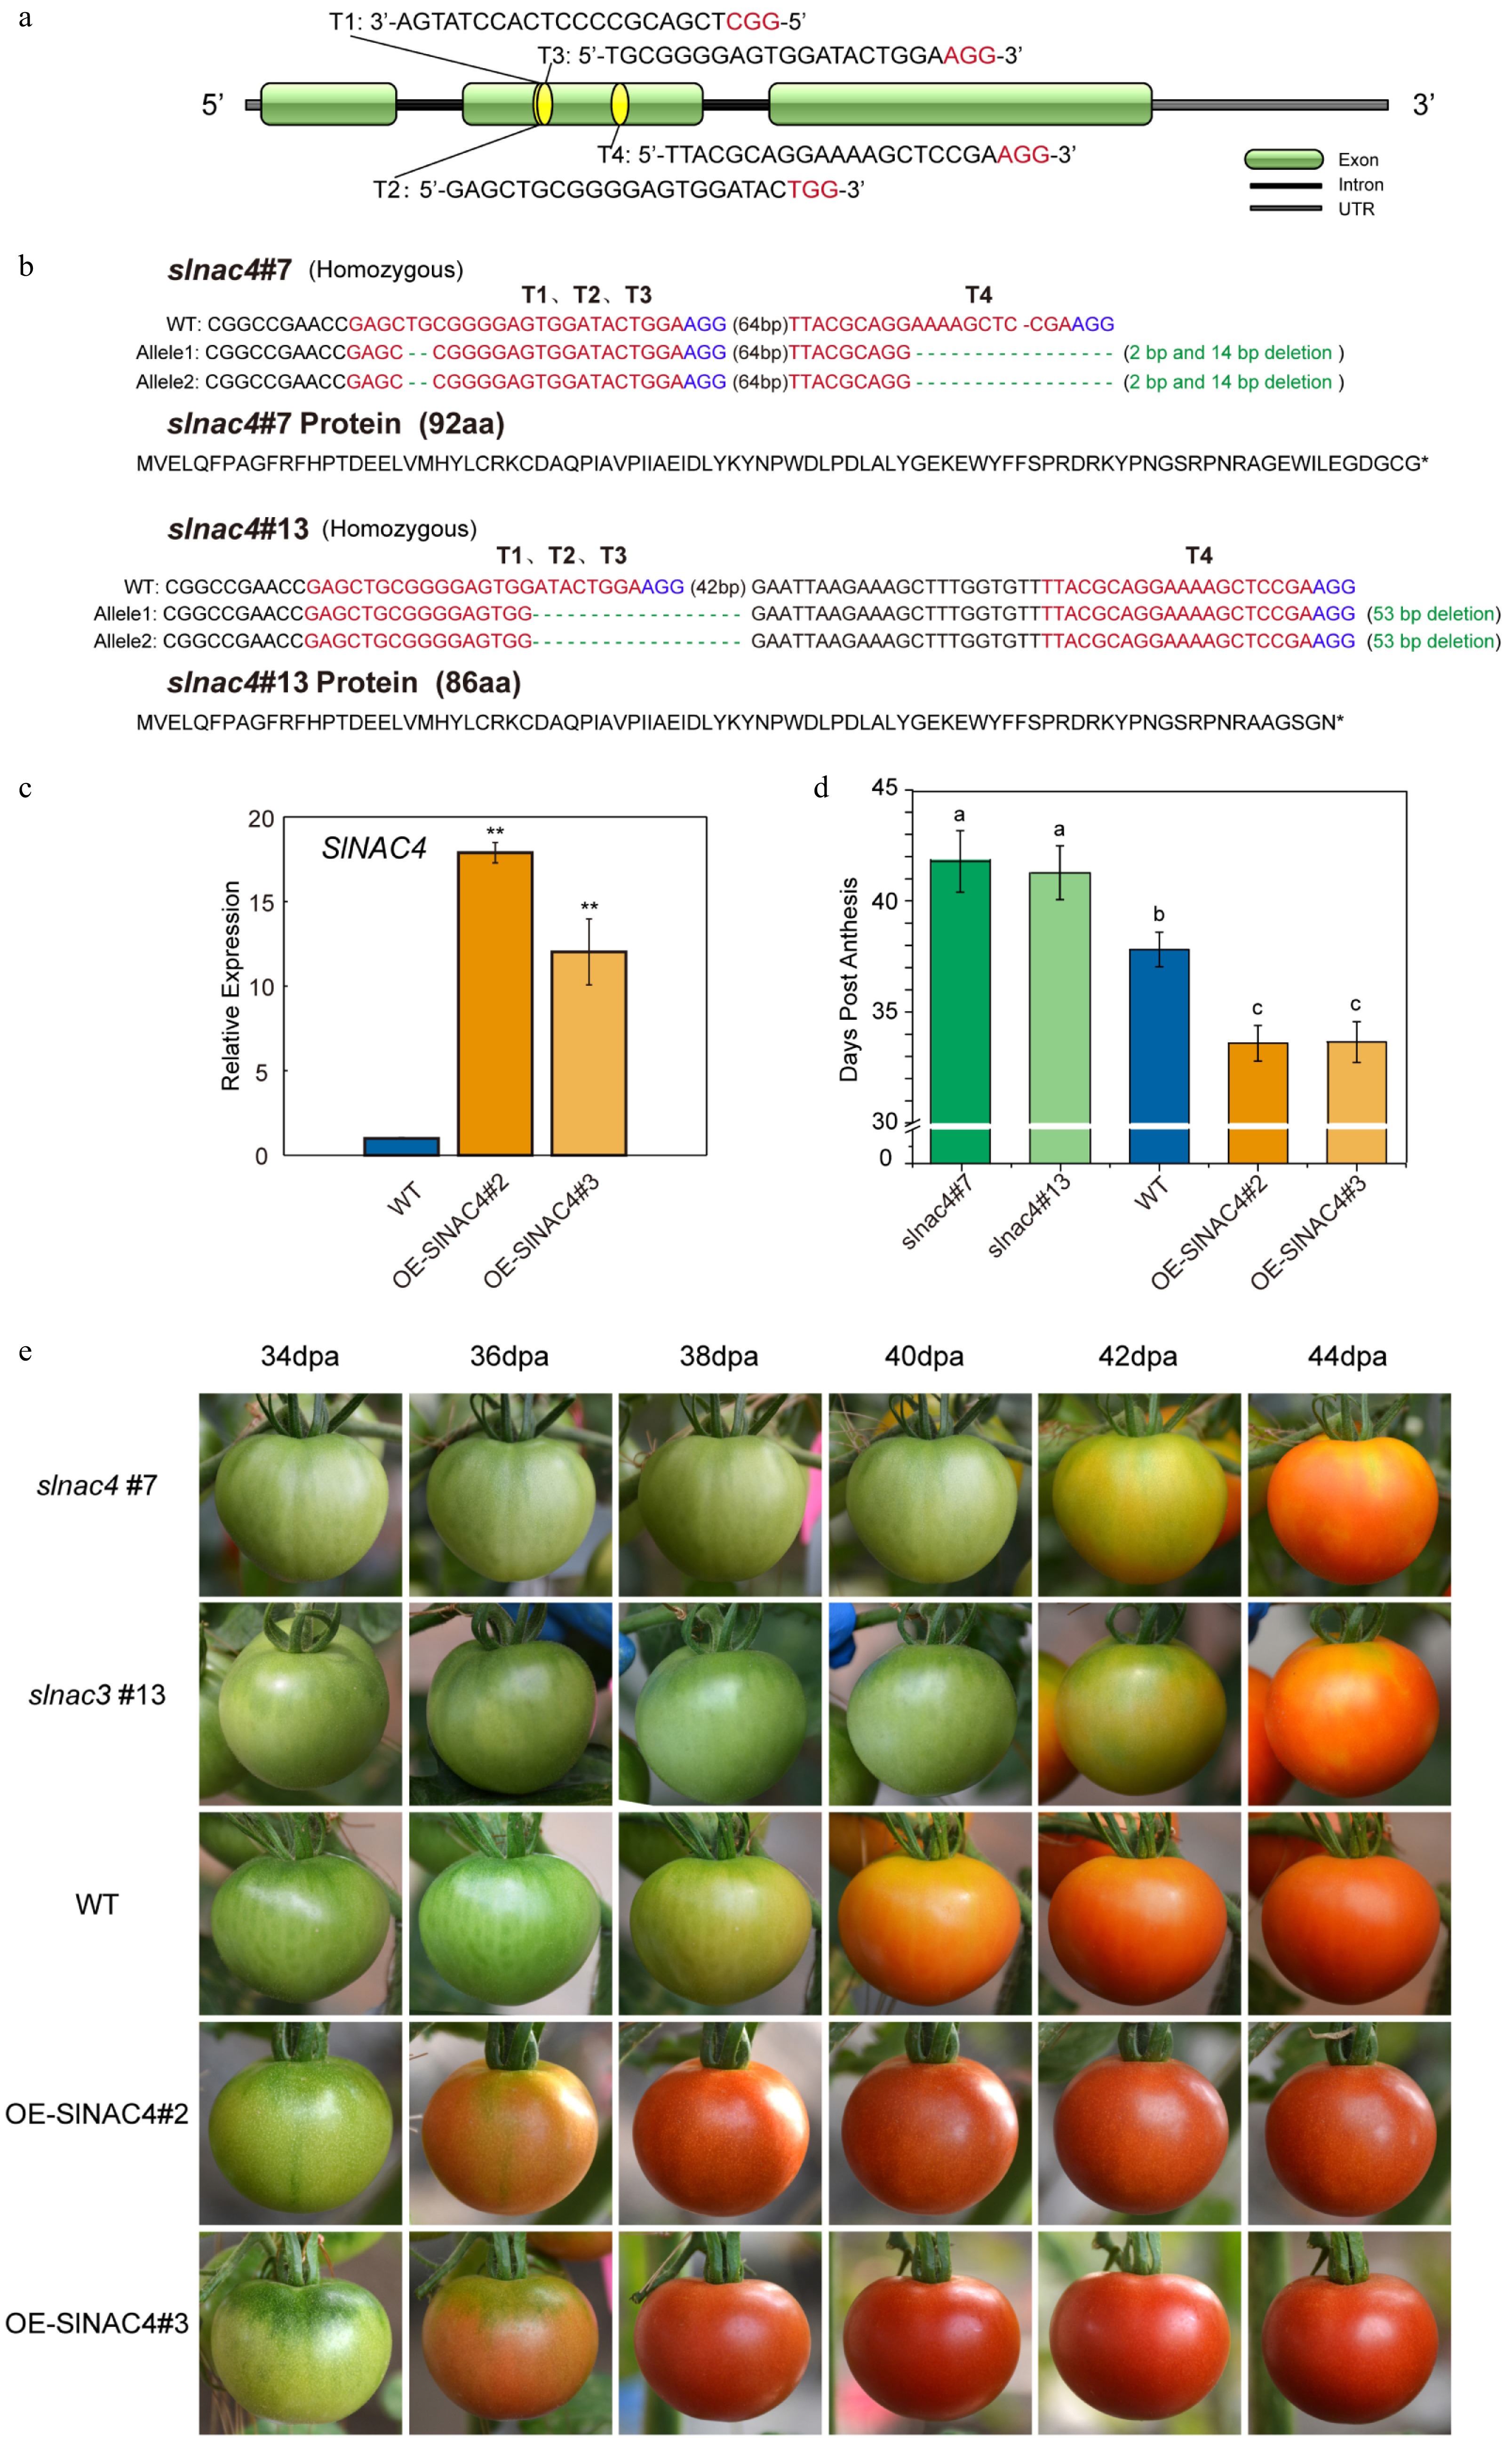
Figure 2. SlNAC4 CRISPR/Cas9 gene edited and overexpression lines, and their tomato fruit ripening phenotype. (a) Schematic illustration of four CRISPR/Cas9 target sites (T1, T2, T3, T4) in the SlNAC4 genomic sequence. (b) Gene editing details of slnac4#7 and slnac4#13 mutants. Blue letters represent the protospacer adjacent motif (PAM). (c) qRT-PCR analyses of SlNAC4 expression level in fruit of OE-SlNAC4#2 and OE-SlNAC4#3 overexpression lines compared with WT. Bars represent ± SD of three independent replicates. The SlActin gene was used as the internal control. (d) Days from anthesis to the fruit breaker stage of WT, slnac4#7, slnac4#13, OE-SlNAC4#2, and OE-SlNAC4#3. Lowercase letters represent significant differences (p < 0.05). (e) The tomato fruit ripening phenotype of WT, slnac4#7, slnac4#13, OE-SlNAC4#2, and OE-SlNAC4#3. dpa: days post anthesis.
-

Figure 3. Tomato fruit softening is affected by different levels of SlNAC4. (a) The firmness of WT, slnac4#7, slnac4#13, OE-SlNAC4#2, and OE-SlNAC4#3 tomato fruit at different ripening stages. SD (p < 0.05) are indicated with lowercase letters. MG, mature green; Br, breaker; B+n, n days after breaker. Error bars represent ± SD of at least six independent replicates. (b) Fruit cell wall structure of WT, slnac4#7, and OE-SlNAC4#2 at the breaker stage created by transmission electron microscopy. Bars = 0.5 μm.
-

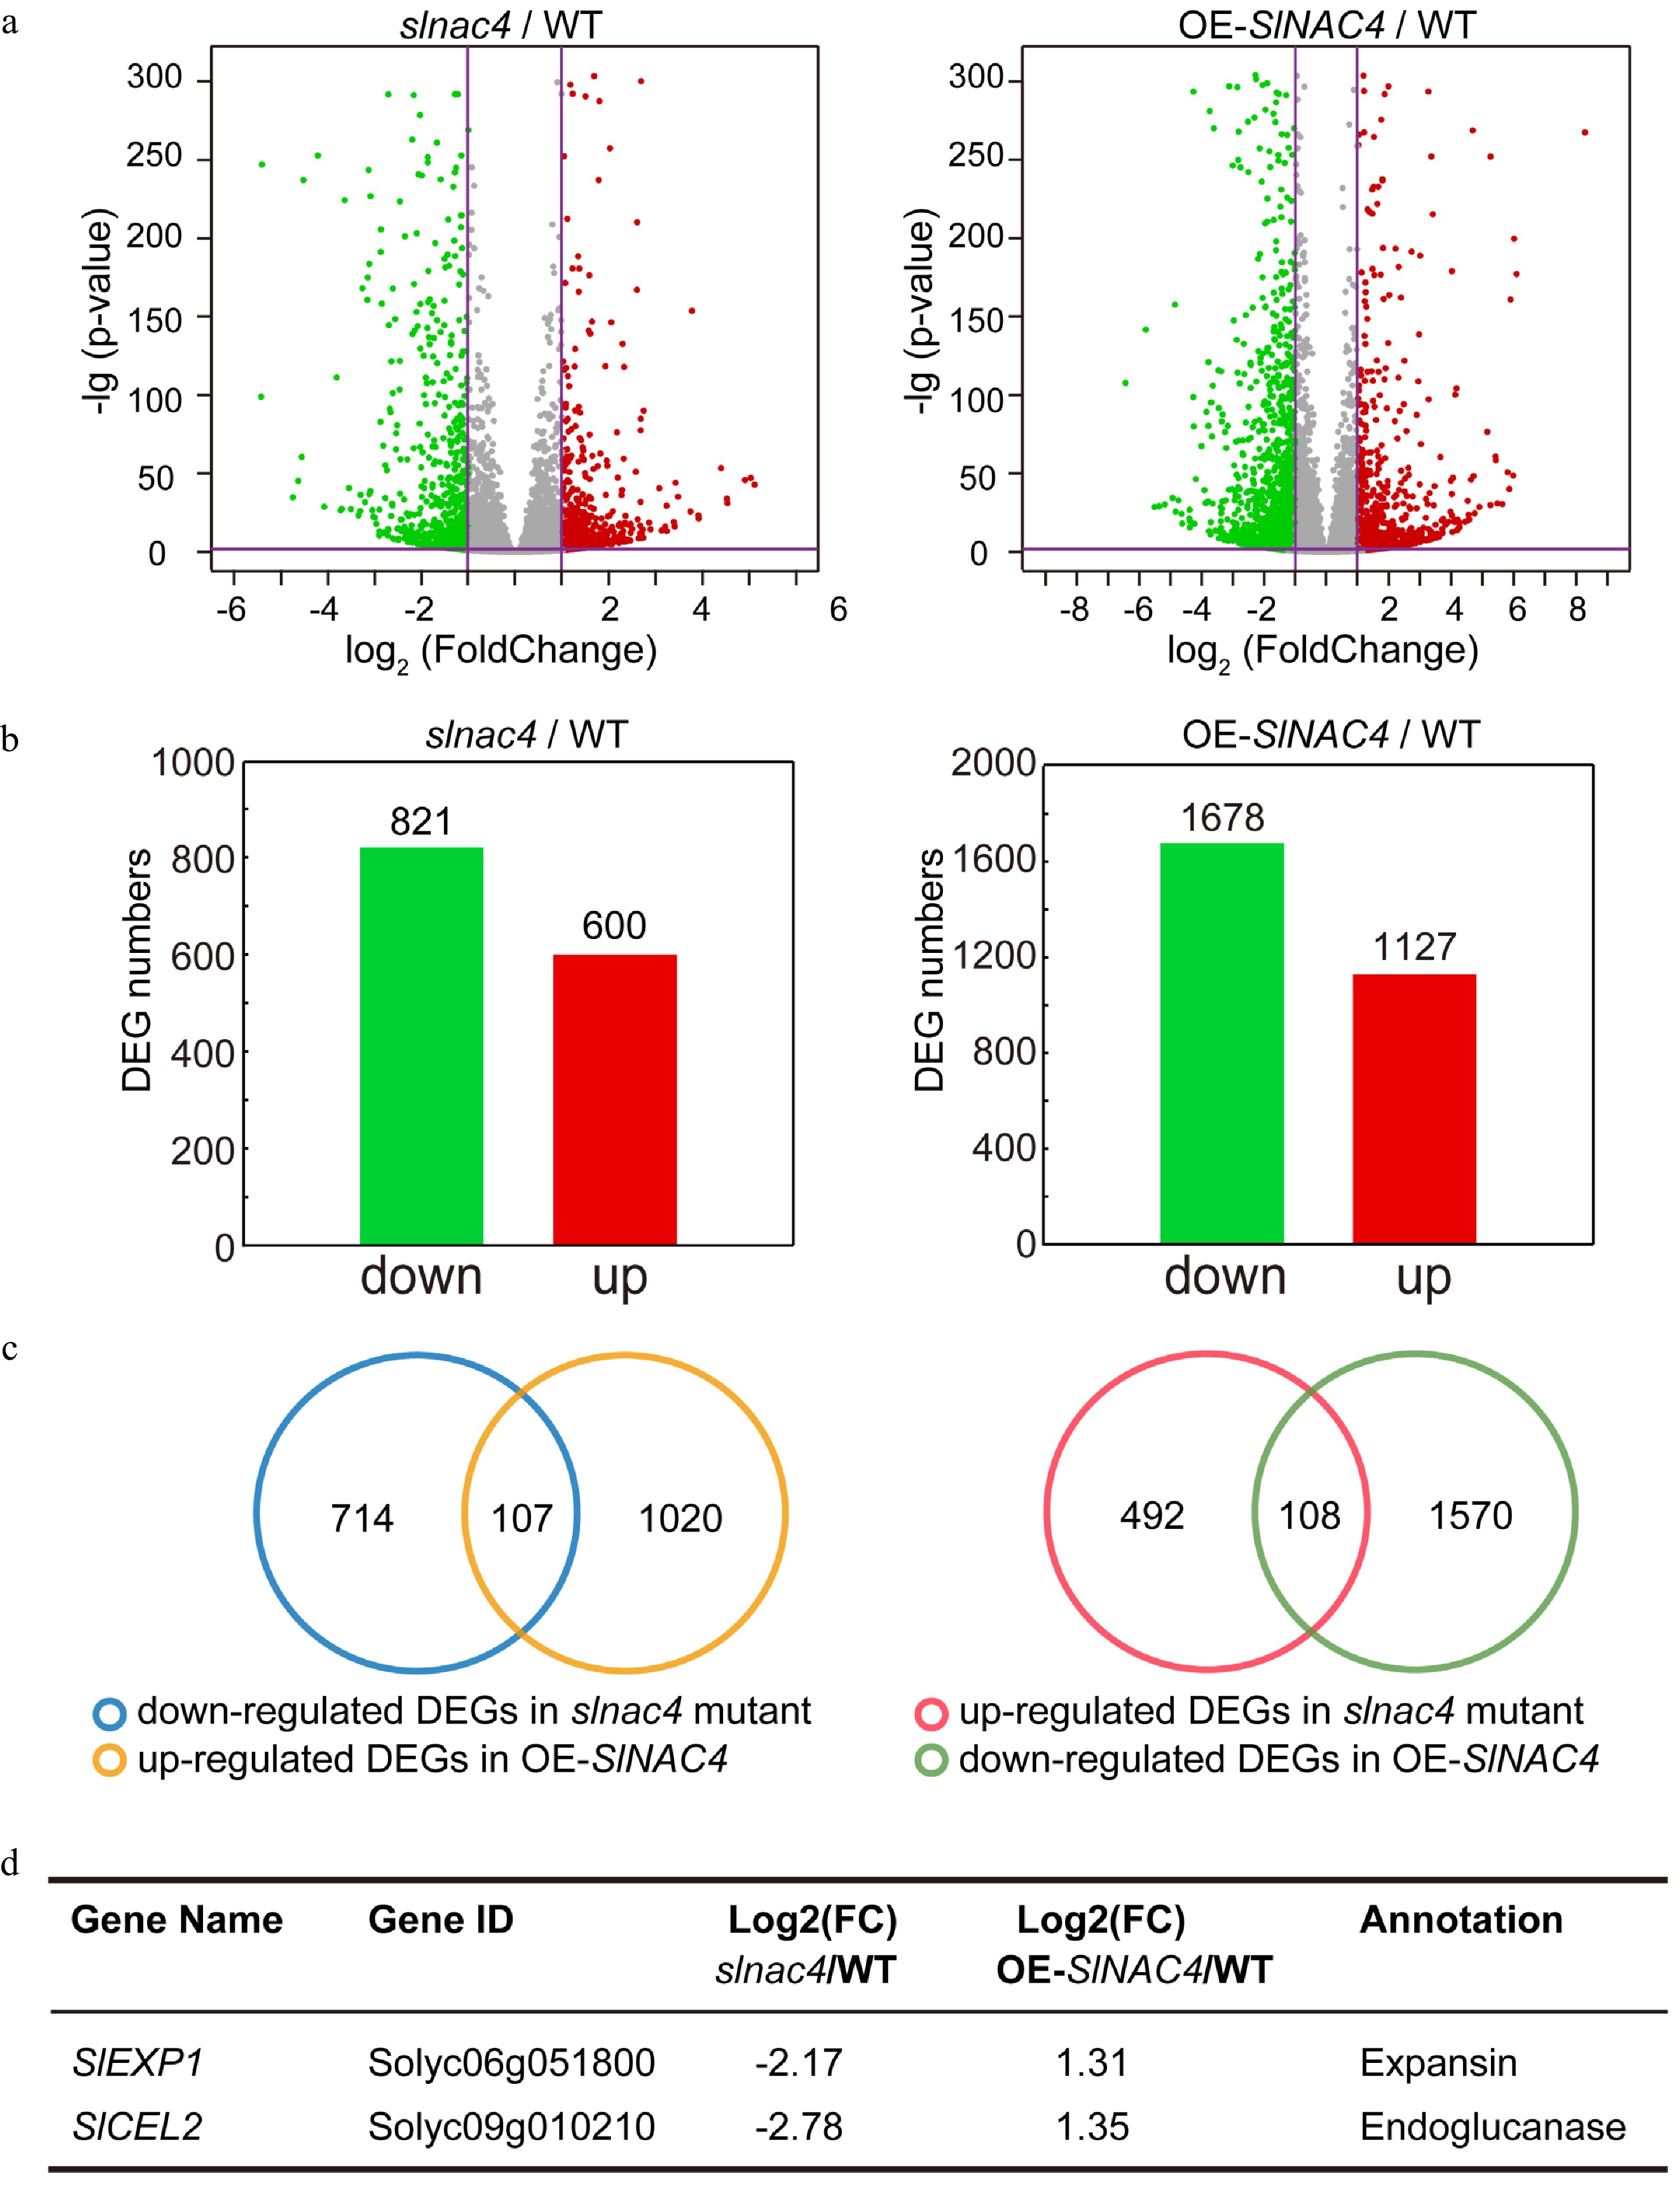
Figure 4. RNA-Sequence analyses of WT, slnac4#7, and OE-SlNAC4#2 fruit. (a) RNA-sequencing data visualized by volcano plots. Each point corresponds to a DEG. Red dots represent up-regulated genes, green dots represent down-regulating genes in slnac4#7 compared with WT or OE-SlNAC4#2 compared with WT. | Log2 (Fold change) | = 1 and p-value = 0.05 are marked with purple lines. (b) The number of up-regulated and down-regulated genes in slnac4#7/WT and OE-SlNAC4#2/WT fruit. (c) DEGs opposite regulated in slnac4#7 and OE-SlNAC4#2. (d) Two key tomato fruit softening related genes SlEXP1 and SlCEL2 are significantly down-regulated in slnac4 mutant and up-regulated in OE-SlNAC4 fruit.
-

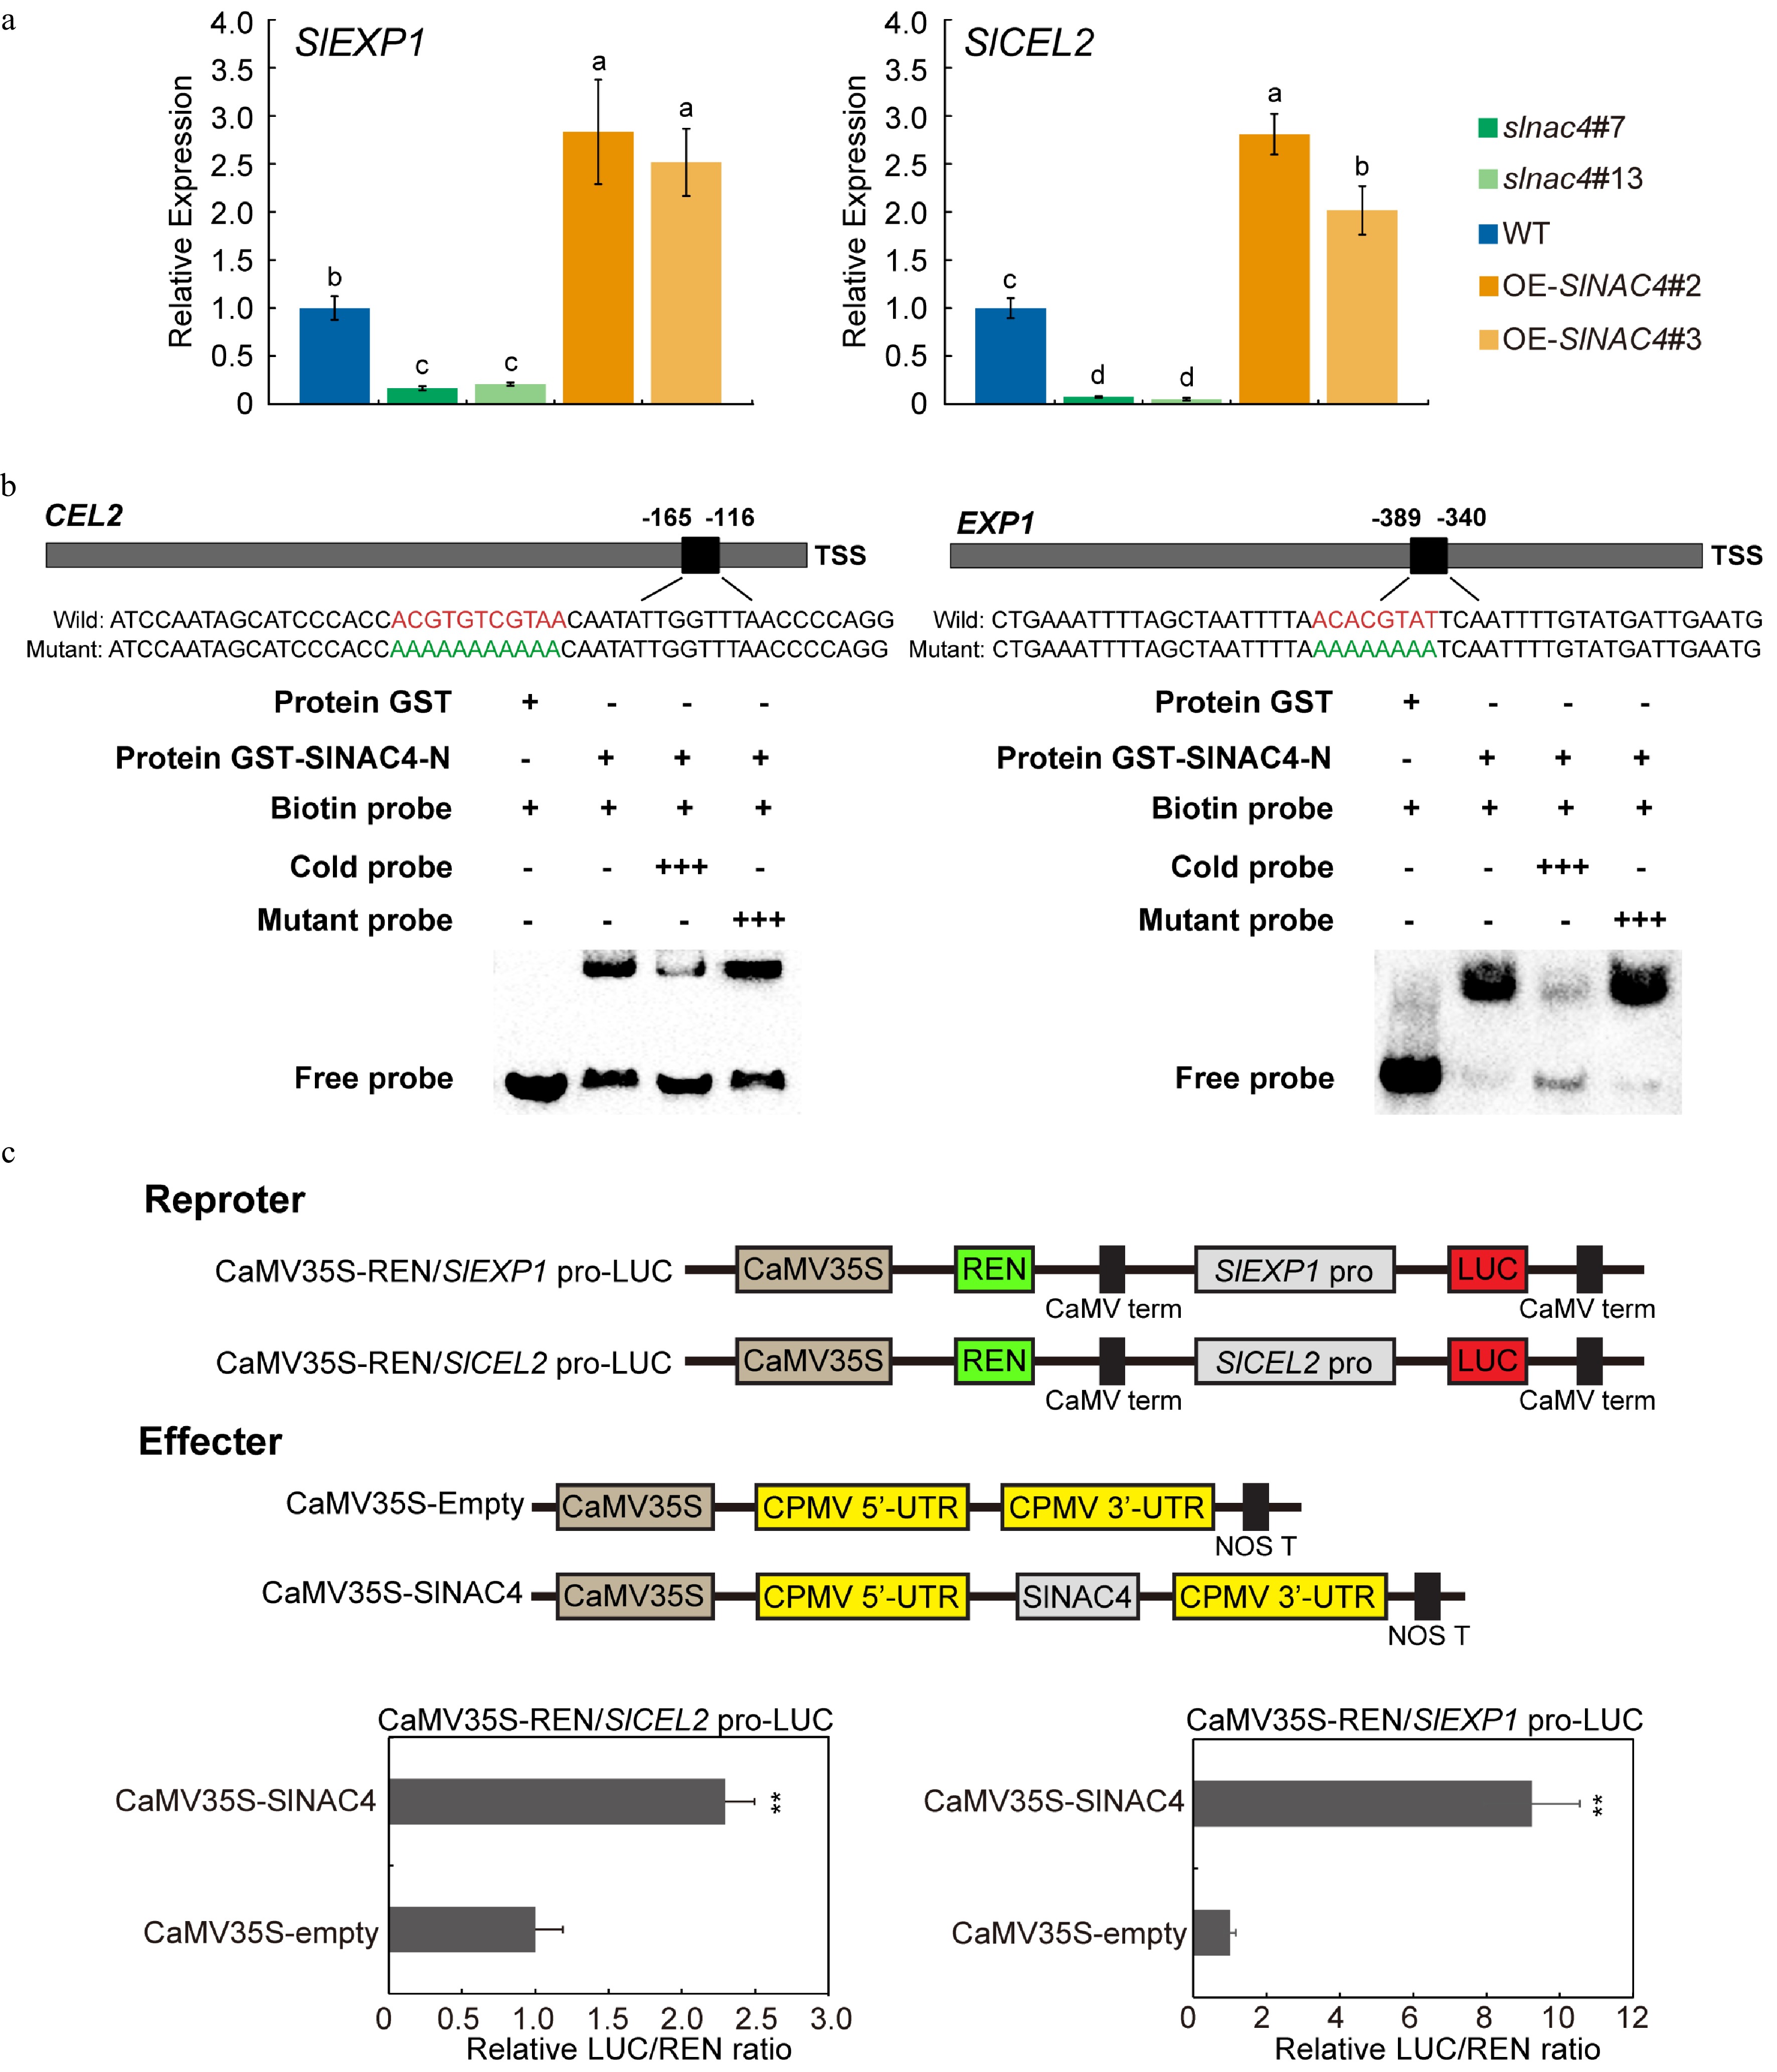
Figure 5. SlEXP1 and SlCEL2 are direct targets of SlNAC4. (a) qRT-PCR analysis of SlEXP1 and SlCEL2 in WT, slnac4#7, slnac4#13, OE-SlNAC4#2, and OE-SlNAC4#3 at the breaker stage. Bars represent ± SD of three independent replicates. SlActin was used as the internal control. (b) SlNAC4 directly binds to the promoters of SlEXP1 and SlCEL2. The wild-type probes containing the NACRS ([TA][TG][AGC]CGT[GA][TA]) were biotin-labeled. 500×cold probes containing the wild-type NACRS or mutated NACRS were performed for competition. + represents presence, and − represents absence, +++ indicates increasing amounts. (c) The promoters of SlEXP1 and SlCEL2 were significantly activated by SlNAC4. Error bars represent ± SD of six replicates. ** indicates p < 0.01 (Student's t-test).
-

Figure 6. Regulatory model of SlNAC4 in tomato fruit softening. The expression of CEL2 and EXP1 genes related to cell wall metabolism was actived in SlNAC4 over-expressing tomato fruit. The CEL2 and EXP1 enzymes can degrade fruit cell wall components including pectin, cellulose and hemicellulose, which result in the adhesion between normal cells is destroyed and fruit softening is accelerated. On the contrary, the transcription of CEL2 and EXP1 genes is not activated in slnac4 mutant fruit, and the degradation of fruit cell wall component such as pectin, cellulose and hemicellulose are inhibited, and fruit softening was significantly slowed.
Figures
(6)
Tables
(0)