-
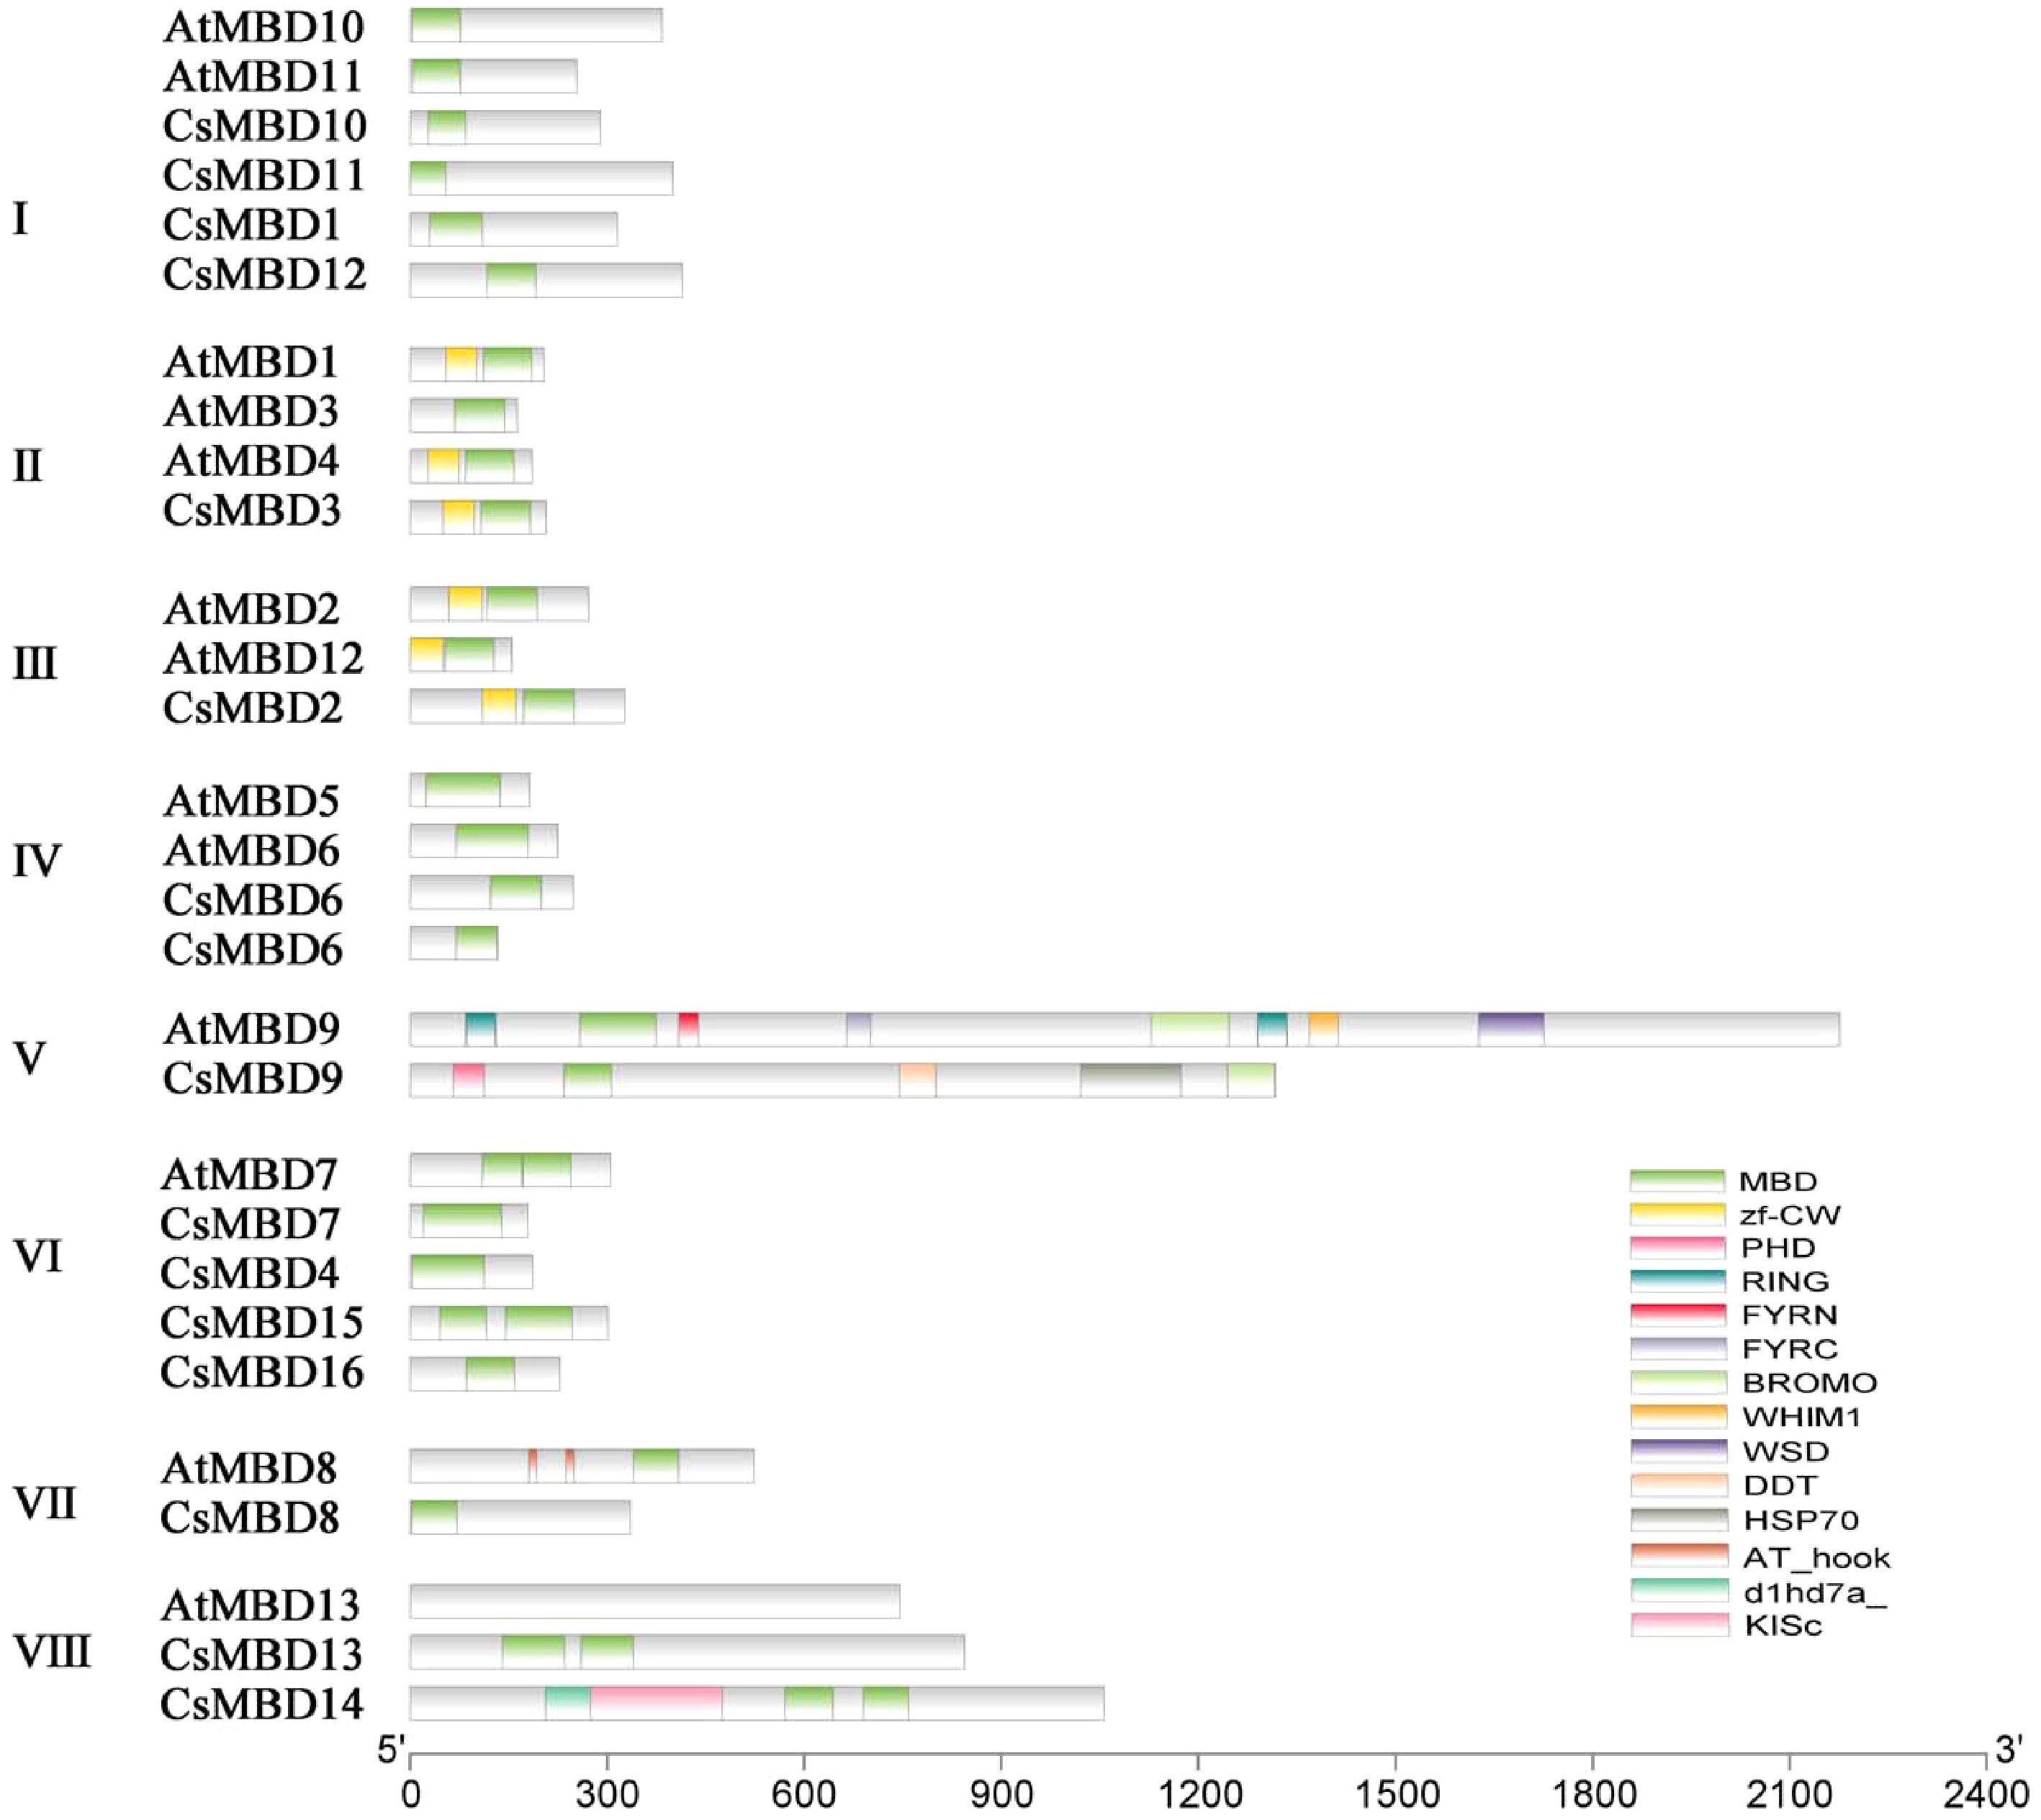
Figure 1. Schematic structures of MBD proteins; CsMBD1-16 from the tea plant and AtMBD1-13 from Arabidopsis. The conserved MBD domains are indicated with green rectangles. The length of the box represents the length of the domain. Different coloured rectangles represent different protein domains.
-

Figure 2. Alignment of MBD domains of the AtMBD1-13 from Arabidopsis, CsMBD1-16 from the tea plant and MeCP2 proteins from humans. The secondary structure for amino acid conservation is displayed at the top: four β-sheet strands (β1–4), one α-helix, and two loop regions (L1–2). Five asterisks indicate the positions of residues that may be crucial for the binding of MBD proteins to methylated DNA.
-
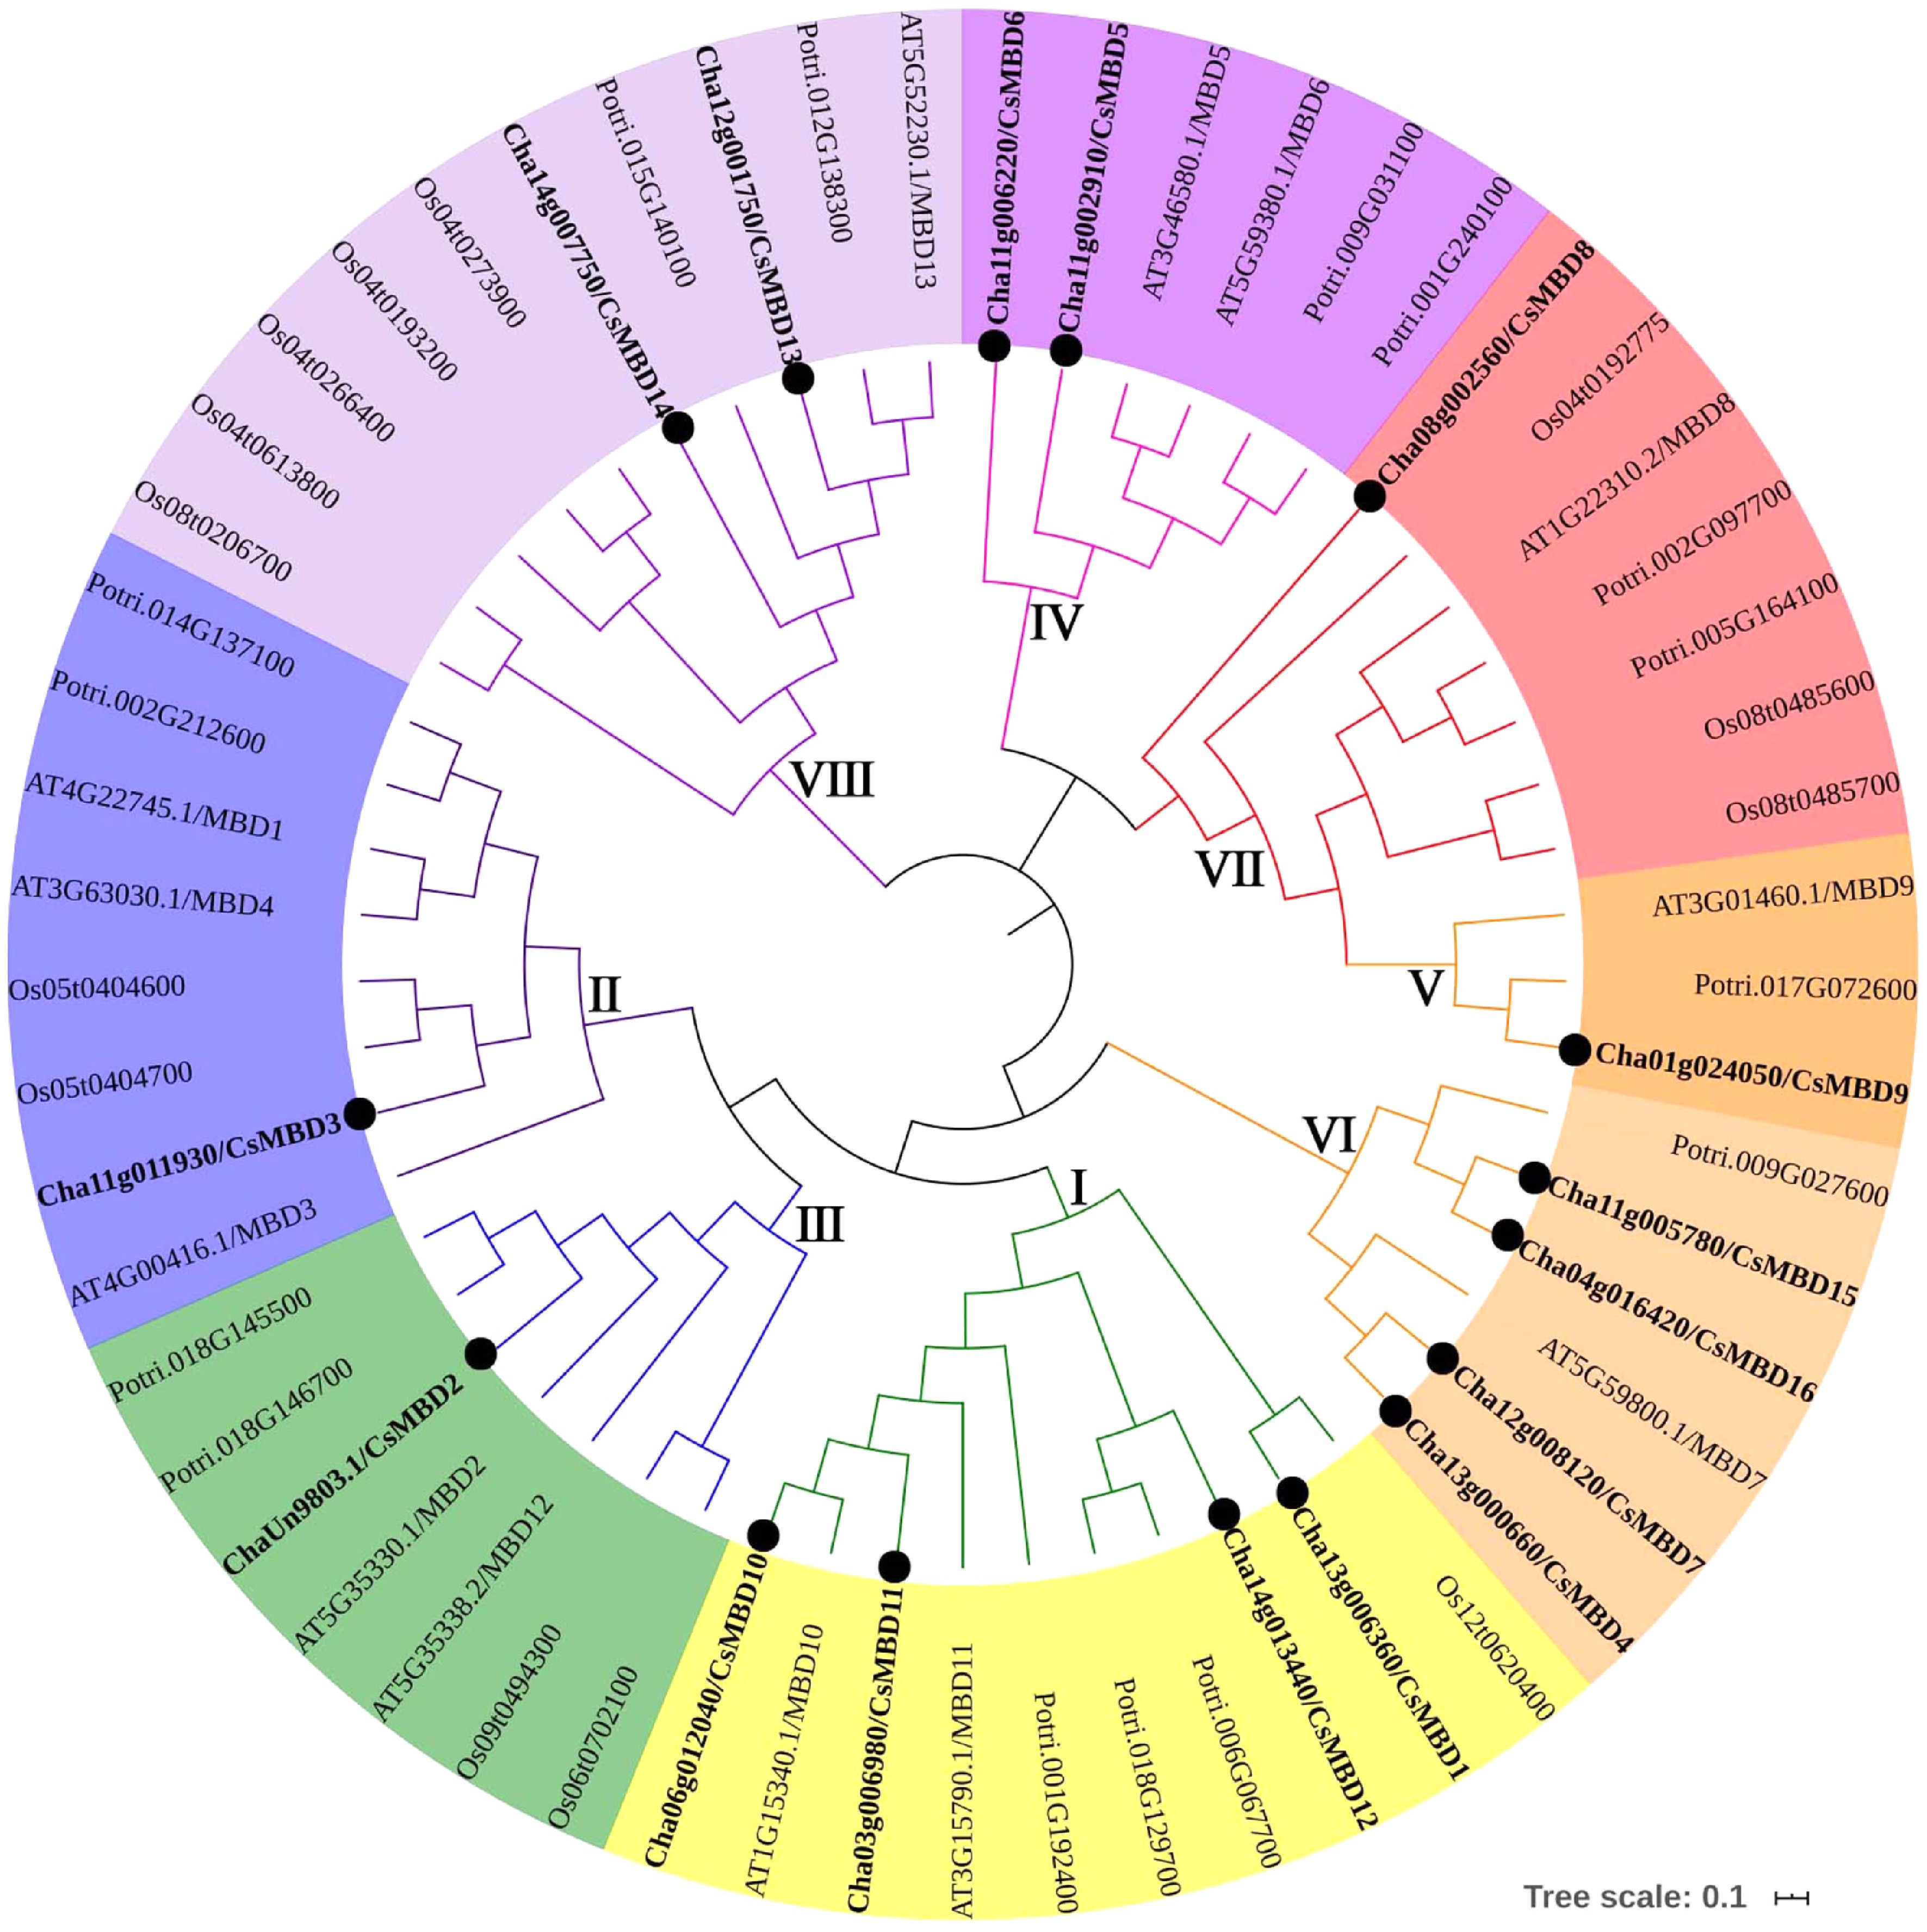
Figure 3. Phylogenetic tree of MBD proteins in tea plants (16), poplar (15), rice (14) and Arabidopsis (13). The unrooted tree was created using MEGA7.0 by the neighbour-joining method. The bootstrap value = 1,000.
-
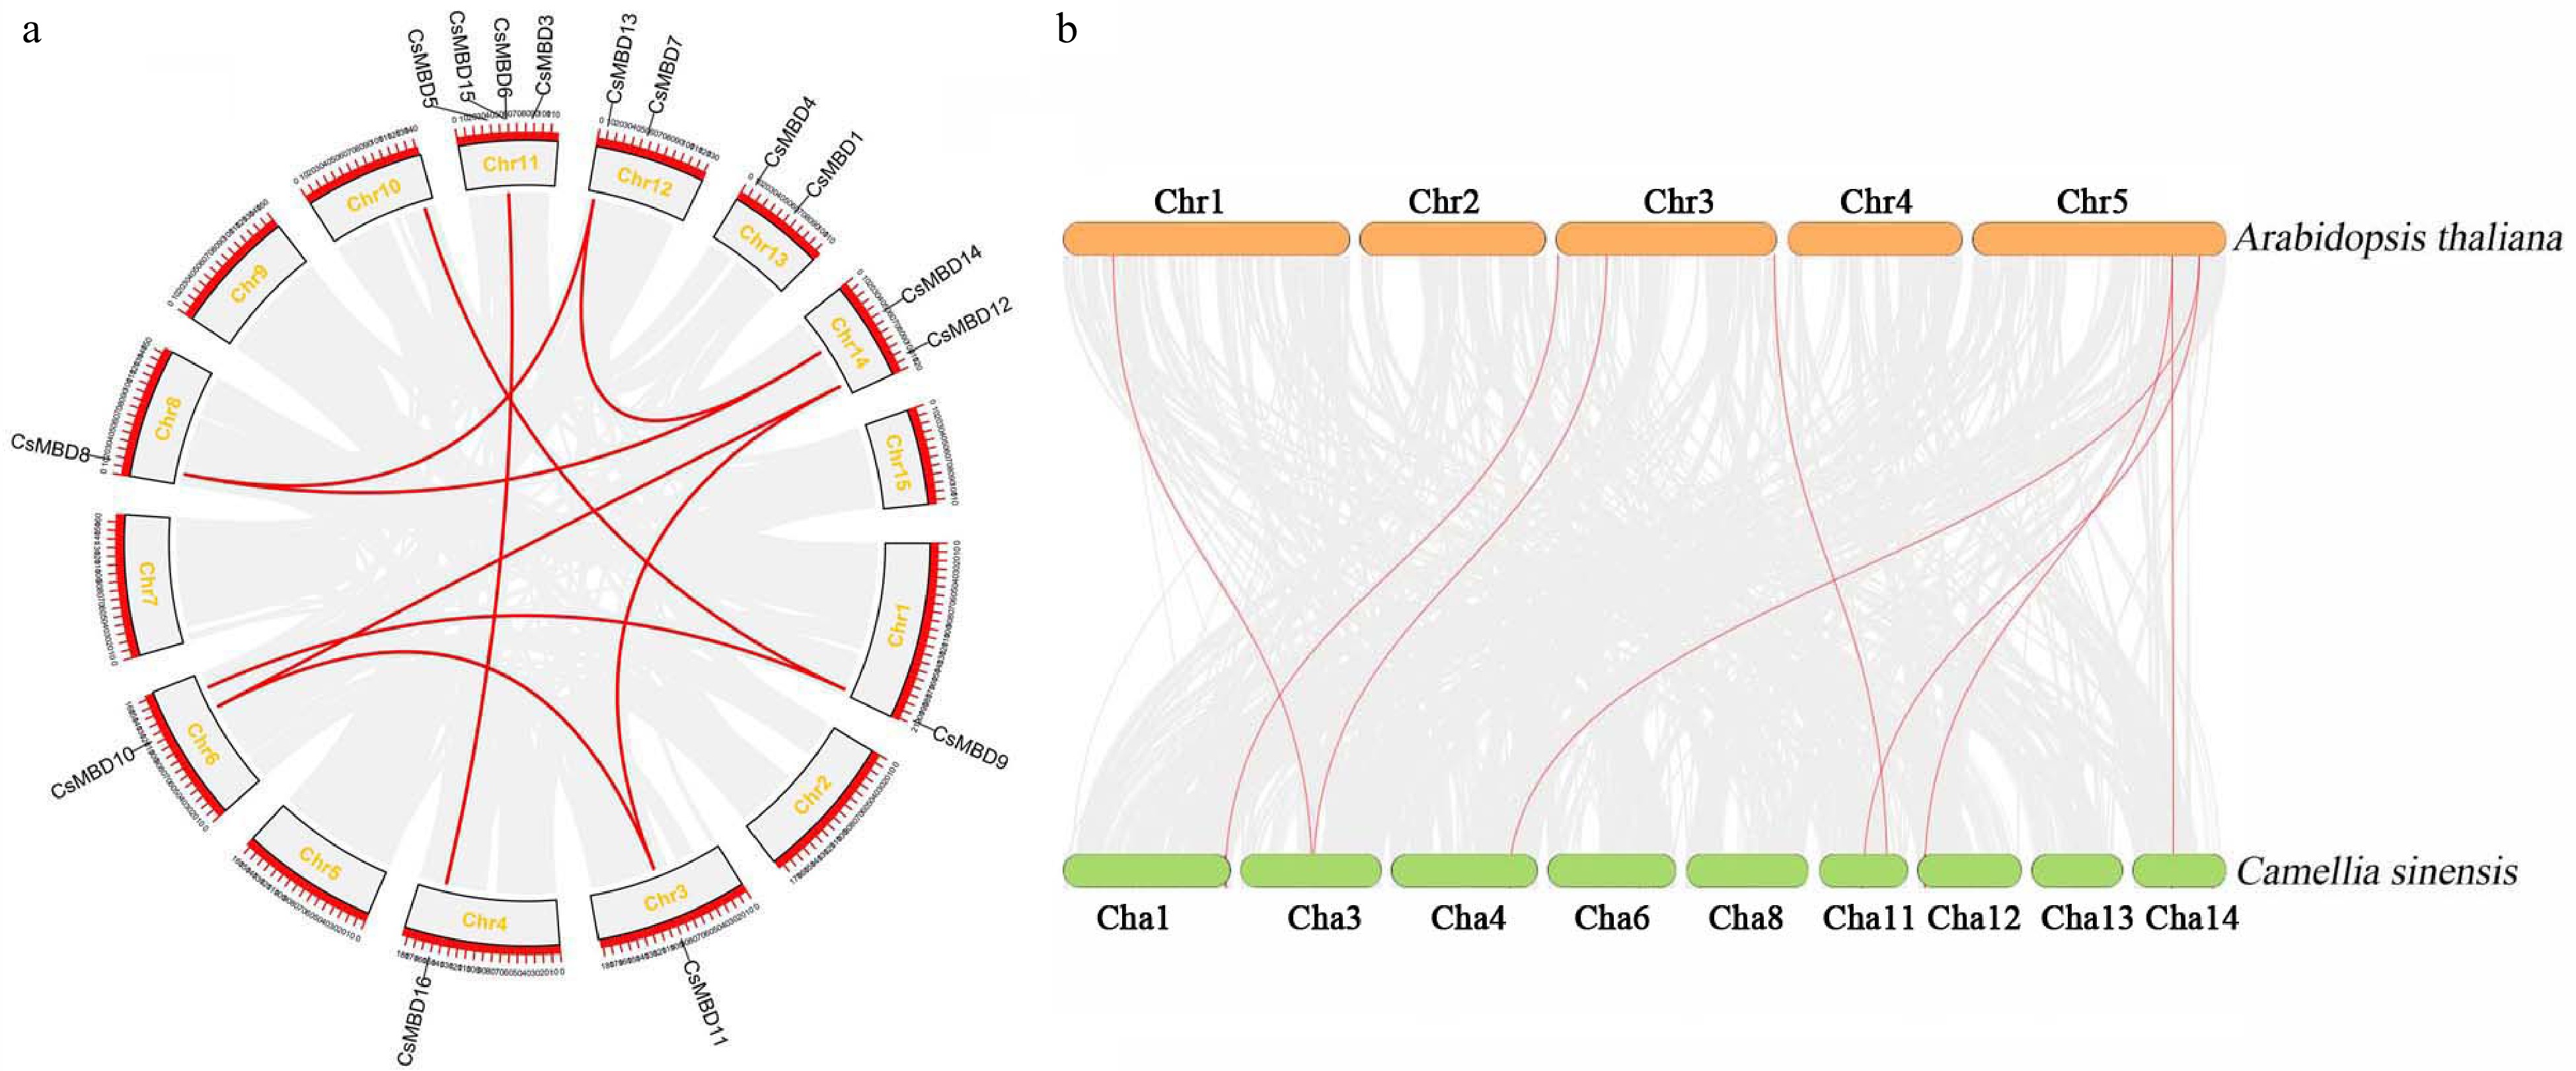
Figure 4. Duplication analysis of MBD genes in tea plants and Arabidopsis. (a) Synteny analysis of 16 CsMBD genes in tea plants. (b) Synteny analysis of MBD genes between tea plants and Arabidopsis. Gray lines in the background indicate the collinear blocks within the tea plant and other plant genomes, while the red lines highlight the syntenic MBD gene pairs.
-
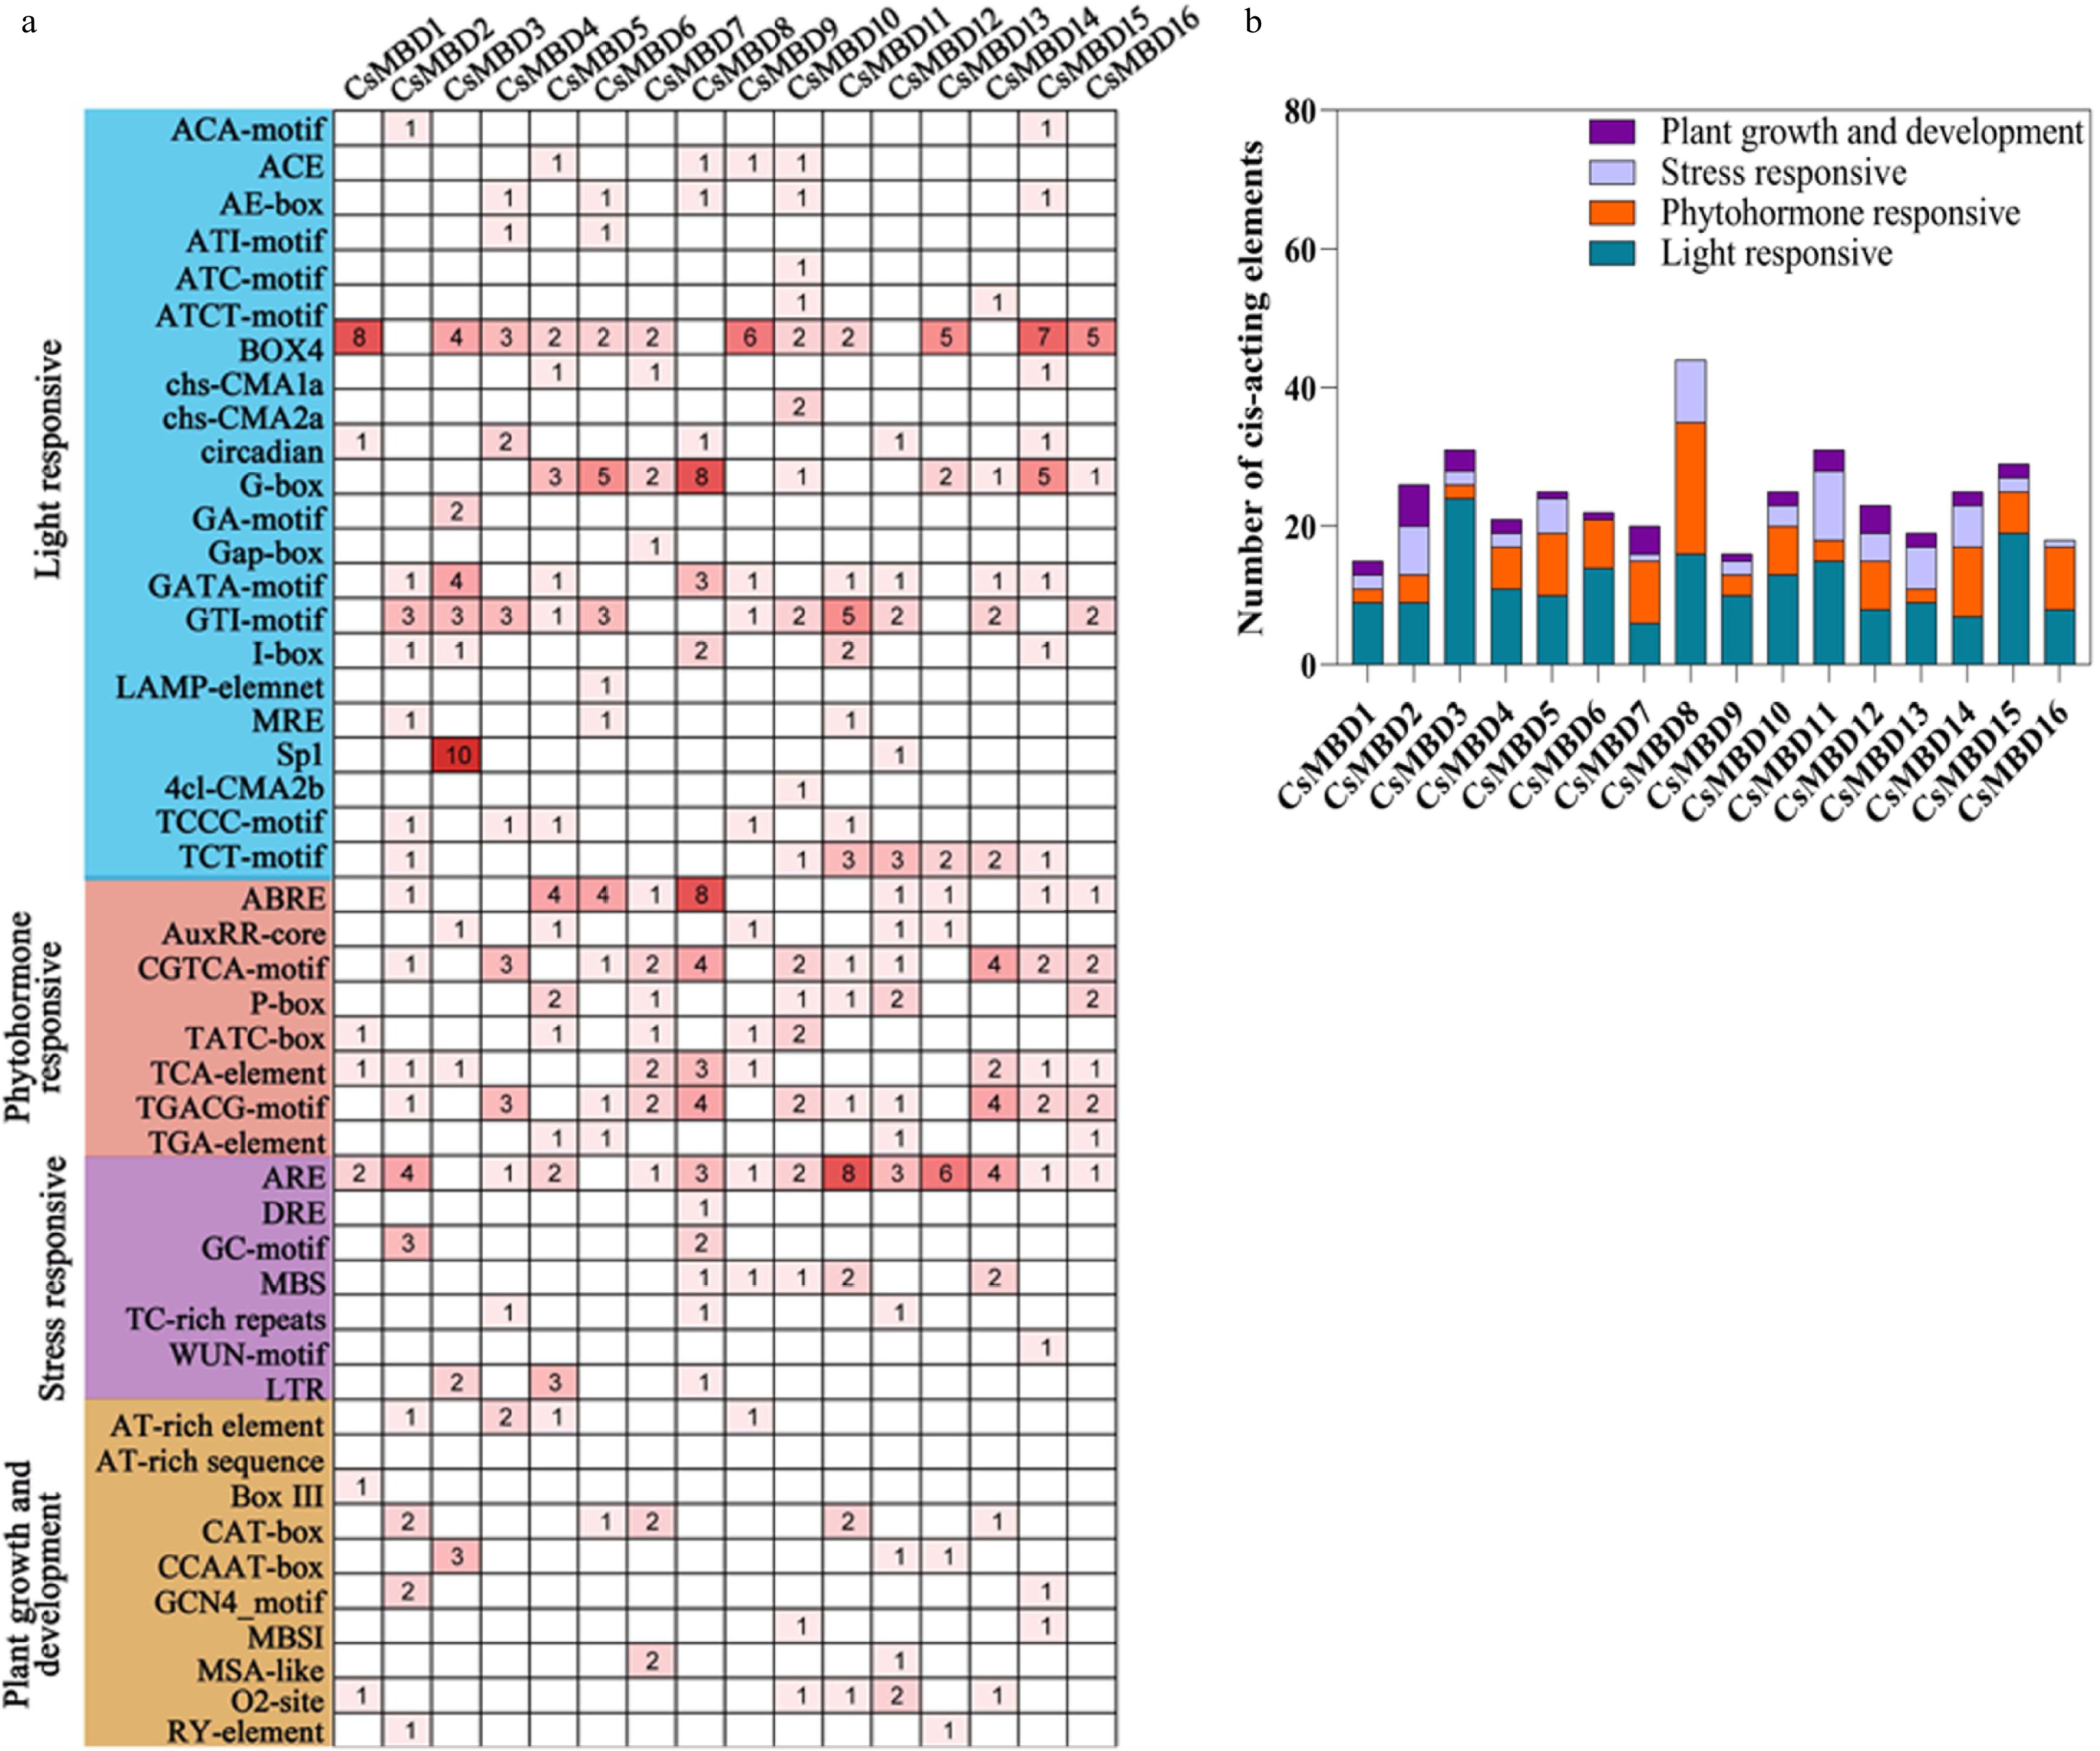
Figure 5. Analysis of cis-acting elements in the promoter region of 16 CsMBD genes. (a) The number of different cis-acting regulatory elements in the promoter region. (b) The histogram of cis-acting elements in four categories.
-
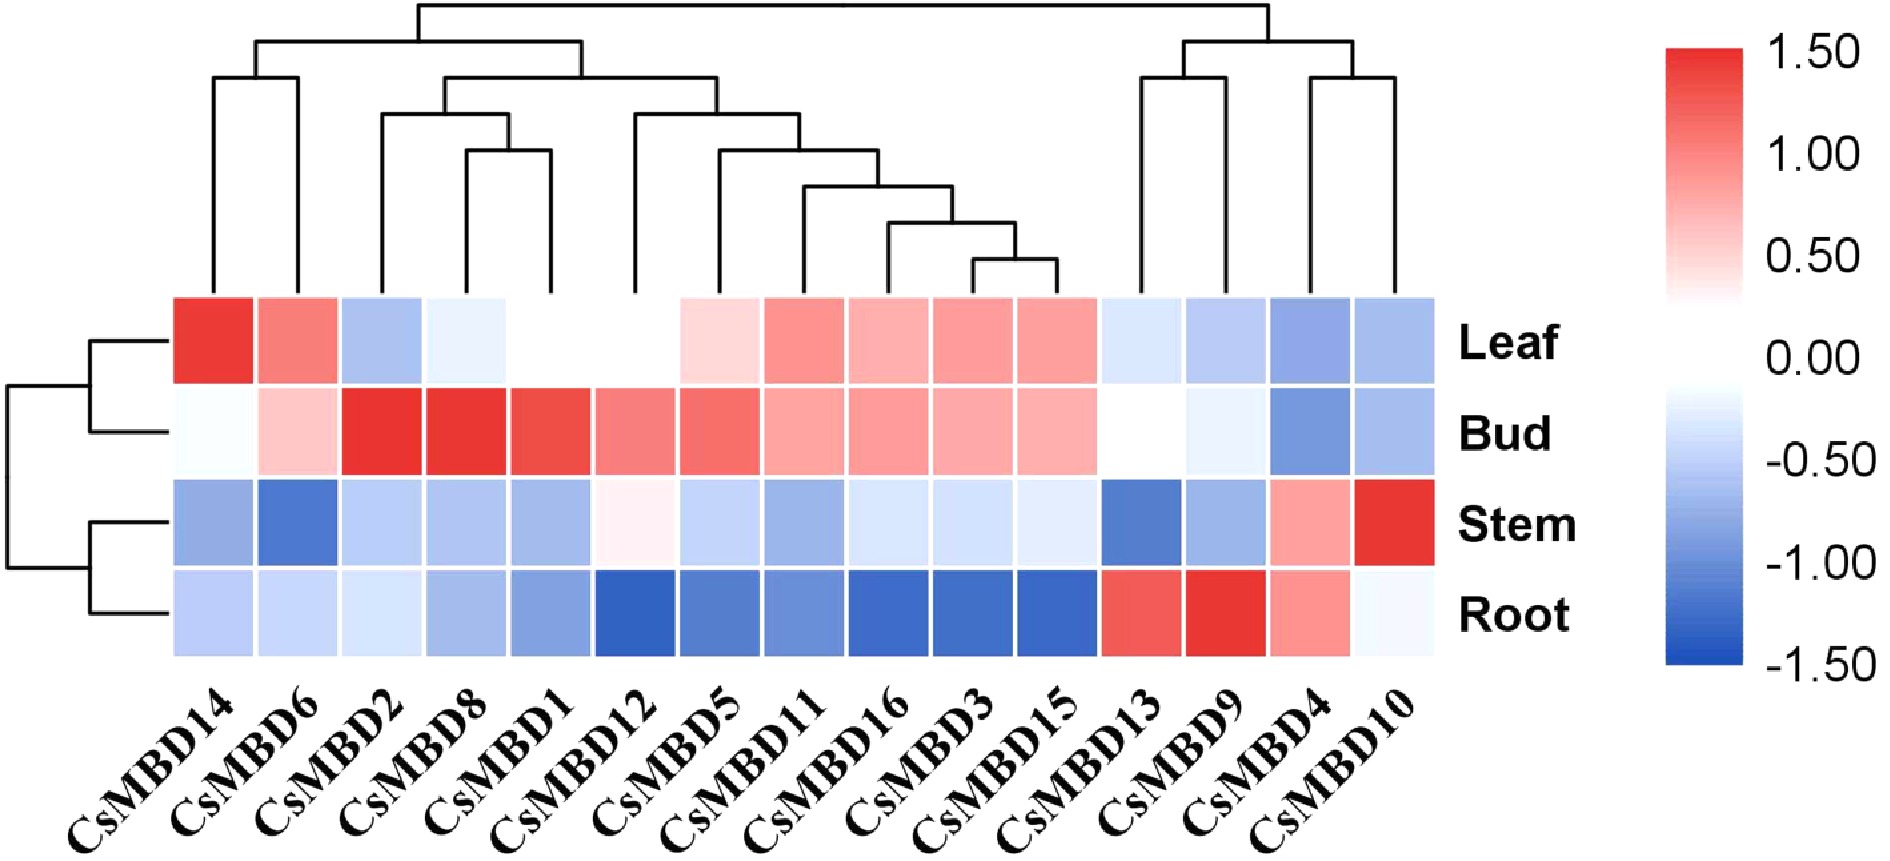
Figure 6. Tissue-specific expression profile clustering of 15 CsMBDs. The colour scale indicates log2 signal values (right); blue and red colours indicate low and high levels of transcript abundance, respectively. The different organs are noted on the right. A cluster dendrogram is shown above.
-

Figure 7. Expression profiles of 15 CsMBD genes under biotic stress treatments in tea plants. The different colours indicate different plant diseases and insect pests. The error bars indicate the standard error of the mean (SEM) from three biological replicates. * Significant differences (p < 0.05), ** highly significant differences (p < 0.01).
-

Figure 8. Relative expression of 15 CsMBD genes under abiotic stresses in tea plants. (a) Cold acclimation; (b) drought stress conditions. The y-axis represents the transcript abundance, and the x-axis represents the stress treatments (days or date). The error bars indicate the standard error of the mean (SEM) from three independent biological replicates. * Significant differences (p < 0.05), ** highly significant differences (p < 0.01).
-
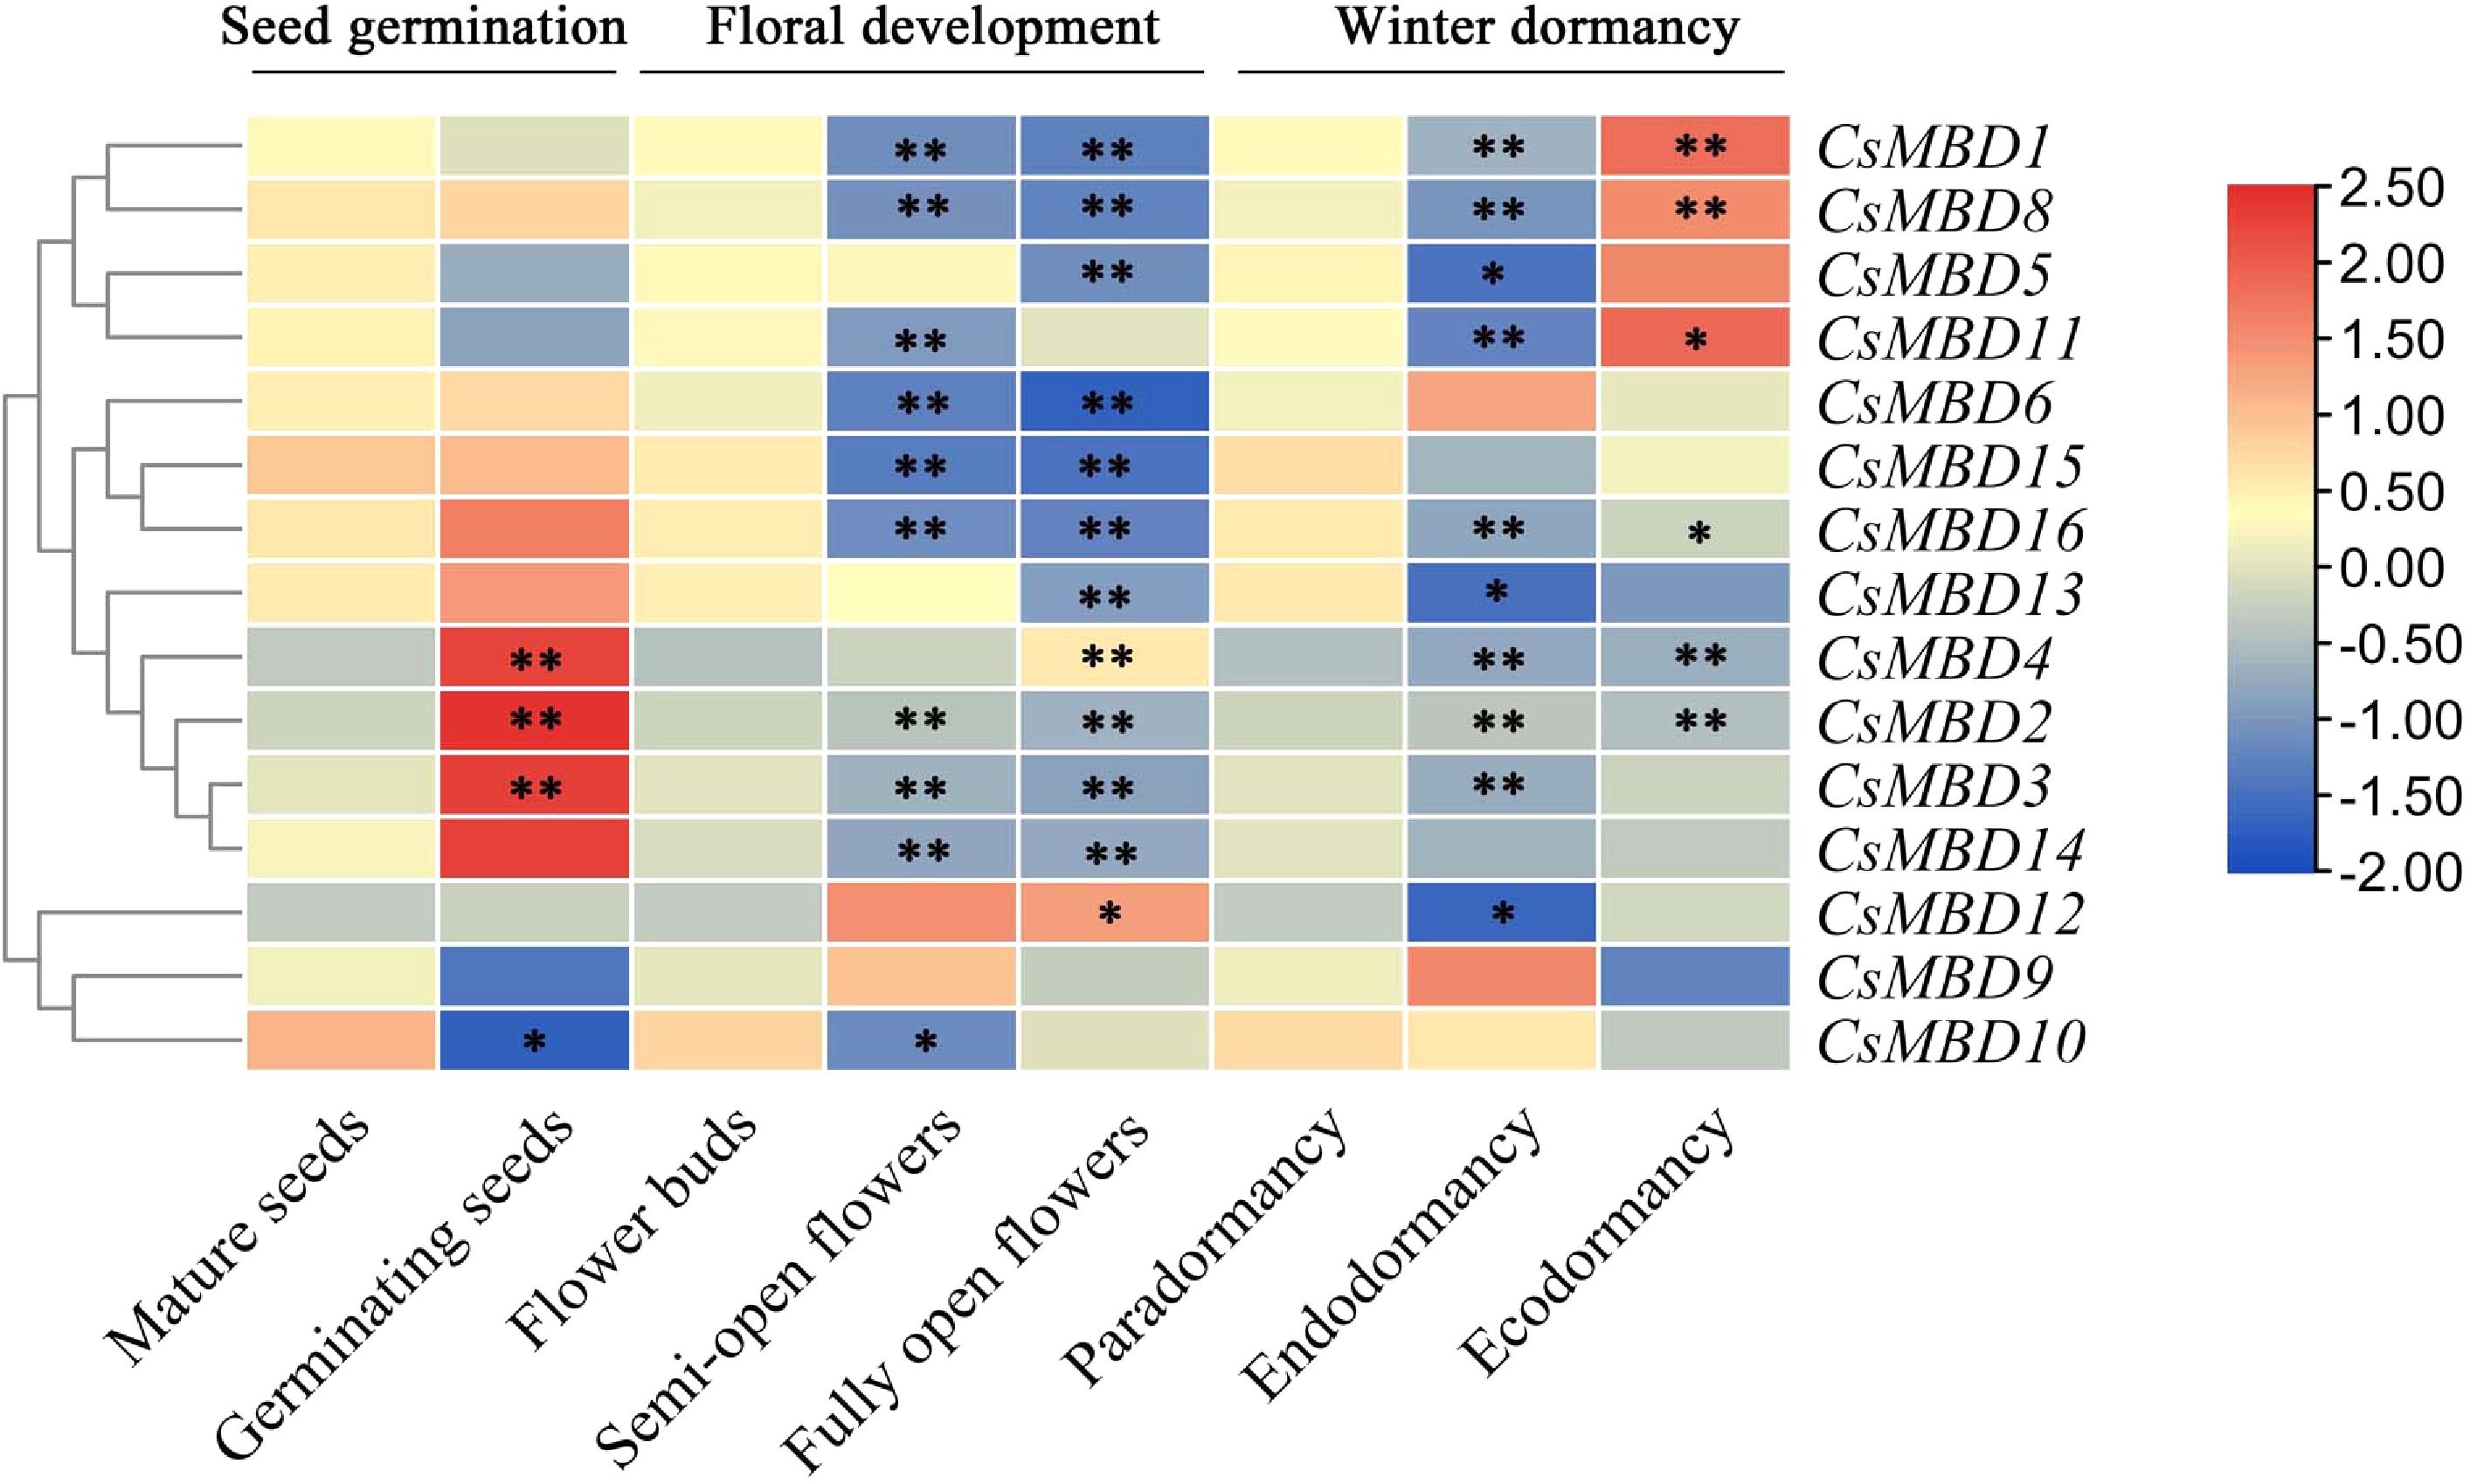
Figure 9. Expression patterns of 15 CsMBD genes during growth and development in tea plants. Including seed germination, floral development and different dormancy stages in tea plants; p < 0.05 was considered significant (*) and p < 0.01 was considered highly significant (**). The colour scale indicates the log2 signal values shown on the right. Red and blue indicate high and low levels of expression, respectively. A cluster dendrogram is shown on the left of the graph.
-
Gene name Genome ID Accession number ORF
(bp)Amino acids (aa) Molecular weight (kDa) Theoretical
pIInstability index GRAVY Subcellular localization CsMBD1 Cha13g006360 MW587685 951 316 35.02 4.61 54.26 −1.275 Nucleus CsMBD2 ChaUn9803.1 MW587686 984 327 36.68 4.79 58.95 −0.689 Nucleus CsMBD3 Cha11g011930 MW587687 624 207 23.37 7.55 48.43 −0.780 Nucleus CsMBD4 Cha13g000660 MW587688 564 187 22.30 4.76 46.09 −0.971 Nucleus CsMBD5 Cha11g002910 MW587689 750 248 27.52 5.58 45.25 −0.919 Nucleus CsMBD6 Cha11g006220 MW587690 387 128 14.31 8.73 50.12 −0.834 Nucleus CsMBD7 Cha12g008120 OK020039 543 180 21.45 8.62 43.23 −0.756 Nucleus CsMBD8 Cha08g002560 MW587691 1,011 336 36.19 8.38 31.07 −0.519 Nucleus CsMBD9 Cha01g024050 MZ962382 3,957 1,317 142.71 5.53 43.59 −0.169 Nucleus CsMBD10 Cha06g012040 MW587692 873 290 32.03 5.00 45.76 −1.272 Nucleus CsMBD11 Cha03g006980 MW587693 1,206 401 44.33 4.54 50.83 −1.286 Nucleus CsMBD12 Cha14g013440 MW587694 1,248 415 45.48 5.42 47.54 −1.130 Nucleus CsMBD13 Cha12g001750 MW587695 2,535 844 93.89 9.29 47.82 −0.891 Nucleus CsMBD14 Cha14g007750 MW587696 3,174 1,057 118.88 5.94 51.92 −0.427 Nucleus CsMBD15 Cha11g005780 MW587697 906 301 33.79 8.69 50.54 −0.603 Nucleus CsMBD16 Cha04g016420 MW587698 900 299 33.45 7.73 42.19 −0.430 Nucleus Table 1. Basic characteristic of MBD genes identified in tea plants.
Figures
(9)
Tables
(1)