-

Figure 1. Ocimum kilimandscharium plants.
-

Figure 2. Microscopic view of Aspergillus flavus from maize grains (×40 magnification).
-

Figure 3. Pathogenicity test of Aspergillus flavus on maize grains.
-

Figure 4. Amended PDA plates with varied concentration of Ocimum kilimandscharicum oil showing Aspergillus flavus colony.
-

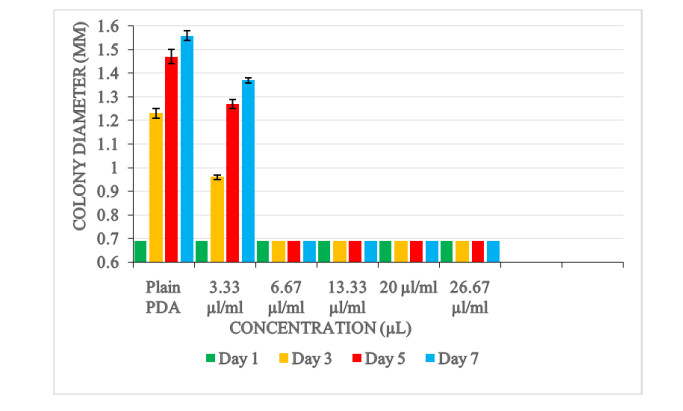
Figure 5. Interaction effects of concentration of Ocimum kilimandscharicum oil and days of incubation on colony diameter.
-

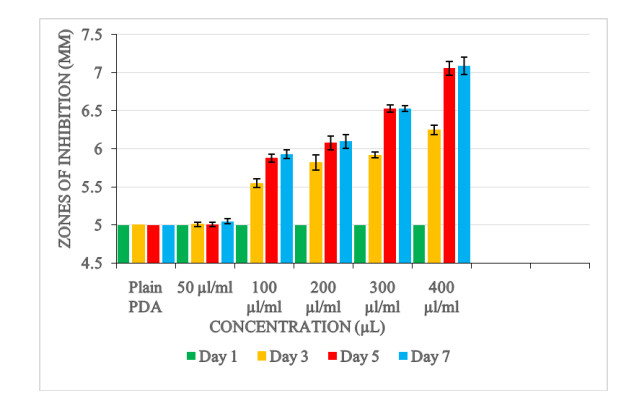
Figure 6. Interactive effects of concentration of Ocimum kilimandscharicum oil and days of incubation on size of zones of inhibition.
-
Mean Colony diameter (mm) Concentration (μl/ml) Plain PDA (control) 1.36±0.05a 3.33 1.17±0.30b 6.67 0.79±0.001c 13.33 0.79±0.001c 20 0.79±0.001c 26.67 0.79±0.001c Days Day 1 0.79±0.001d Day 3 0.85±0.20c Day 5 0.91±0.50b Day 7 0.93±0.60a P-values Concentration 0.0001 Day 0.0001 Concentration*Day 0.0001 Values expressed a r e means ± SEM for four replicates. Means within respect columns accompanied by similar lower-case letters do not differ significantly at P < 0.0001 Table 1. Mean colony diameter (in millimetres) of A. flavus on PDA amended with different concentration of O. kilimandscharicum oil
-
Size of zone of inhibition Concentration (μl/ml) Plain PDA (control) 5.00±0.00f 50 5.06±0.01e 100 5.58±0.09d 200 5.76±0.12c 300 5.98±0.16b 400 6.34±0.22a Days Day 1 5.00±0.00c Day 3 5.74±0.09b Day 5 6.11±0.15a Day 7 6.14±0.16a P-values Concentration 0.0001 Day 0.0001 Concentration*Day 0.0001 Values expressed are means ± SEM for four replicates. Means within respect columns accompanied by similar lower-case letters do not differ significantly at P <0.0001 by Tukey's HSD test. Table 2. Mean zone of inhibition (mm) of Aspergillus flavus culture grown on filter paper discs impregnated with Ocimum kilimandscharicum oil
Figures
(6)
Tables
(2)