-

Figure 1. Percent mass loss (a) and density (b) of wood and bark at final (42 month) harvest. Bars are standard error of the mean. Statistics are from a two-way ANOVA, degrees of freedom 1,16 for both resource and beetle. The interaction between resource and beetle was not significant (F(1,16) = 0.01, P = 0.9361).
-

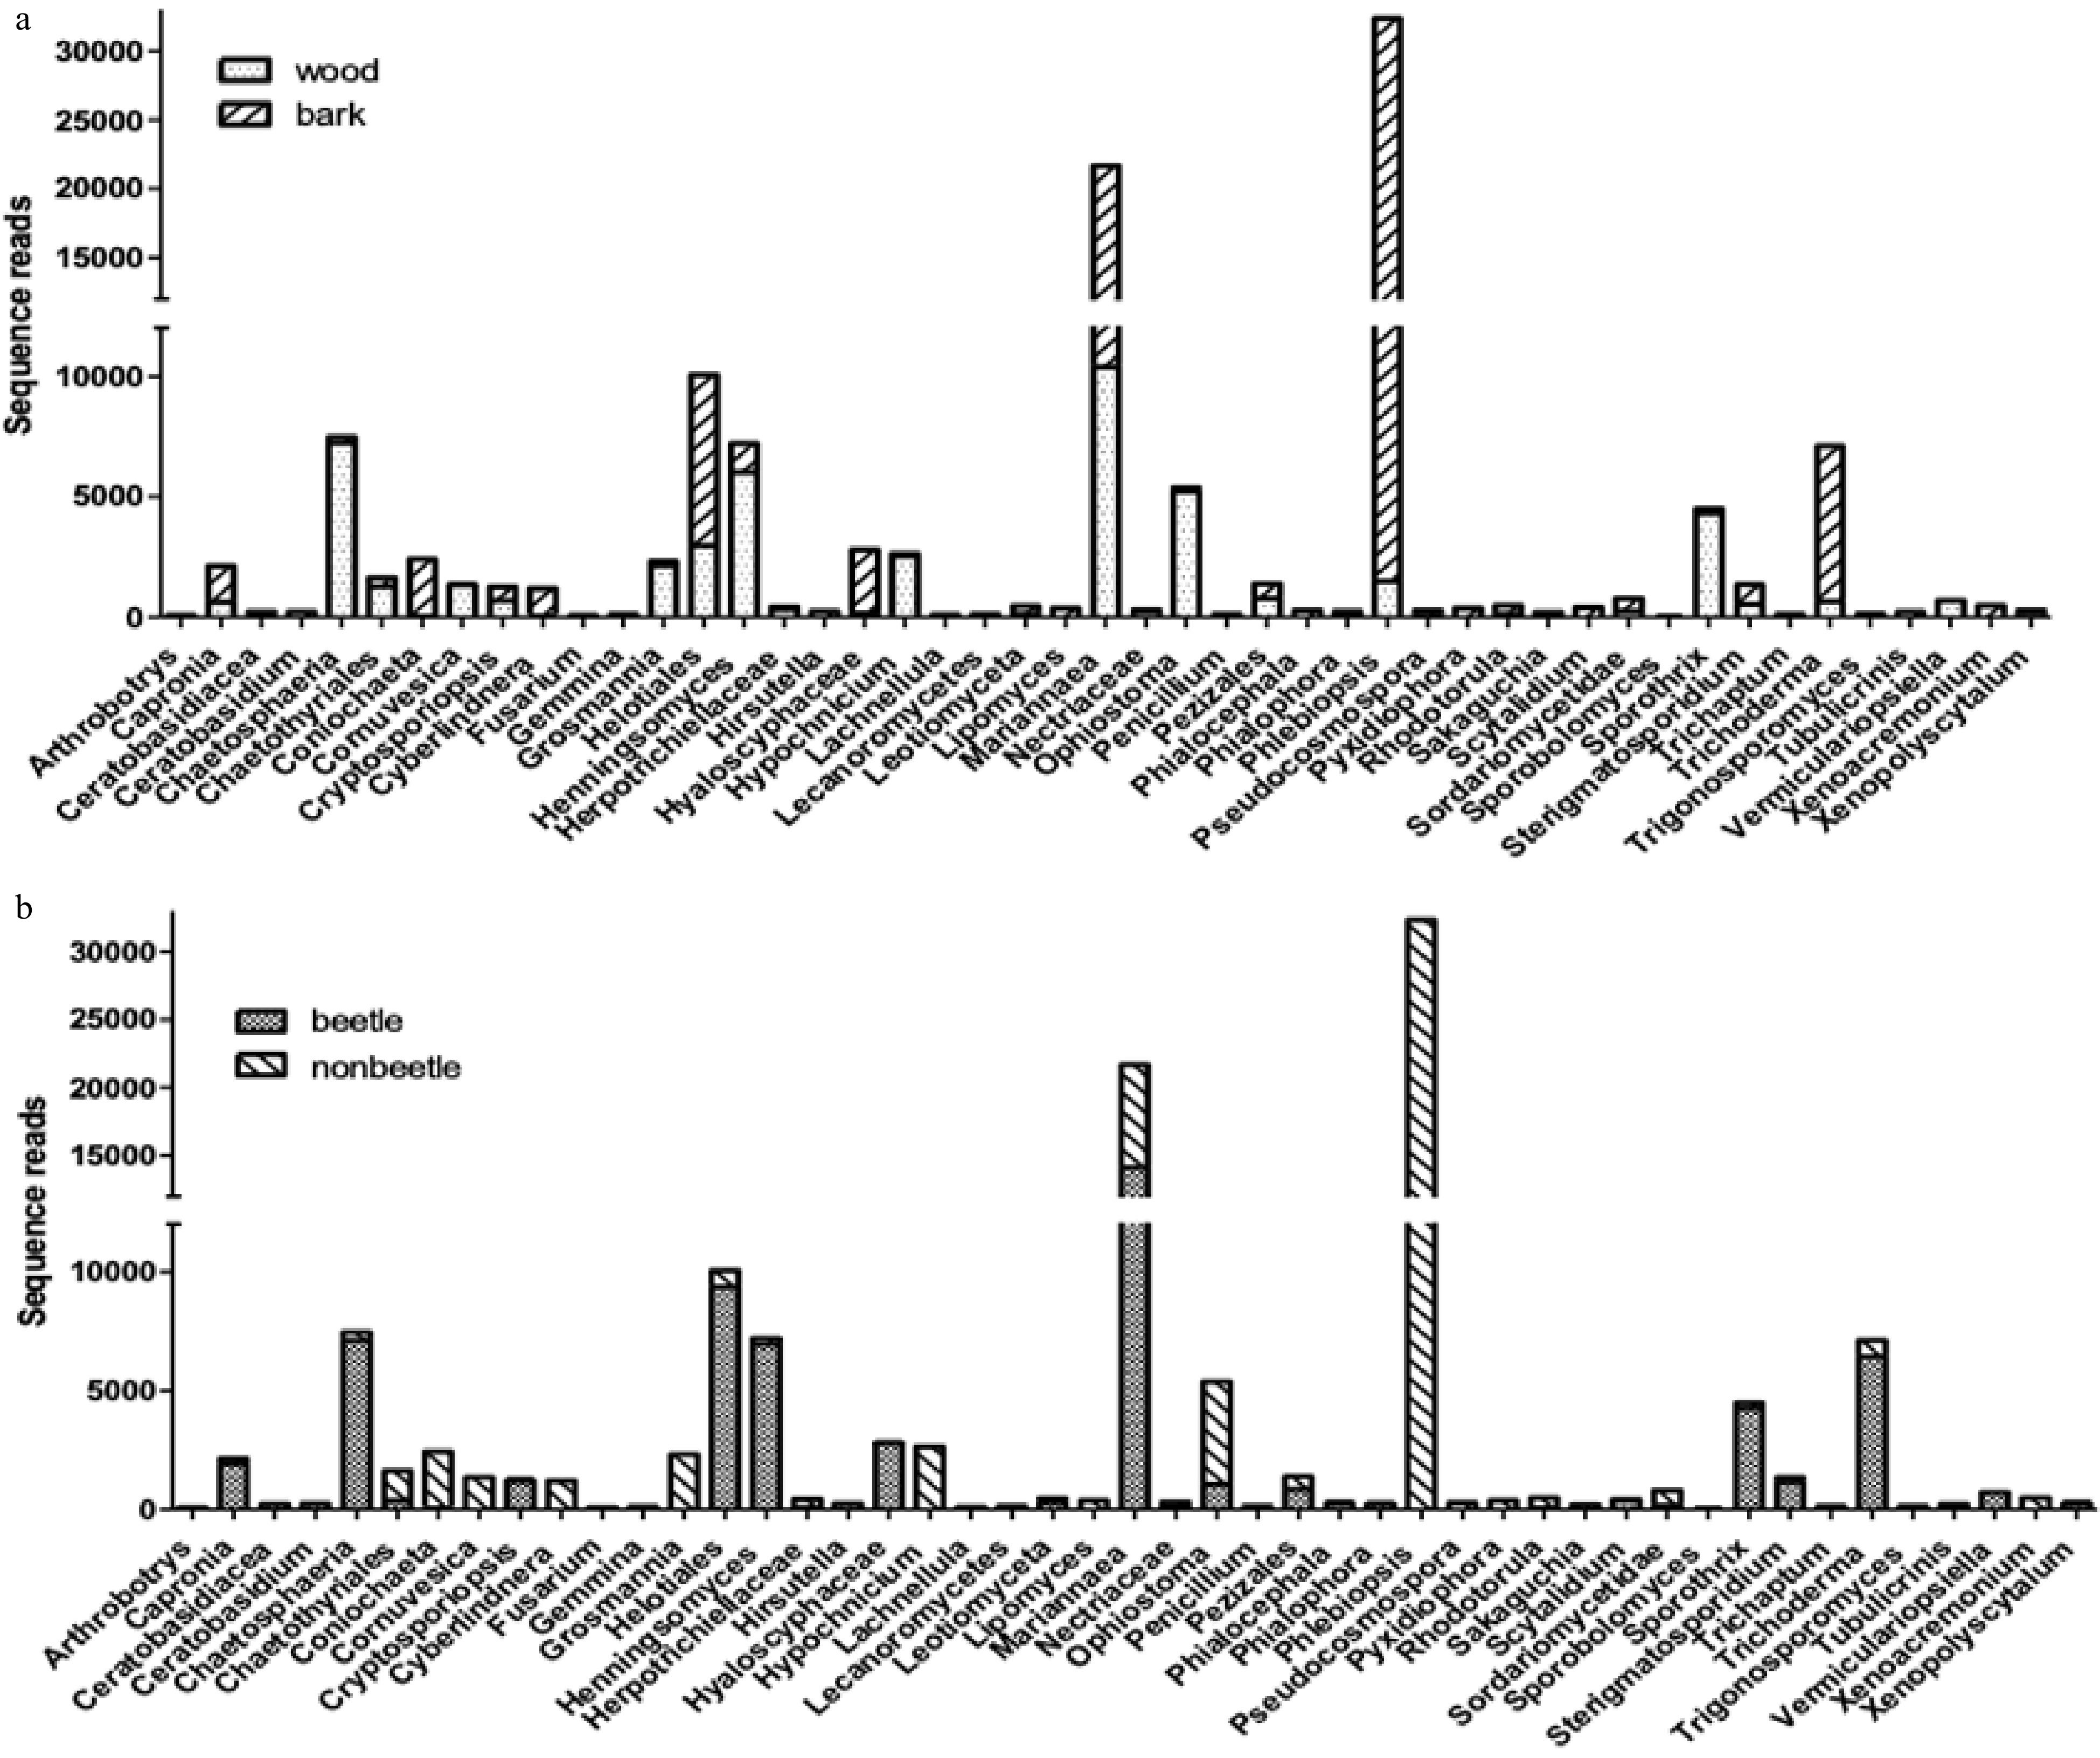
Figure 2. Sequence reads of fungal taxa showing significant differences (ANOVA at P < 0.01) between resource types (a) and between SPB infested and uninfested resources (b) in samples prior to incubation in litter bags in the field.
-

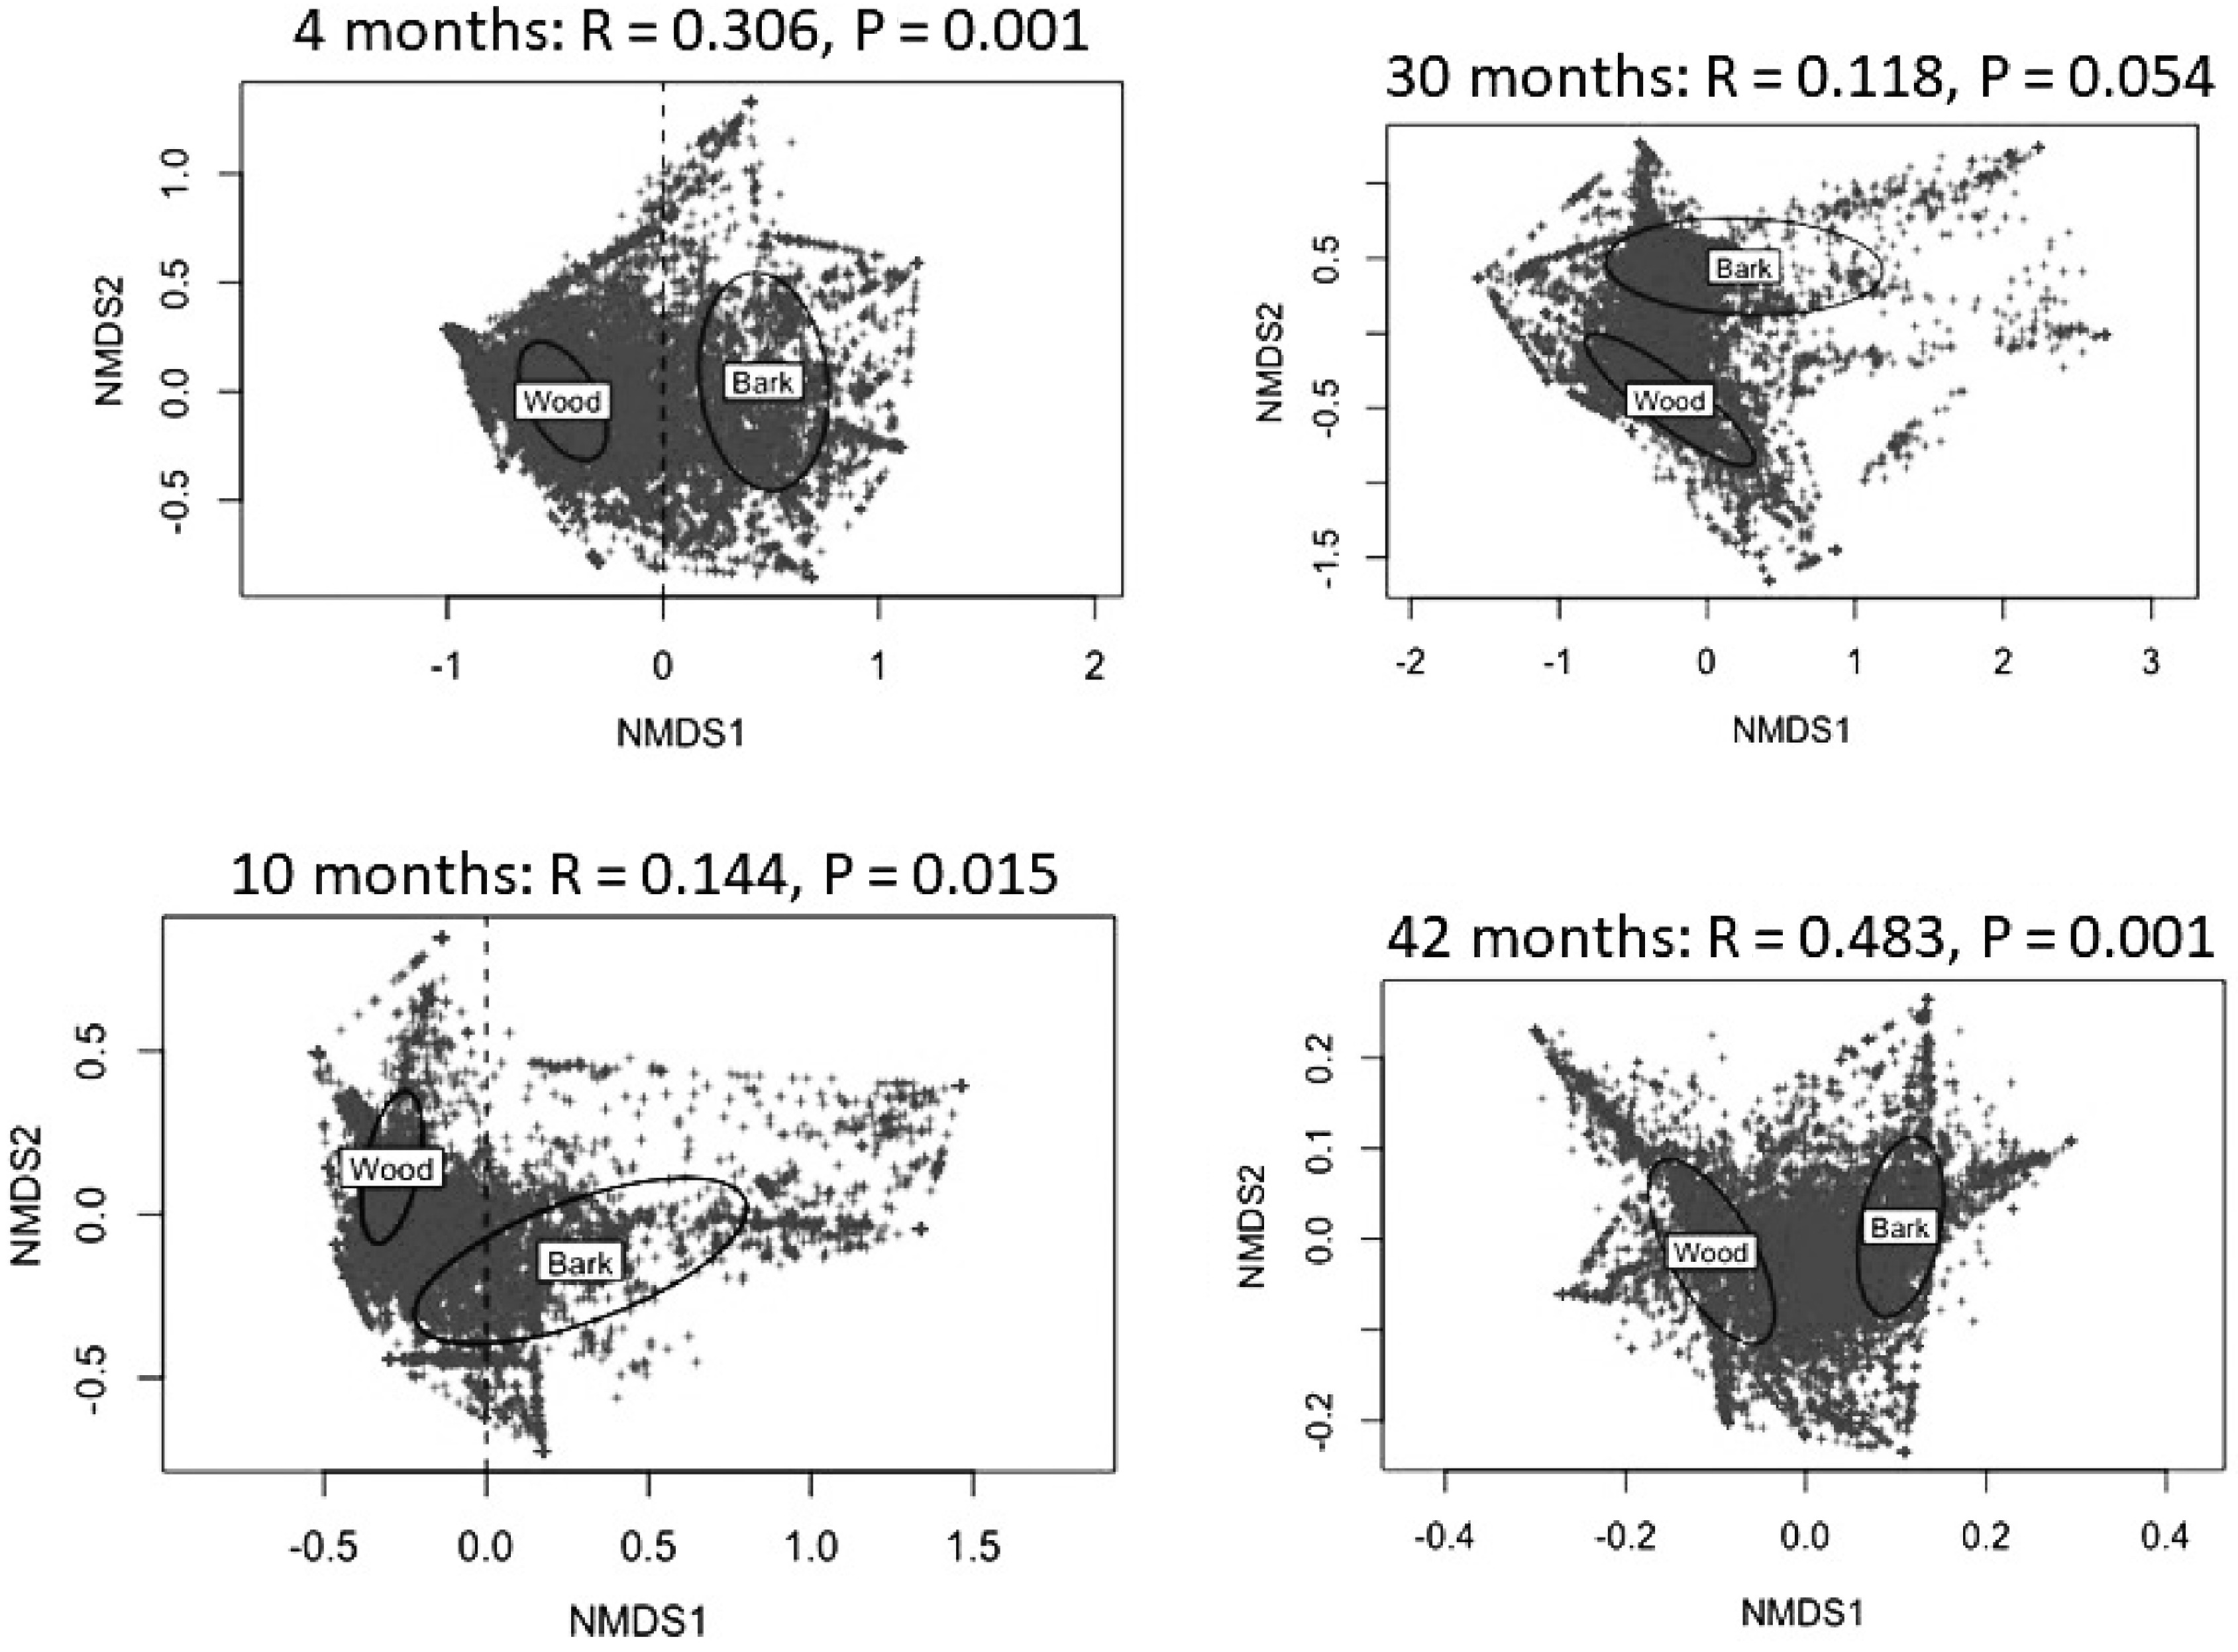
Figure 3. Differences in fungal community composition between wood and bark as visualized in a non-metric multidimensional scaling (NMDS) analysis for each sampling time. There were no significant differences in communities between beetle infested and uninfested resources.
-

Figure 4. Fungal OTU community richness and diversity in wood and bark at 4 (a) and 42 (b) months of field incubation. Bars are standard errors of means. There were no significant differences between resources at intermediate harvest times. Analysis by two-way ANOVA with degrees of freedom as 1,16.
-

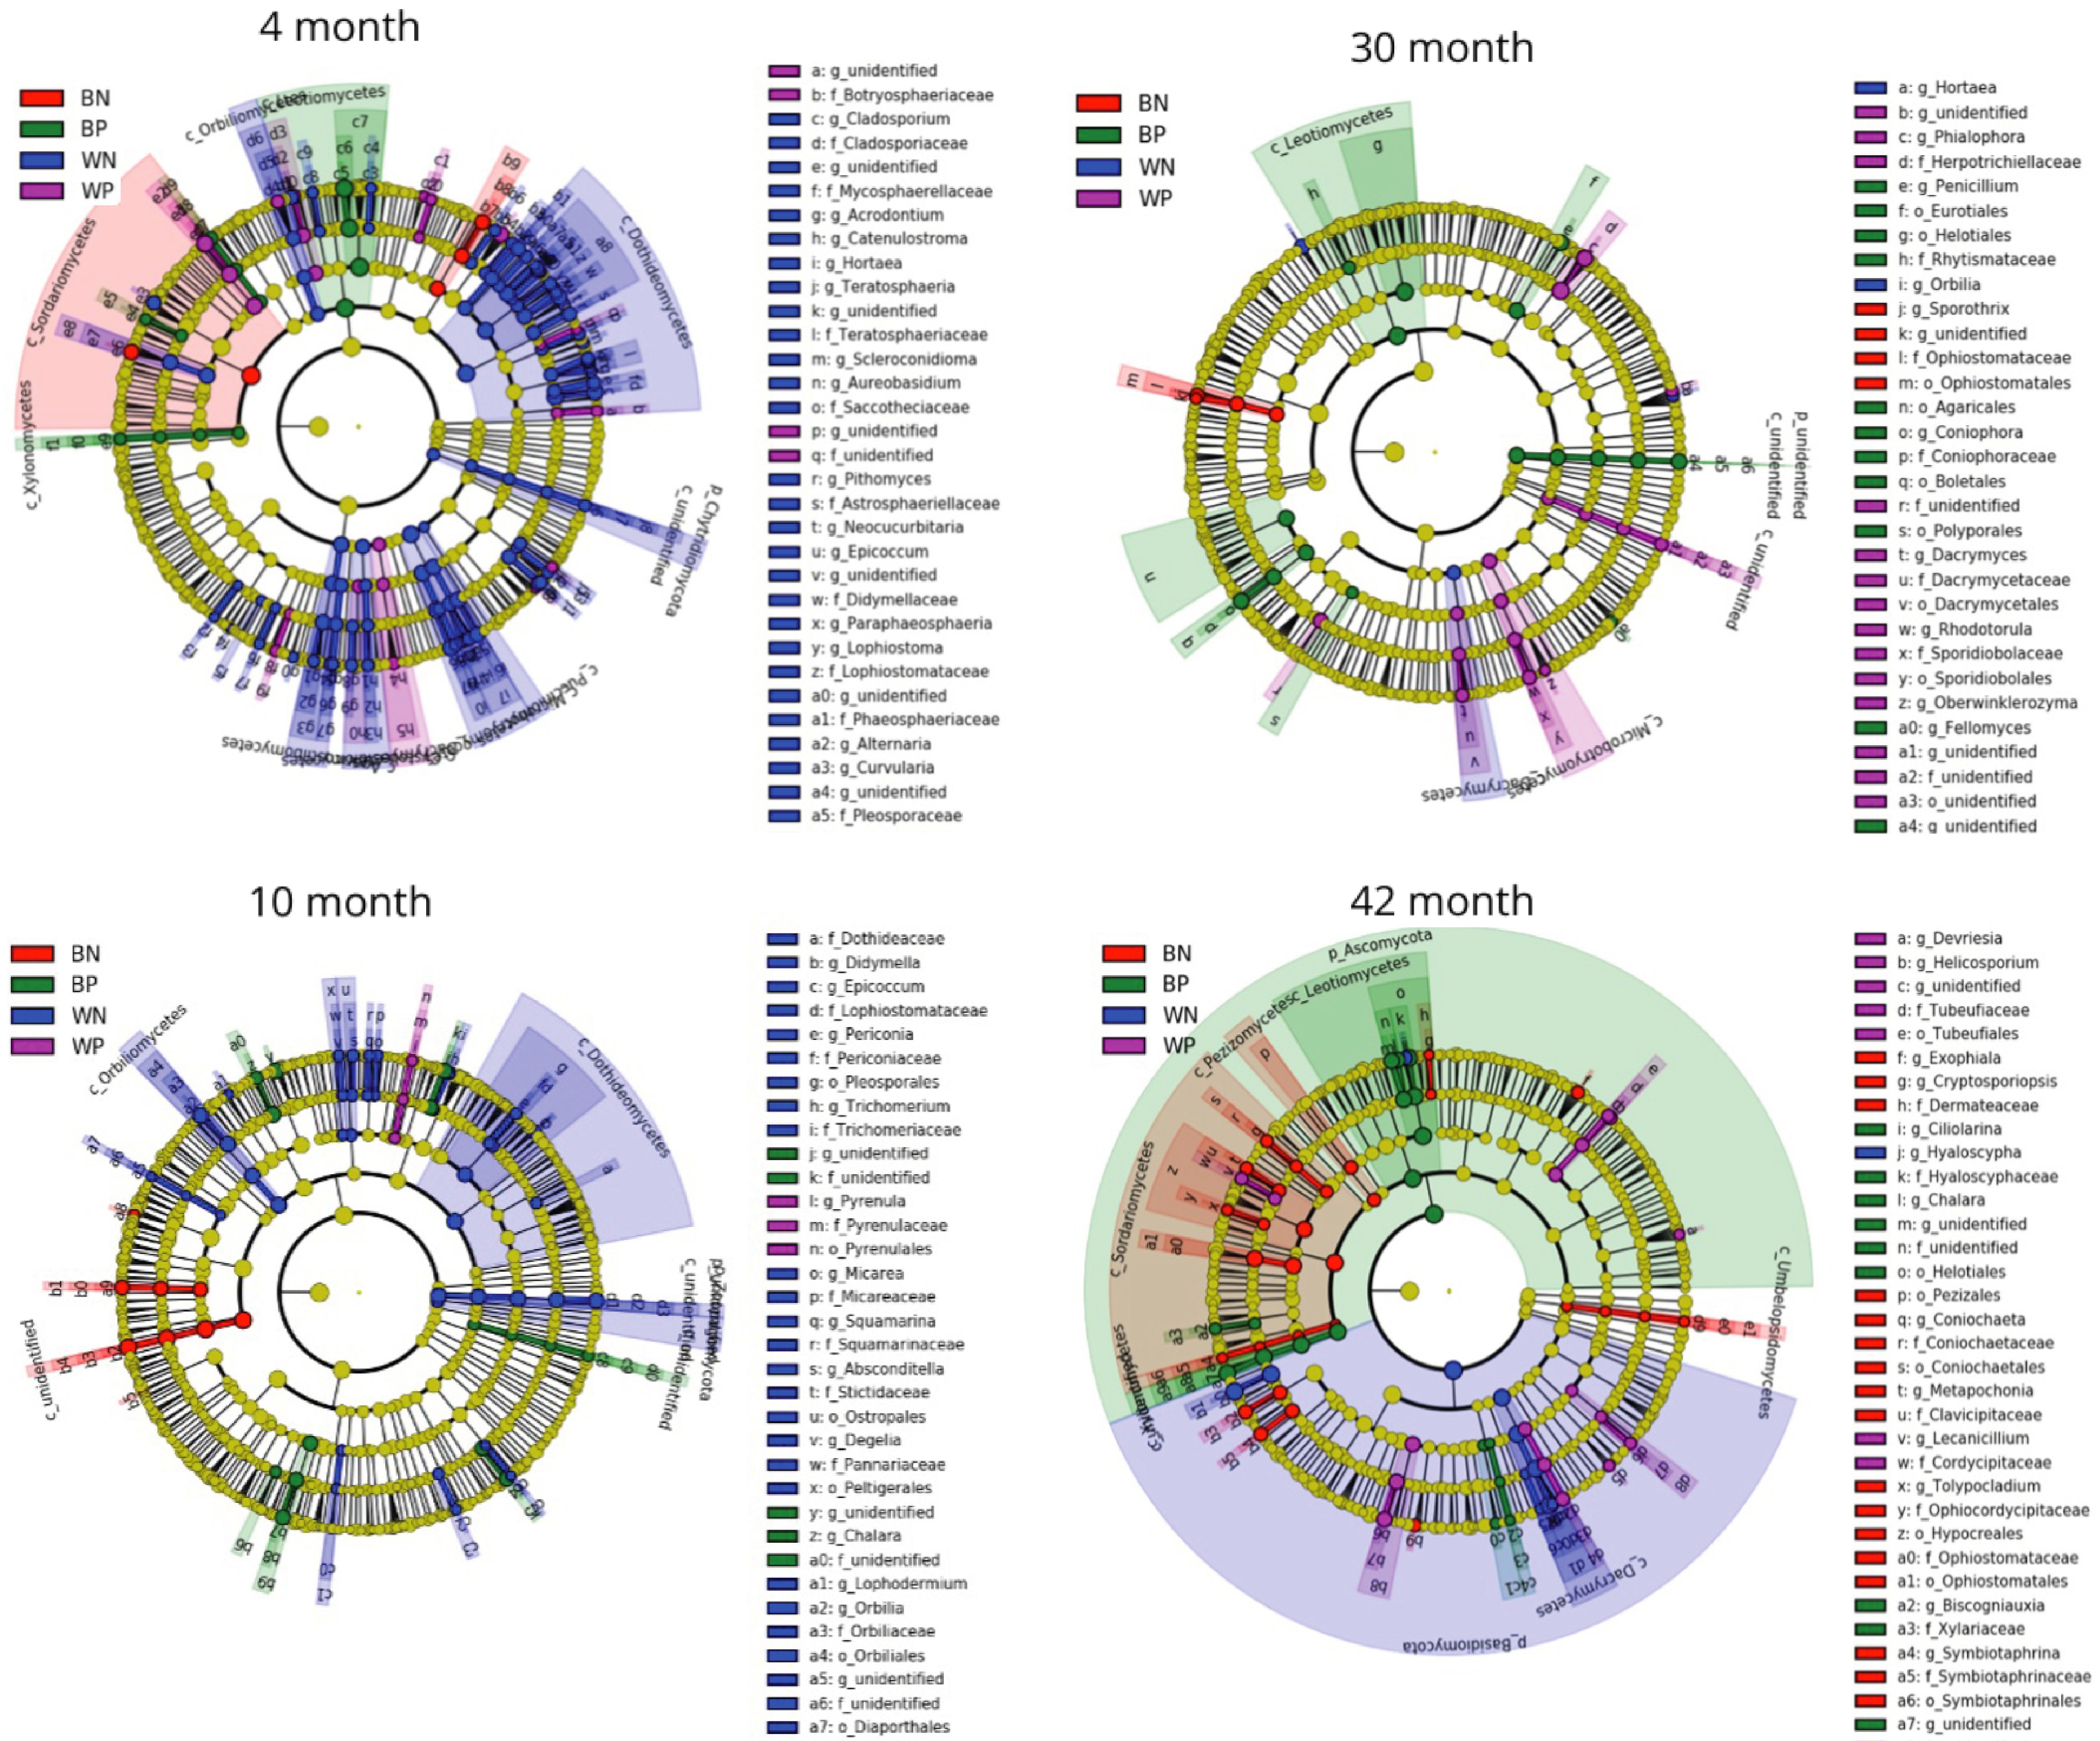
Figure 5. Cladograms of fungal taxa (highlighted by small circles and by shading) showing differences in abundance values (according to LEfSe) in the four classes BN (uninfested bark), BB (beetle infested bark), WN (uninfested wood) and WB (beetle infested wood) for each of the sampling times.
-
Wood Bark Beetle Non-beetle 4 month 80 6 8 50 10 month 23 14 5 6 30 month 17 14 3 26 42 month 15 12 3 5 Table 1. Number of fungal OTU taxa with significantly higher (α = 0.1) total sequence reads between resource types and between beetle and non-beetle resources.
-
Asco:Basidio ratio Asco:Basidio ratio Time (mo) Mean SEM Resource Mean SEM 4 156.02 A 61.90 Bark 113.9 A 24.65 10 2.33 B 0.764 Wood 35.81 B 5.40 30 71.35 AB 14.98 42 69.83 AB 29.48 Table 2. Ratio of total ascomycete to basidiomycete reads between resources over time. There was no significant difference in this ratio between beetle infested and uninfested resources. Superscripts within columns indicate significant differences between means with Time (F = 3.37, P = 0.0239) and Resource (F = 5.19, P = 0.0261).
Figures
(5)
Tables
(2)