-

Figure 1. Mean dry mass of litterfall from leaves (L) and reproductive organs (R) averaged at the individual level from 2004 to 2009 at the (a) 900 m and (b) 1500 m sites (n = 5−13).
-
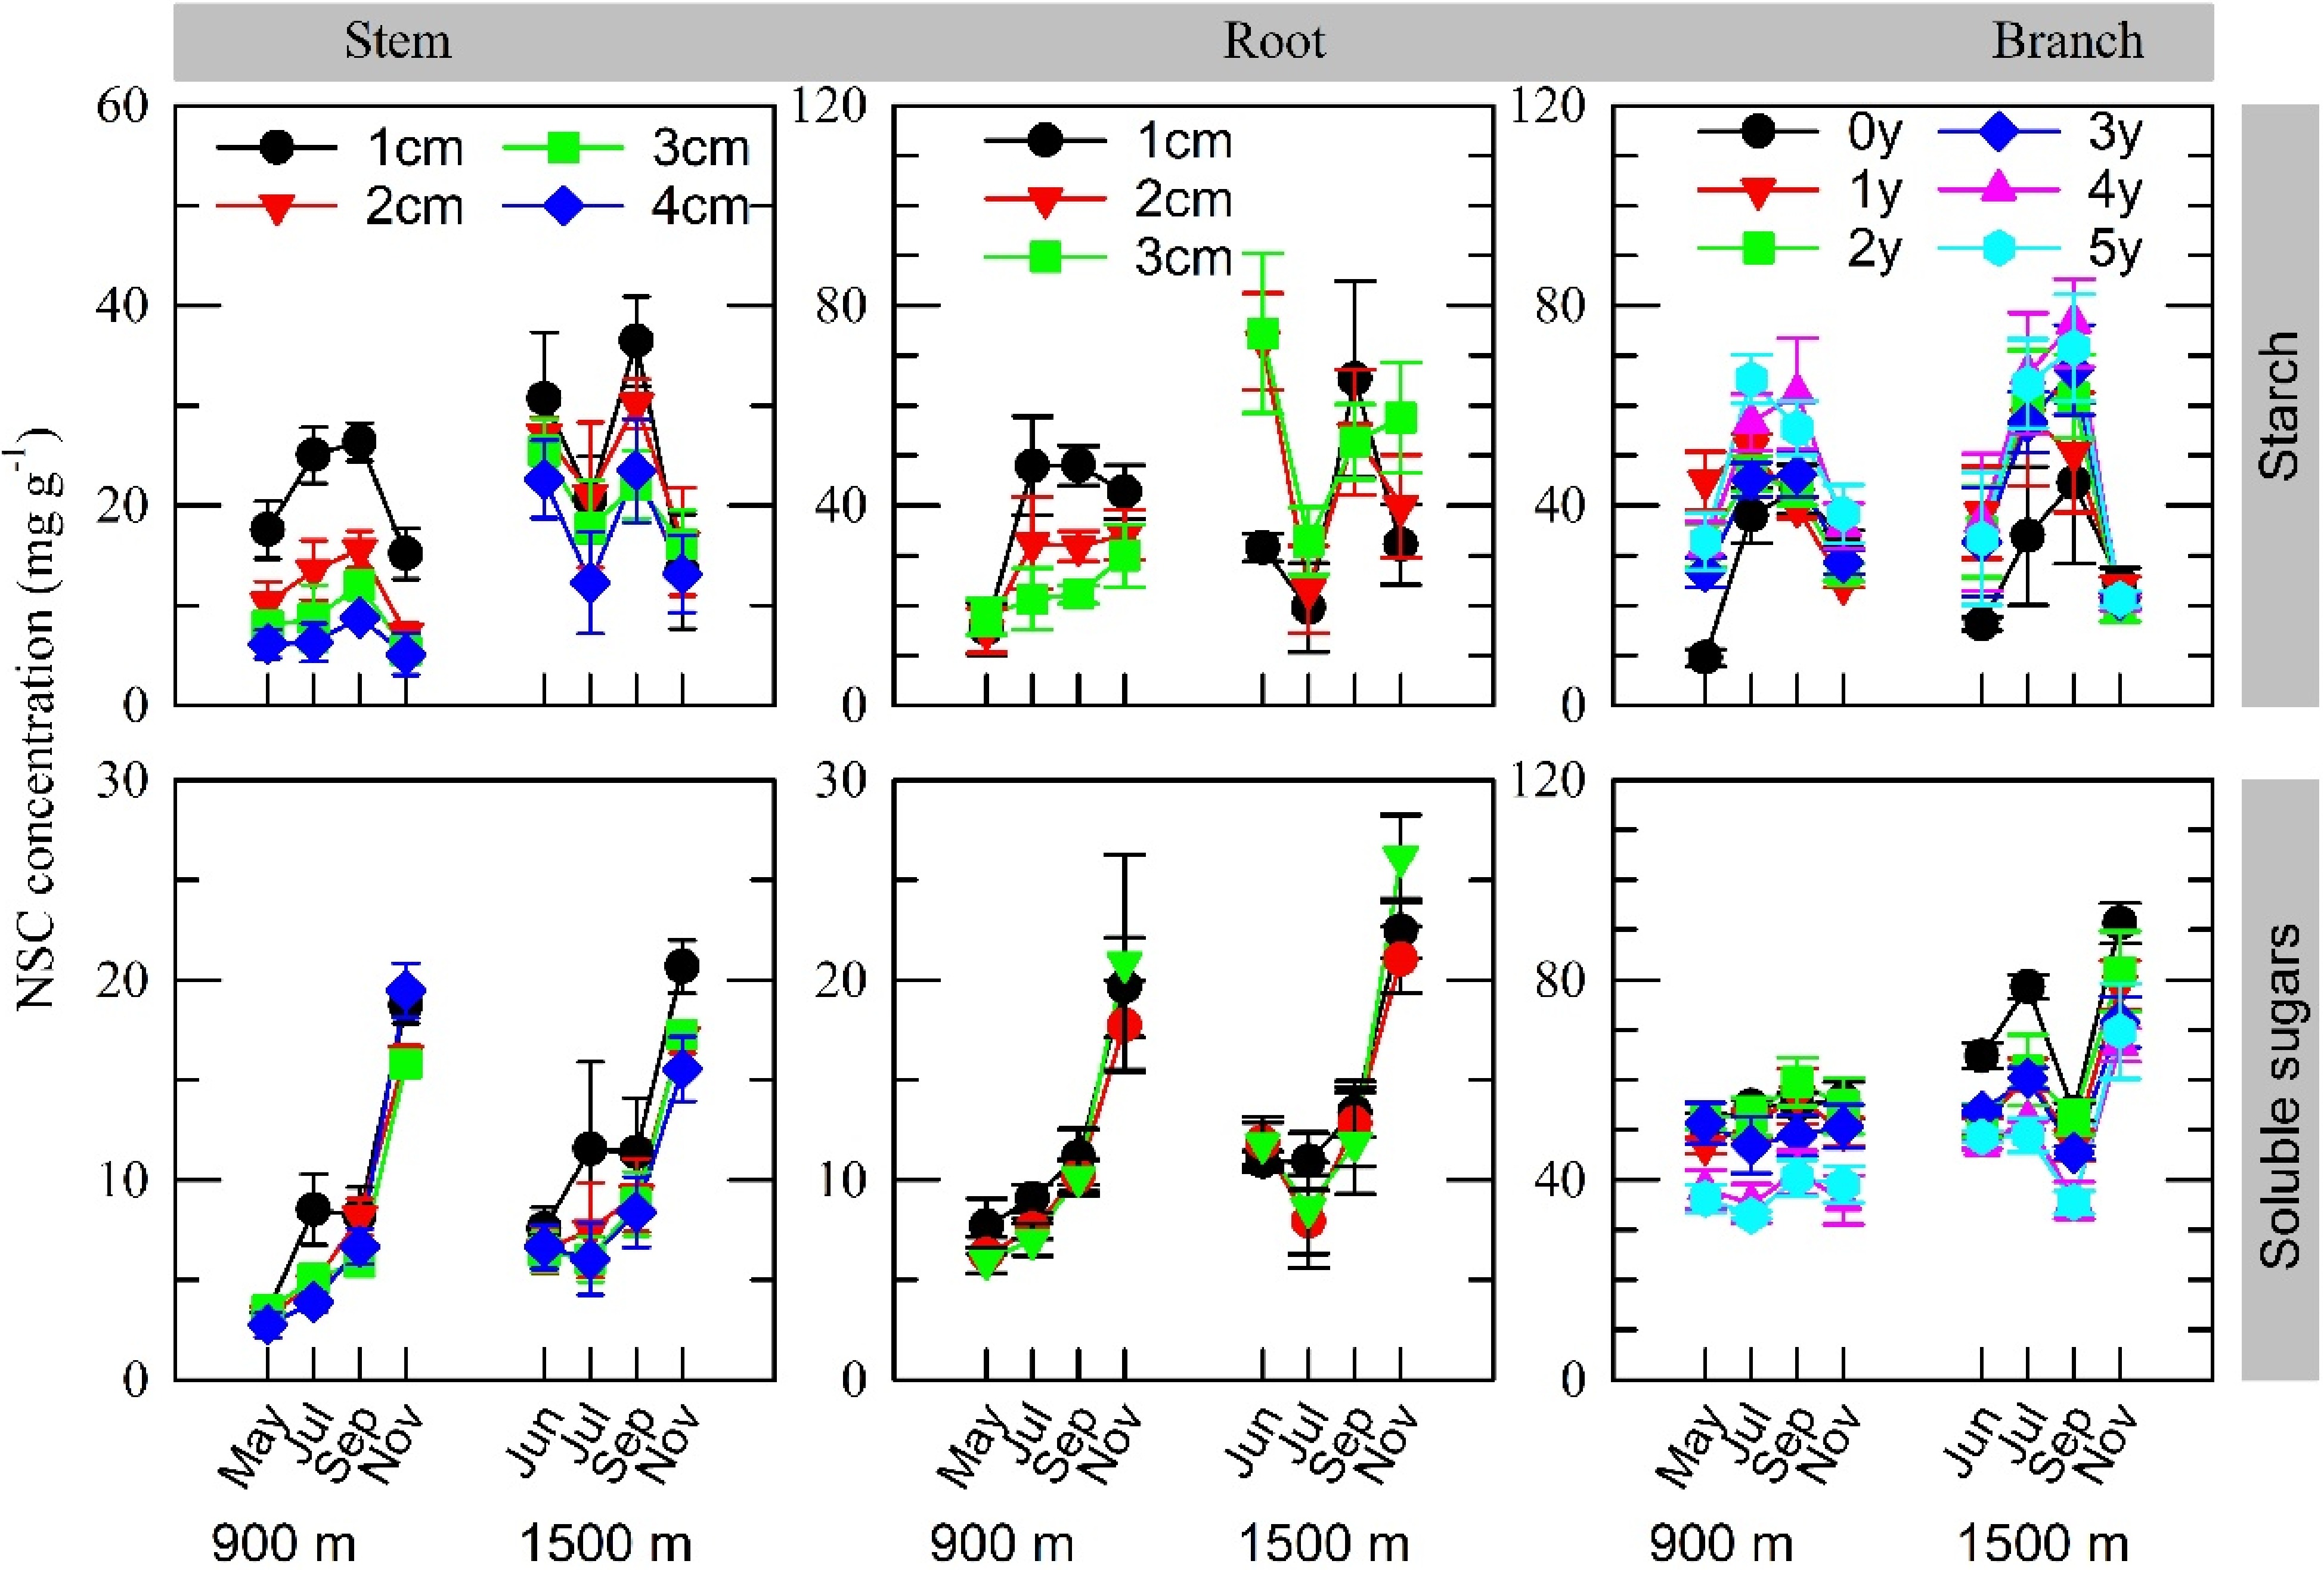
Figure 2. Variations in organ starch and soluble sugar concentrations for different twig ages, stem and root cores of different depths starting from the cambium at the 900 m and 1500 m sites in 2007, a year with moderate fruiting at the 1500 m site only. Values represent the mean ± SE for 3−5 individuals. The results of statistical analysis are shown in Table 1.
-

Figure 3. Seasonal fluctuations in organ concentrations of soluble sugars (SS), starch (ST), and the sum of both (NSC) from the branches, stems and roots at the 900 m and 1500 m sites. Values represent the mean ± SE of all branch ages or core depths for 3−5 individuals. In each graph, different capital or small letters indicate different coefficients estimated in the simplified model in Supplemental Table S2 for the 900 m and 1500 m sites, respectively. In the graphs without capital letters, parameter estimations were conducted across the two sites because the interaction terms were negligible.
-
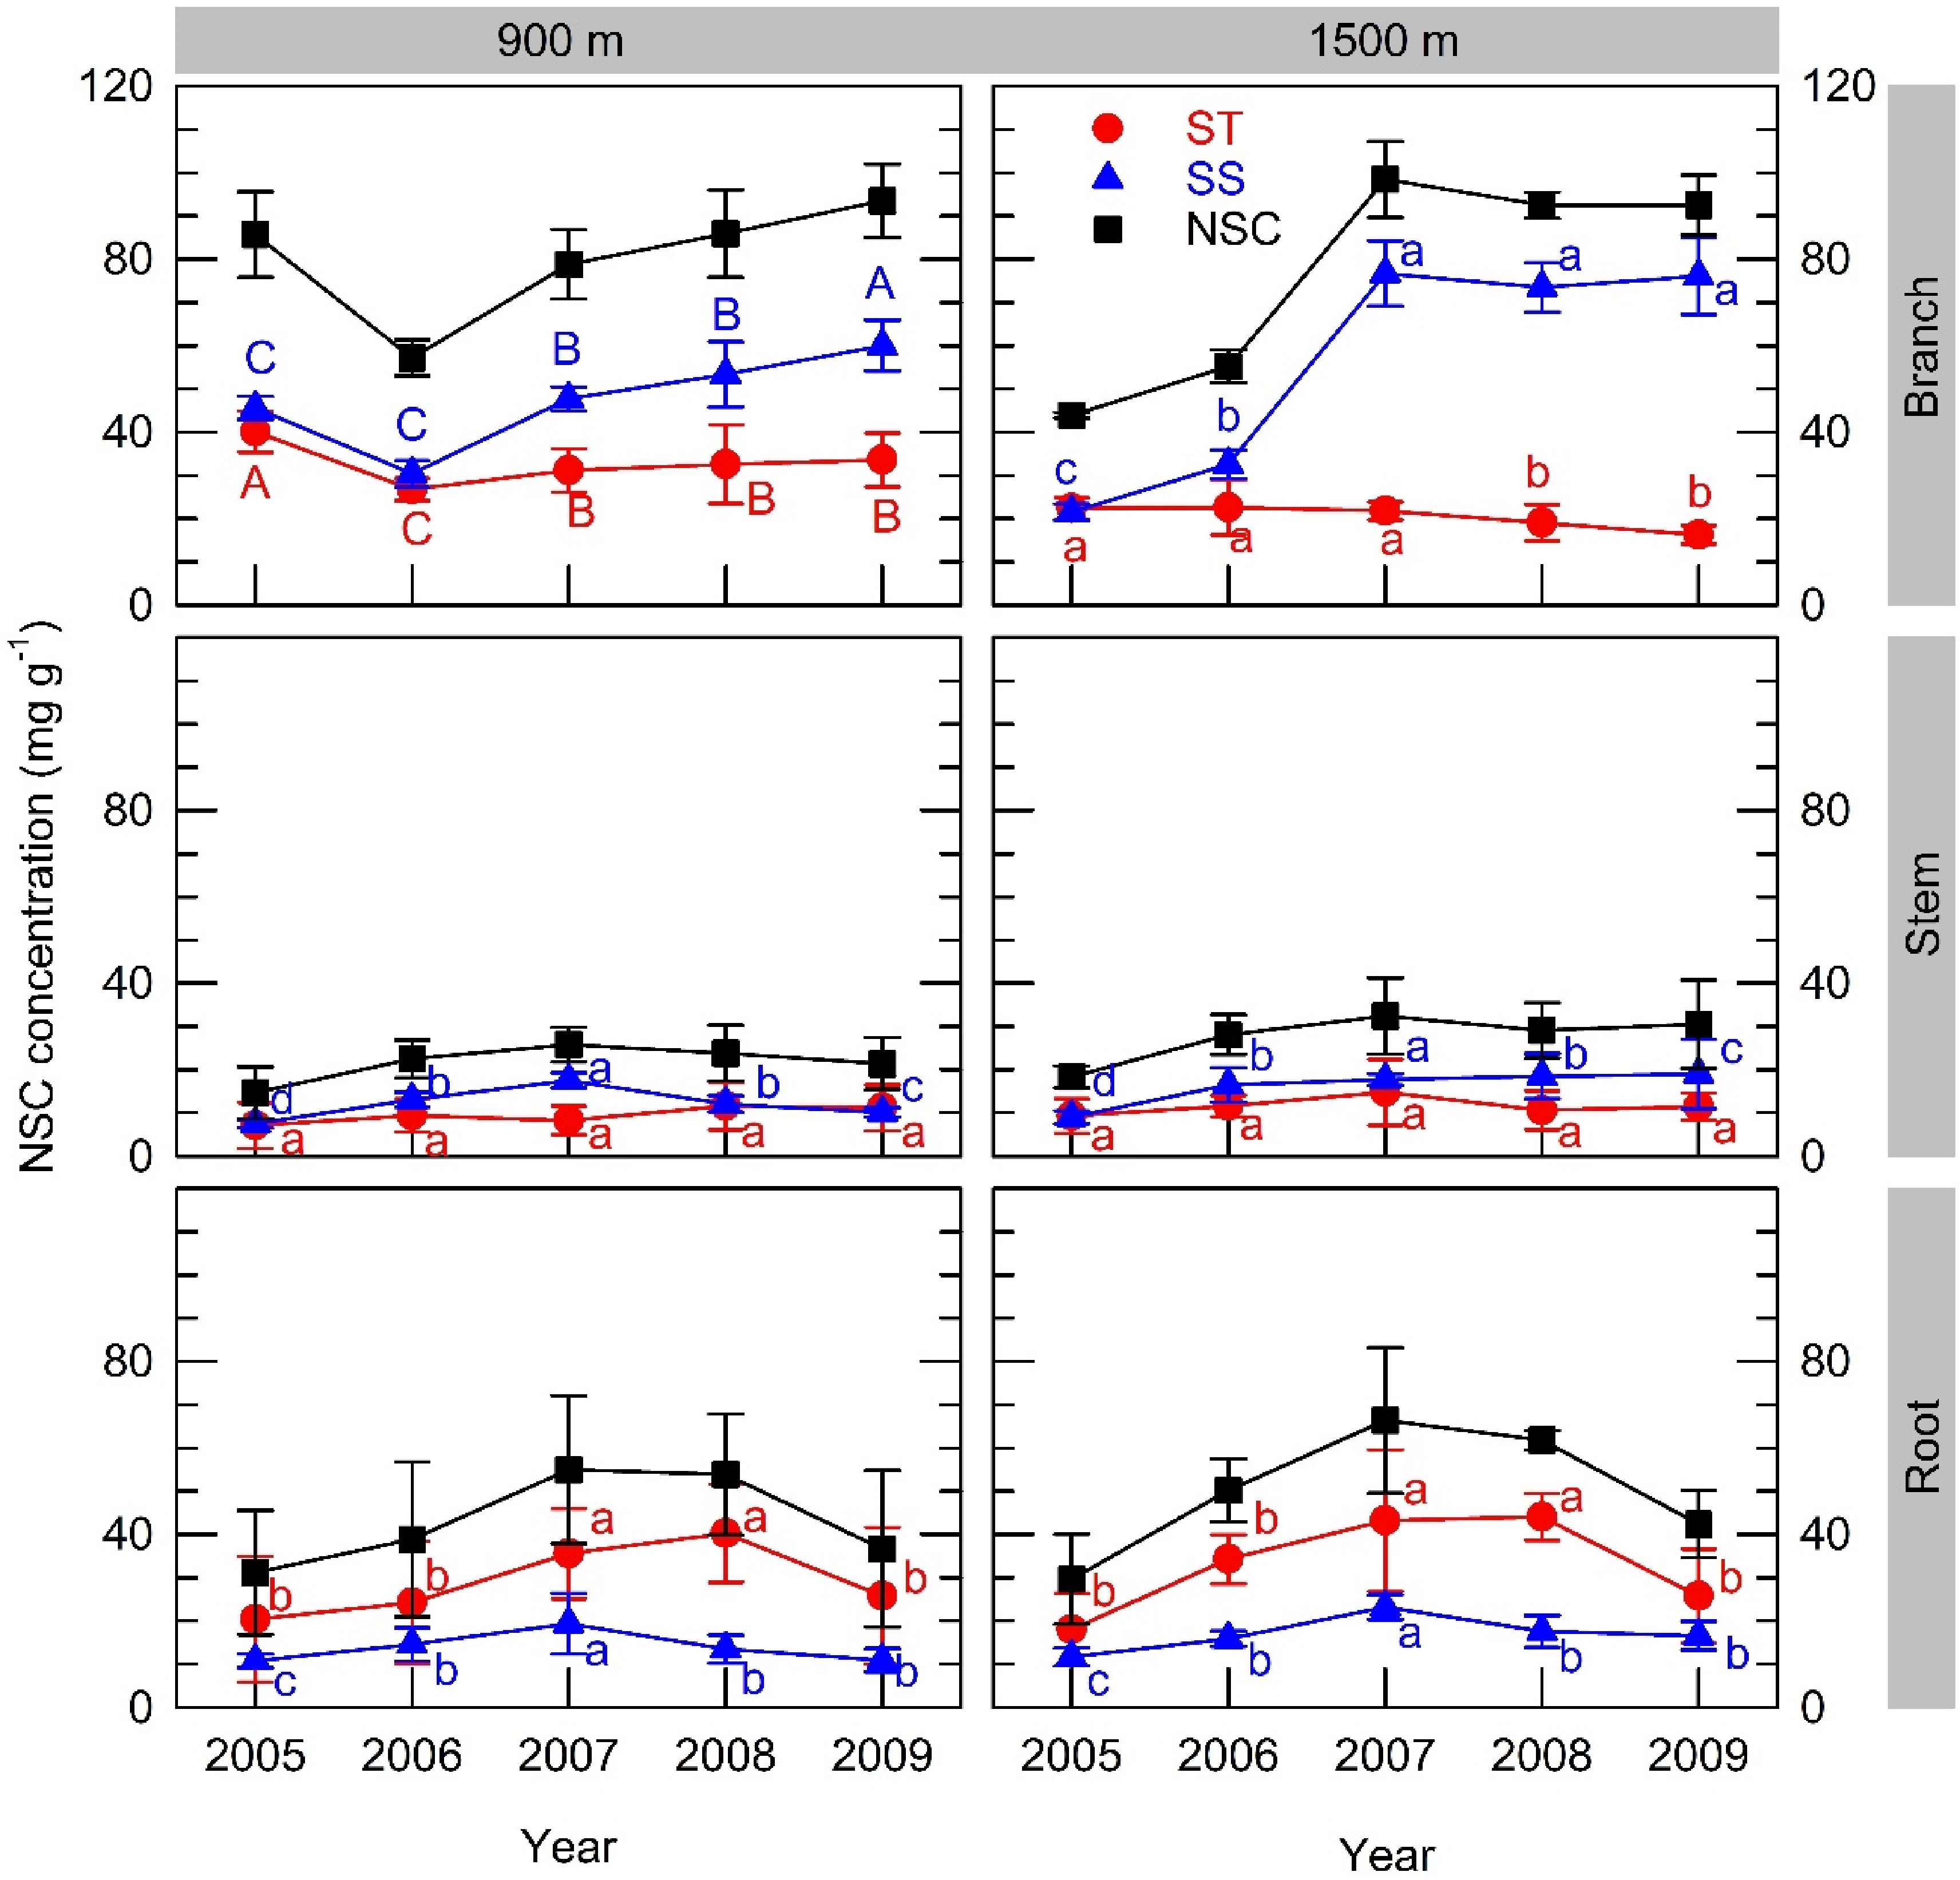
Figure 4. Inter-annual variations in organ concentrations of starch (ST), soluble sugar (SS) and the sum of both (NSC) after leaf fall from branches, stems and roots at the 900 m and 1500 m sites. A full masting event occurred in 2005. Values represent the mean ± SE for 3−5 individuals. In each graph, different capital or small letters indicate different values based on parameter estimations using the improved model in Supplemental Table S2 for the 900 m and 1500 m sites, respectively. Graphs that feature no capital letters present parameter estimates based on combined data from both sites because the interaction terms in these cases were negligible.
-
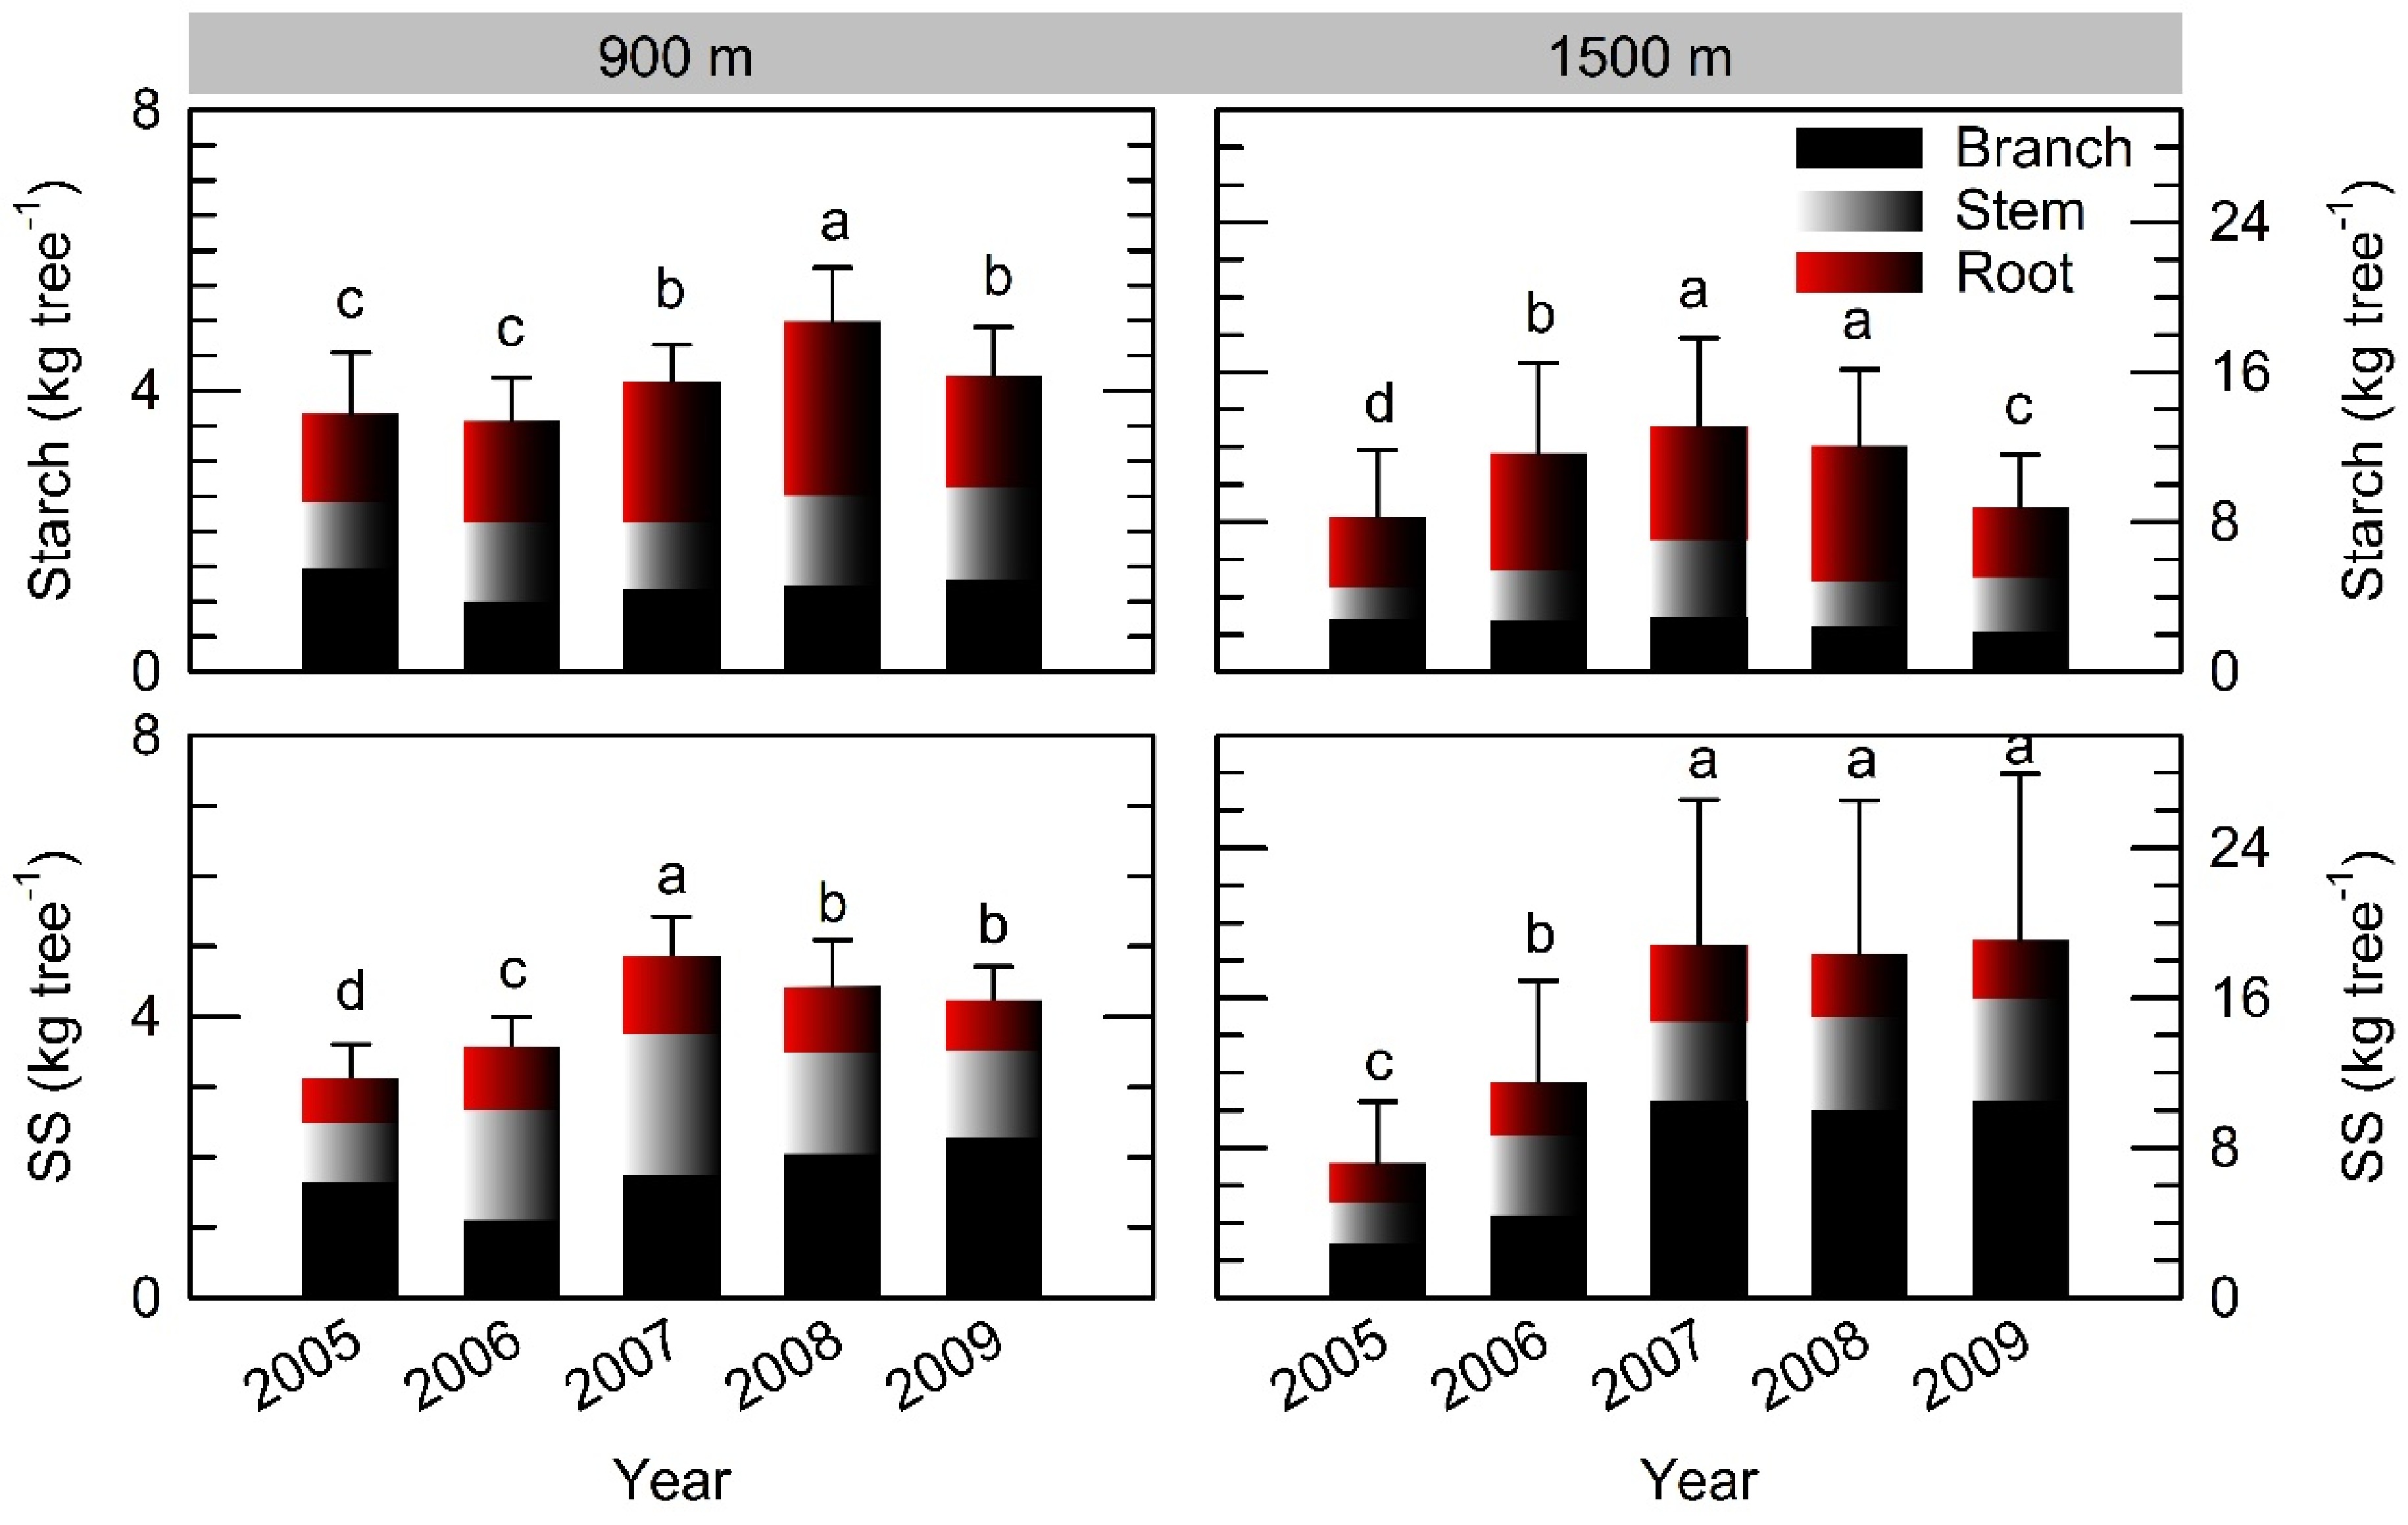
Figure 5. Depletion and replenishment of individual starch and soluble sugar (SS) storage pools following full masting in 2005 at the 900 m and 1500 m sites. Vertical bars indicate standard errors at tree level (n = 3−5). In each graph, different letters indicate different values based on parameter estimations using the improved model in Supplemental Table S2.
-
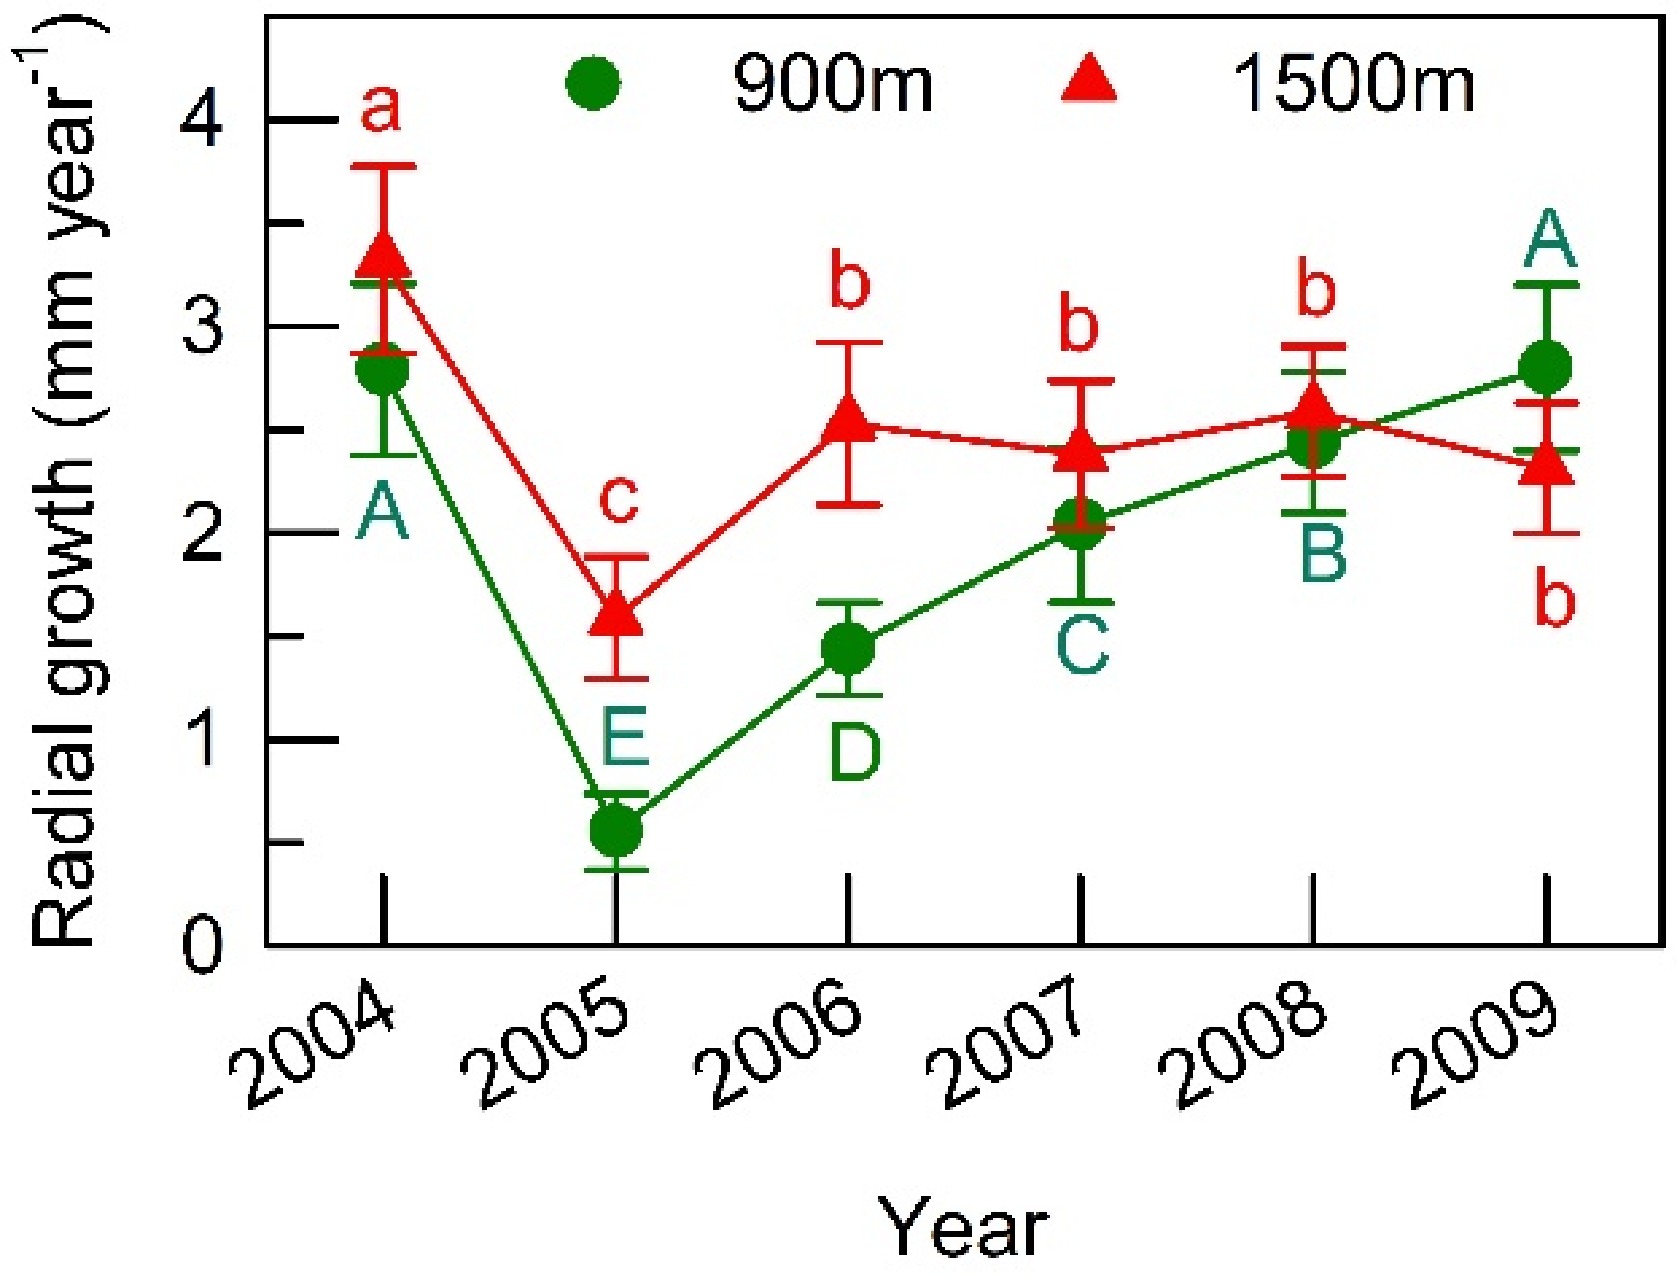
Figure 6. Annual radial stem increment measured at breast height in F. crenata during 2004−2009 at the 900 m and 1500 m sites. All of the sampled trees fruited heavily in 2005 (a masting year). Means and standard errors are shown. Different capital or small letters indicate different values estimated in the improved model in Supplemental Table S2.
-
Organ Site elevation Coefficients of the models Intercept Slope Estimated se Estimated SE Starch Root 1500 m 3.58 0.52 1.10 0.28 900 m 3.77 0.34 −0.94 0.19 Stem 1500 m 4.44 0.23 −0.73 0.07 900 m 3.77 0.15 −0.94 0.05 Branch 1500 m 3.07 0.13 0.25 0.04 900 m Soluble sugars Root 1500 m 1.30 0.10 −0.06 0.03 900 m 1.20 0.09 Stem 1500 m 4.09 0.16 −1.02 0.04 900 m 3.77 0.10 −0.94 0.02 Branch 1500 m 4.98 0.31 −0.26 0.03 900 m 4.31 0.26 In cases where the effects of study site on the estimated slope and intercept of the model were negligible, coefficients were estimated across the sites. Table 1. Summary statistics for the fixed effects of depth of wood cores in roots and stems and age of branches on the concentrations of starch and soluble sugars in F. crenata sampled from the 900 m and 1500 m sites. Estimated slope not equal to zero indicates significant fixed effects.
Figures
(6)
Tables
(1)