-

Figure 1. Multiple alignment of the amino acid sequences of CsWRKY13 and other WRKY13 proteins of different species. The conserved DNA-binding domain is indicated by a black line. The comparator species were: Populus euphratica (PeWRKY13, XP_011025576.1), Theobroma cacao (TcWRKY13, XP_007048165.1), Gossypium hirsutum (GhWRKY13, NP_001314117.1), Arabidopsis thaliana (AtWRKY13, NP_195651), Vitis vinifera (VvWRKY13, RVW55274.1).
-

Figure 2. Phylogenetic tree analysis of CsWRKY13 protein and other WRKY proteins of different species. Other plant WRKY proteins used for multiple sequence alignment and evolutionary analysis include: A. thaliana (AtWRKY3, At2g03340; AtWRKY4, AF425835; AtWRKY12, At2g44745; AtWRKY13, AF421153; AtWRKY25, At2G30250); P. euphratica (PeWRKY13, XP_011025576.1); T. cacao (TcWRKY13, XP_007048165.1); G. hirsutum (GhWRKY13, NP_001314117.1); V. vinifera (VvWRKY2, AY596466; VvWRKY13, RVW55274.1); Medicago truncatula (MtSTP, AEJ09956.1); Oryza sativa (OsWRKY24, AY676925; OsWRKY78, BK005212).
-
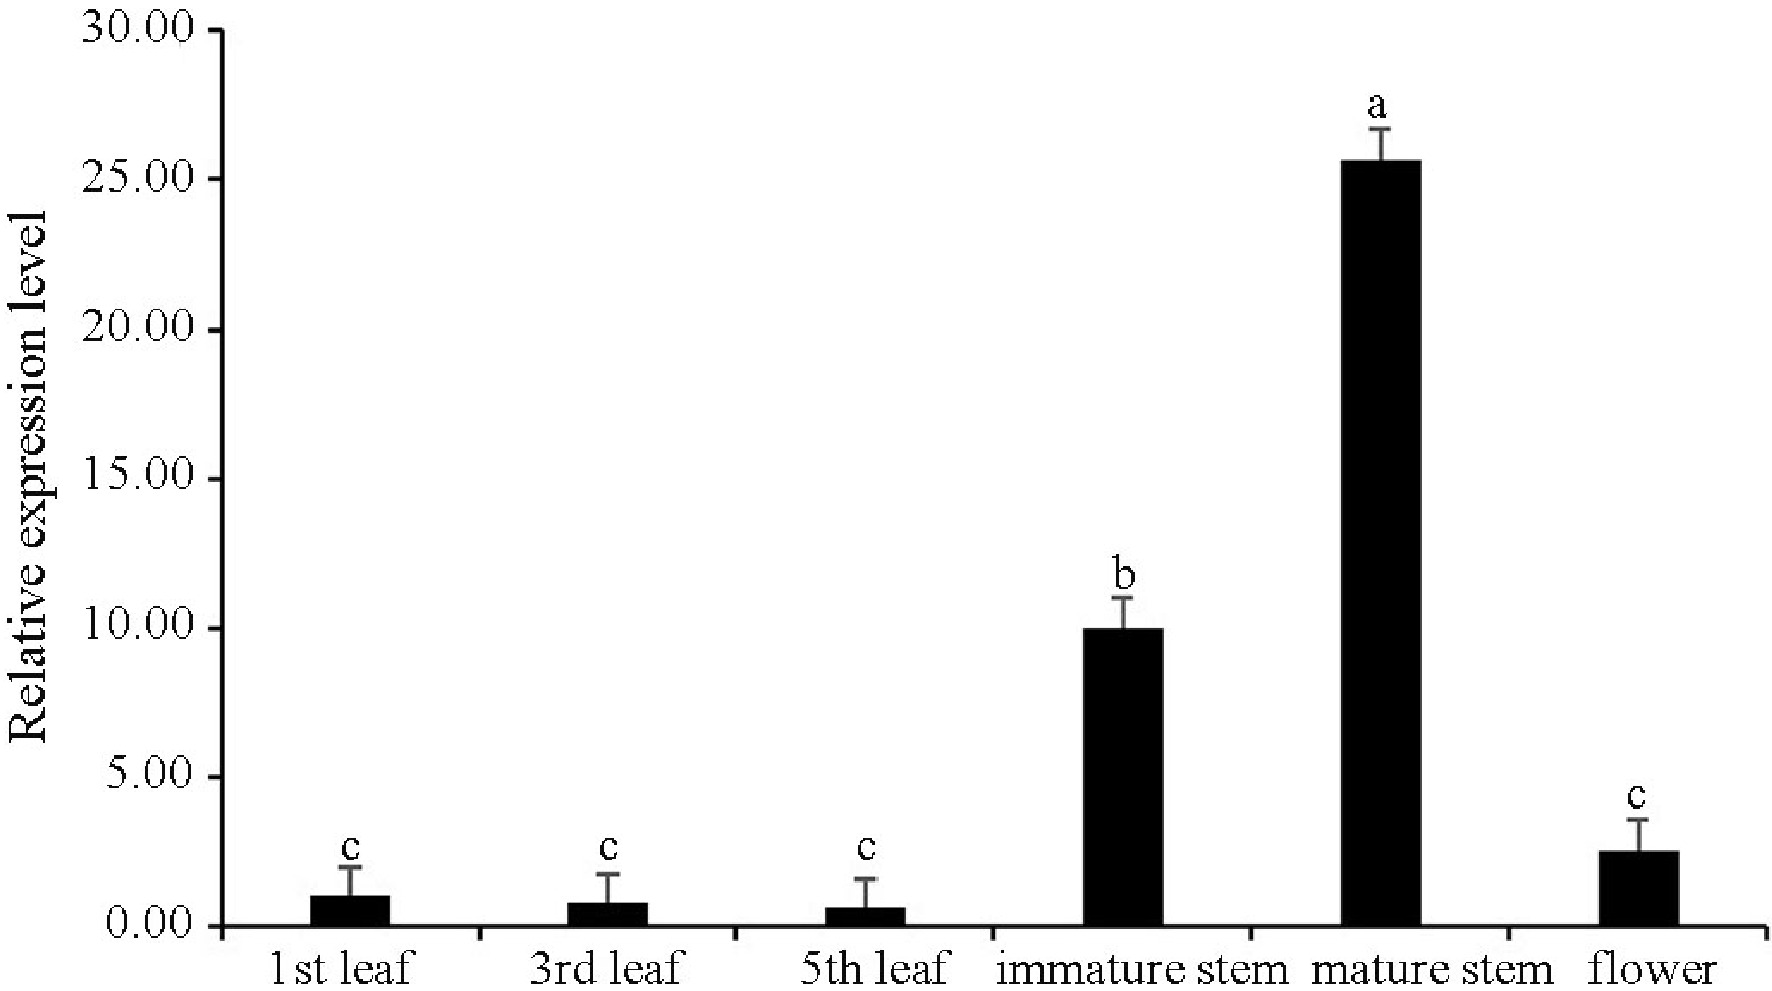
Figure 3. Expression profiles of CsWRKY13 in different tissues of tea plants. The value in the first leaf was set to 1. Expression levels of CsWRKY13 were detected by RT-qPCR, and the data were analyzed using the
$2^{-\Delta \Delta} $ Cᴛ method. Different letters represent significant difference at the 0.05 level. -
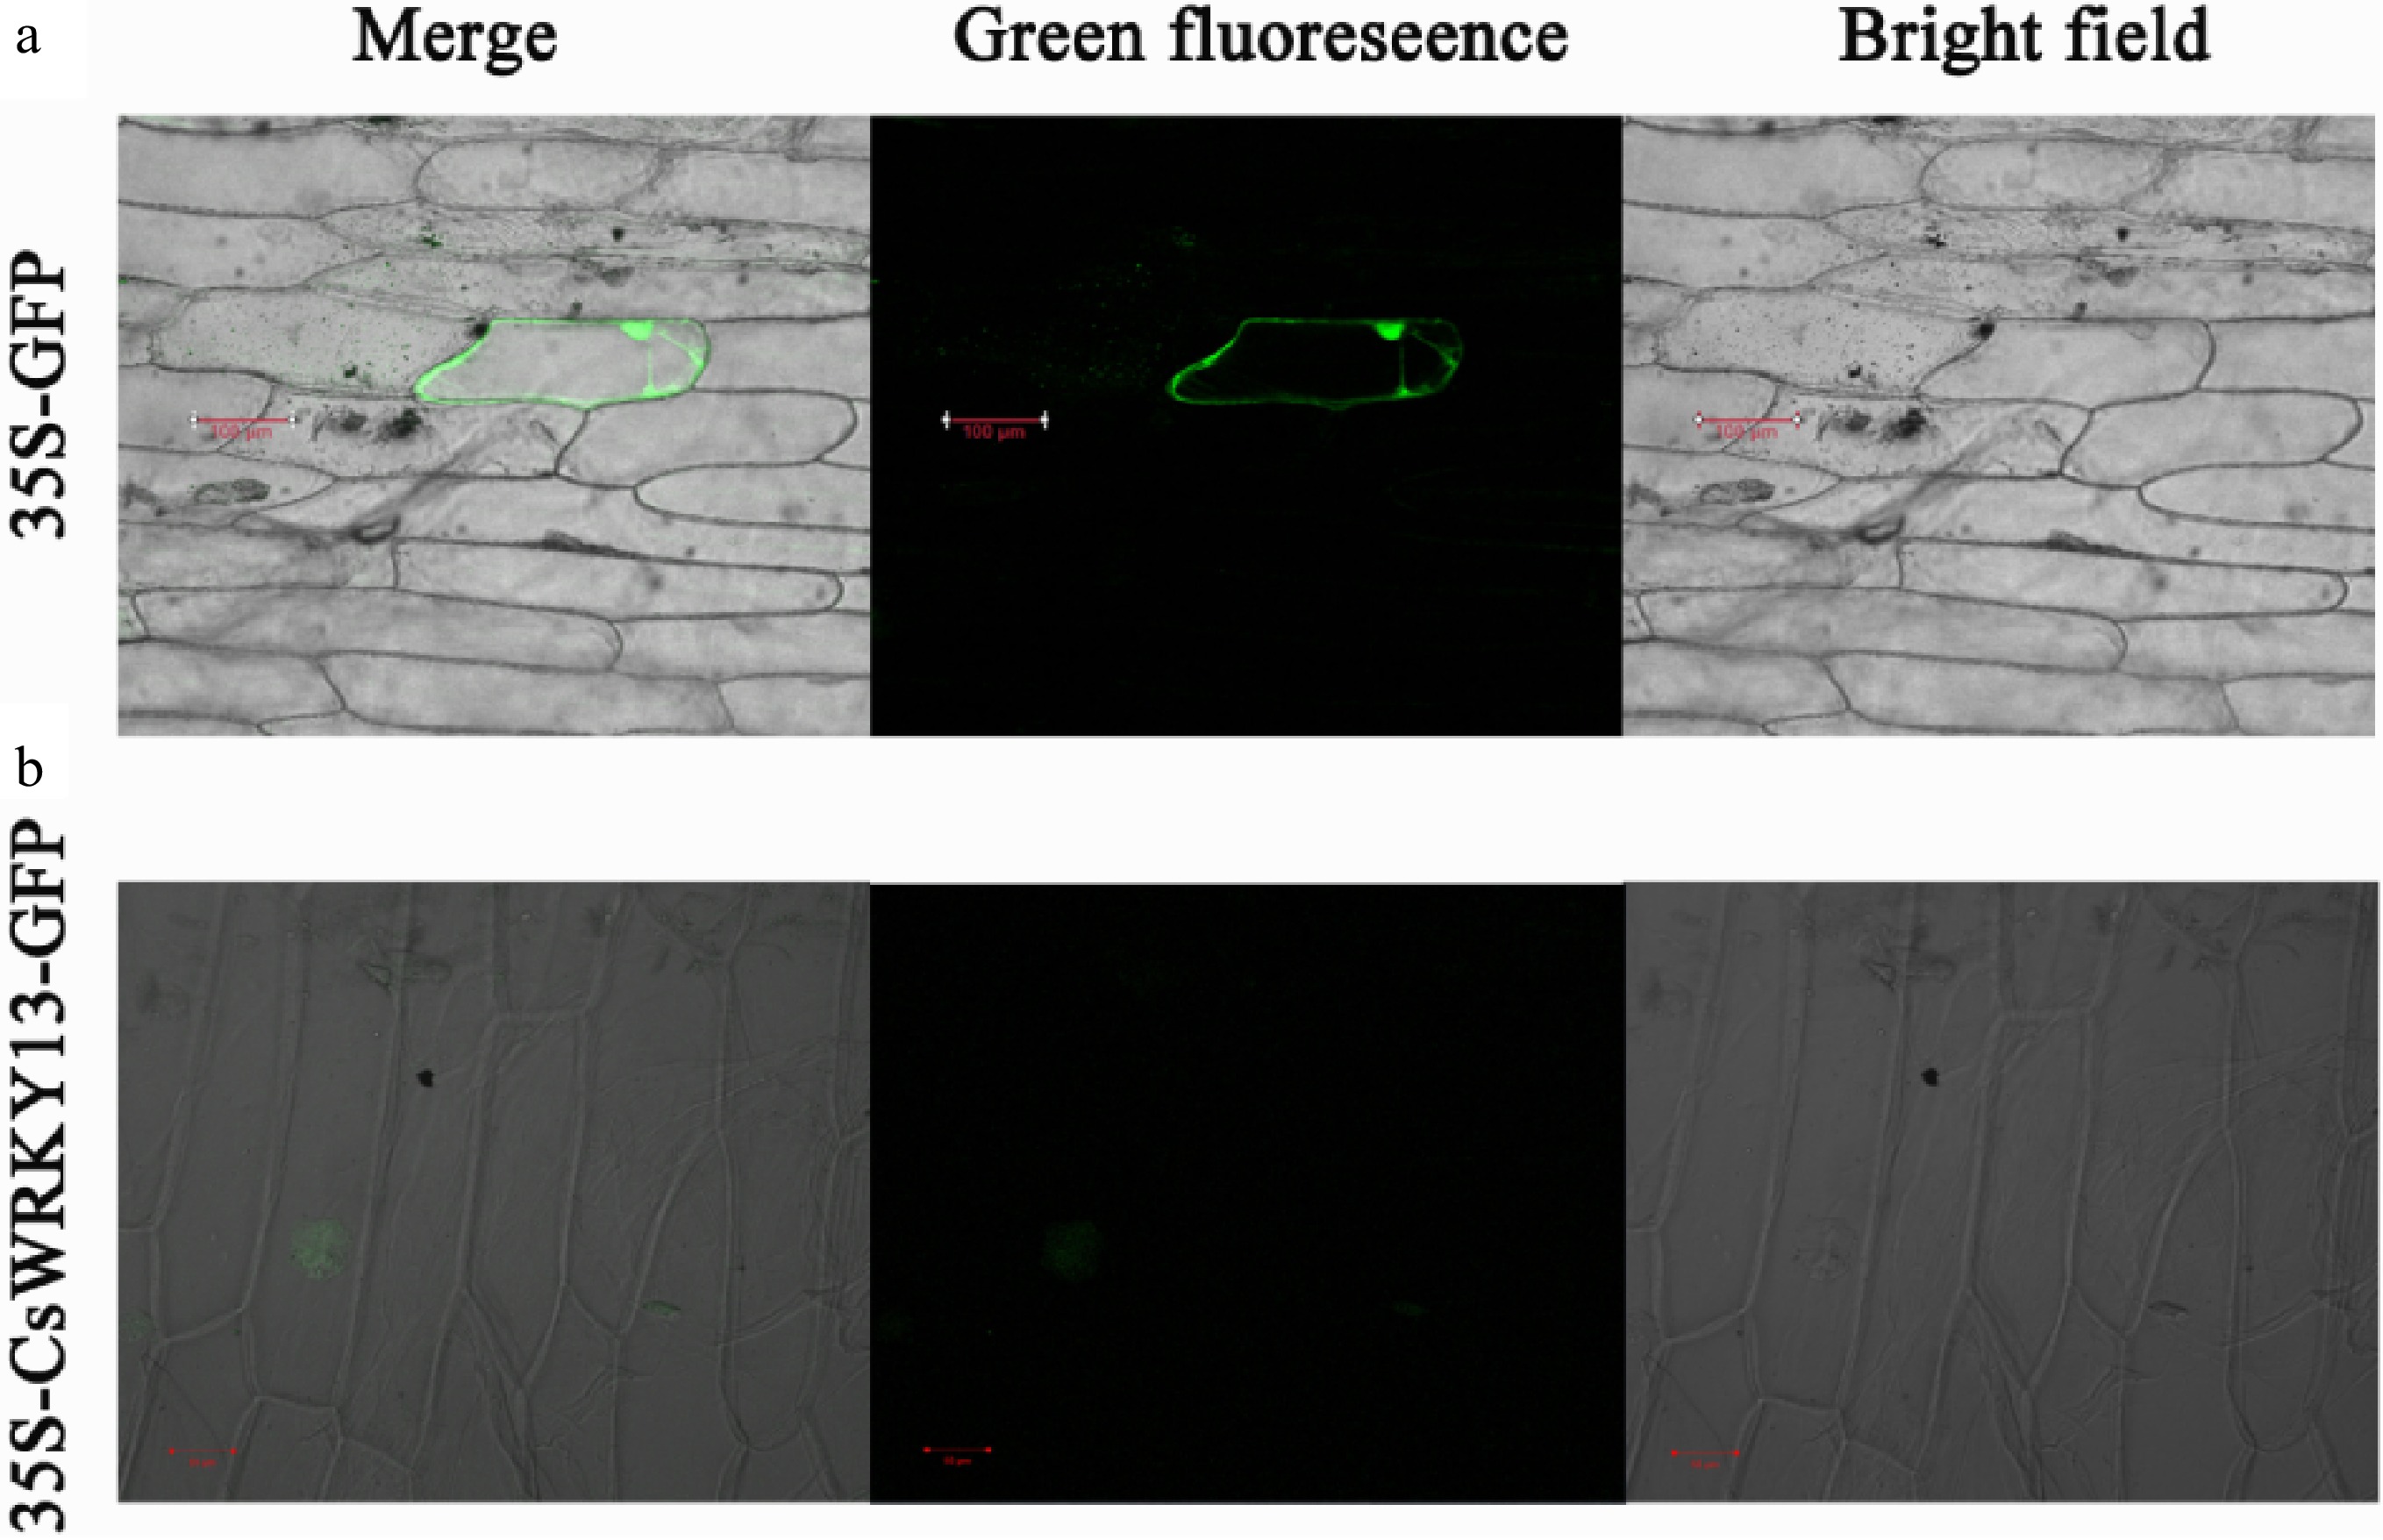
Figure 4. Subcellular location of CsWRKY13 proteins in onion epidermal cells.
-
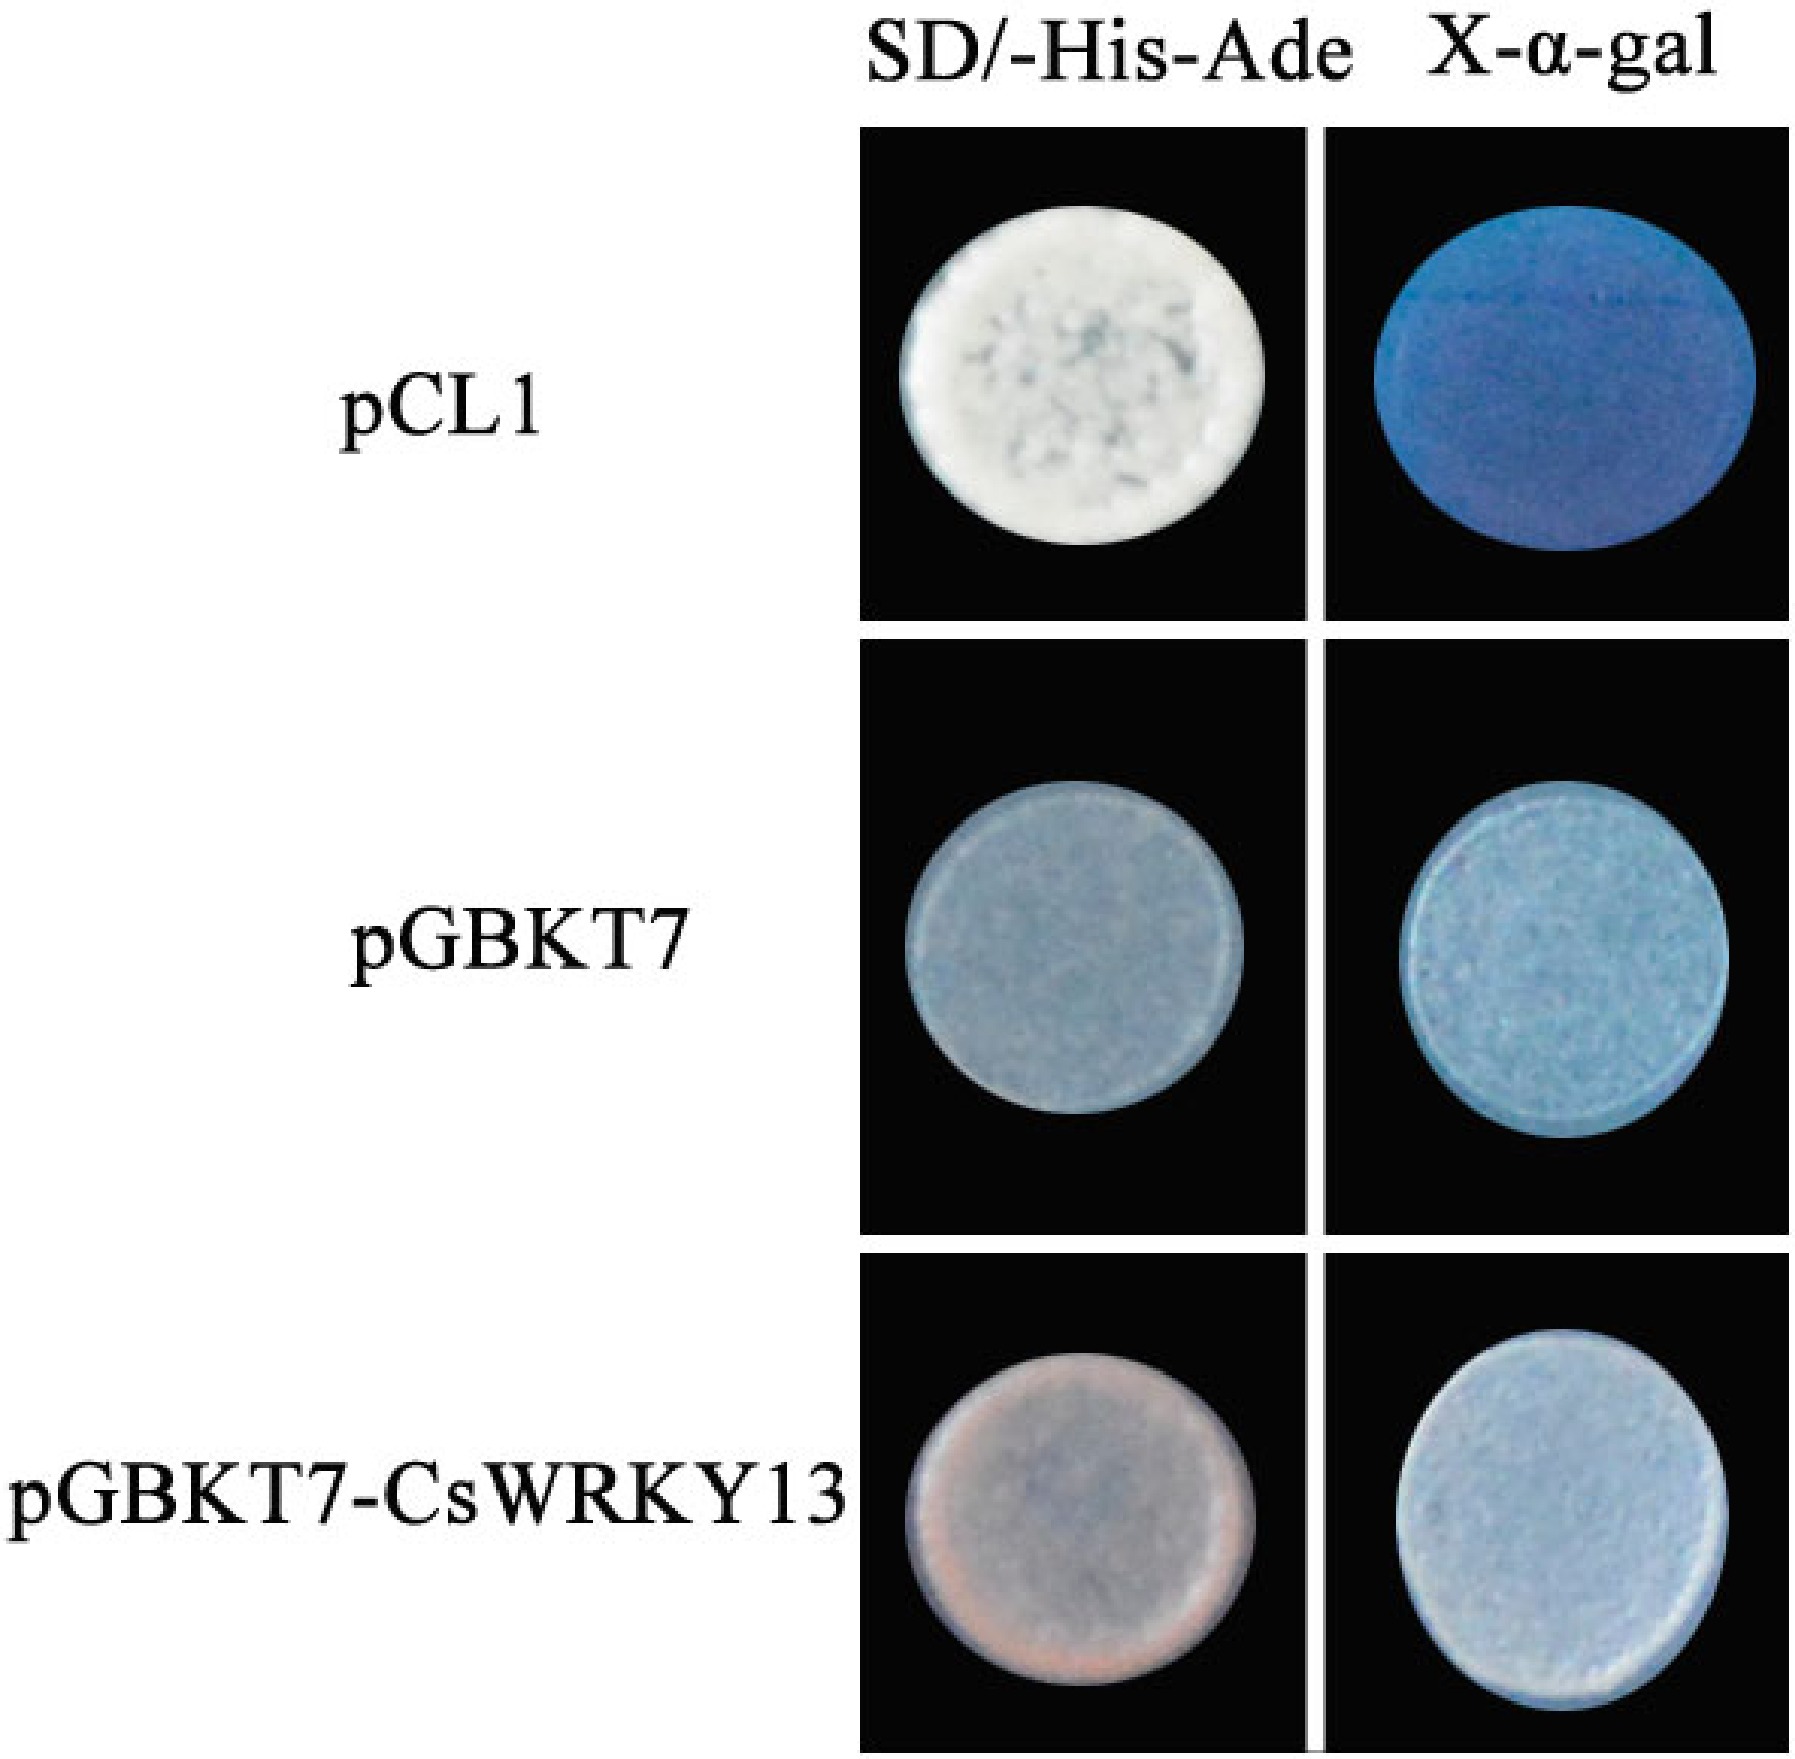
Figure 5. Trans-activation activity analysis of CsWRKY13 in yeast.
-
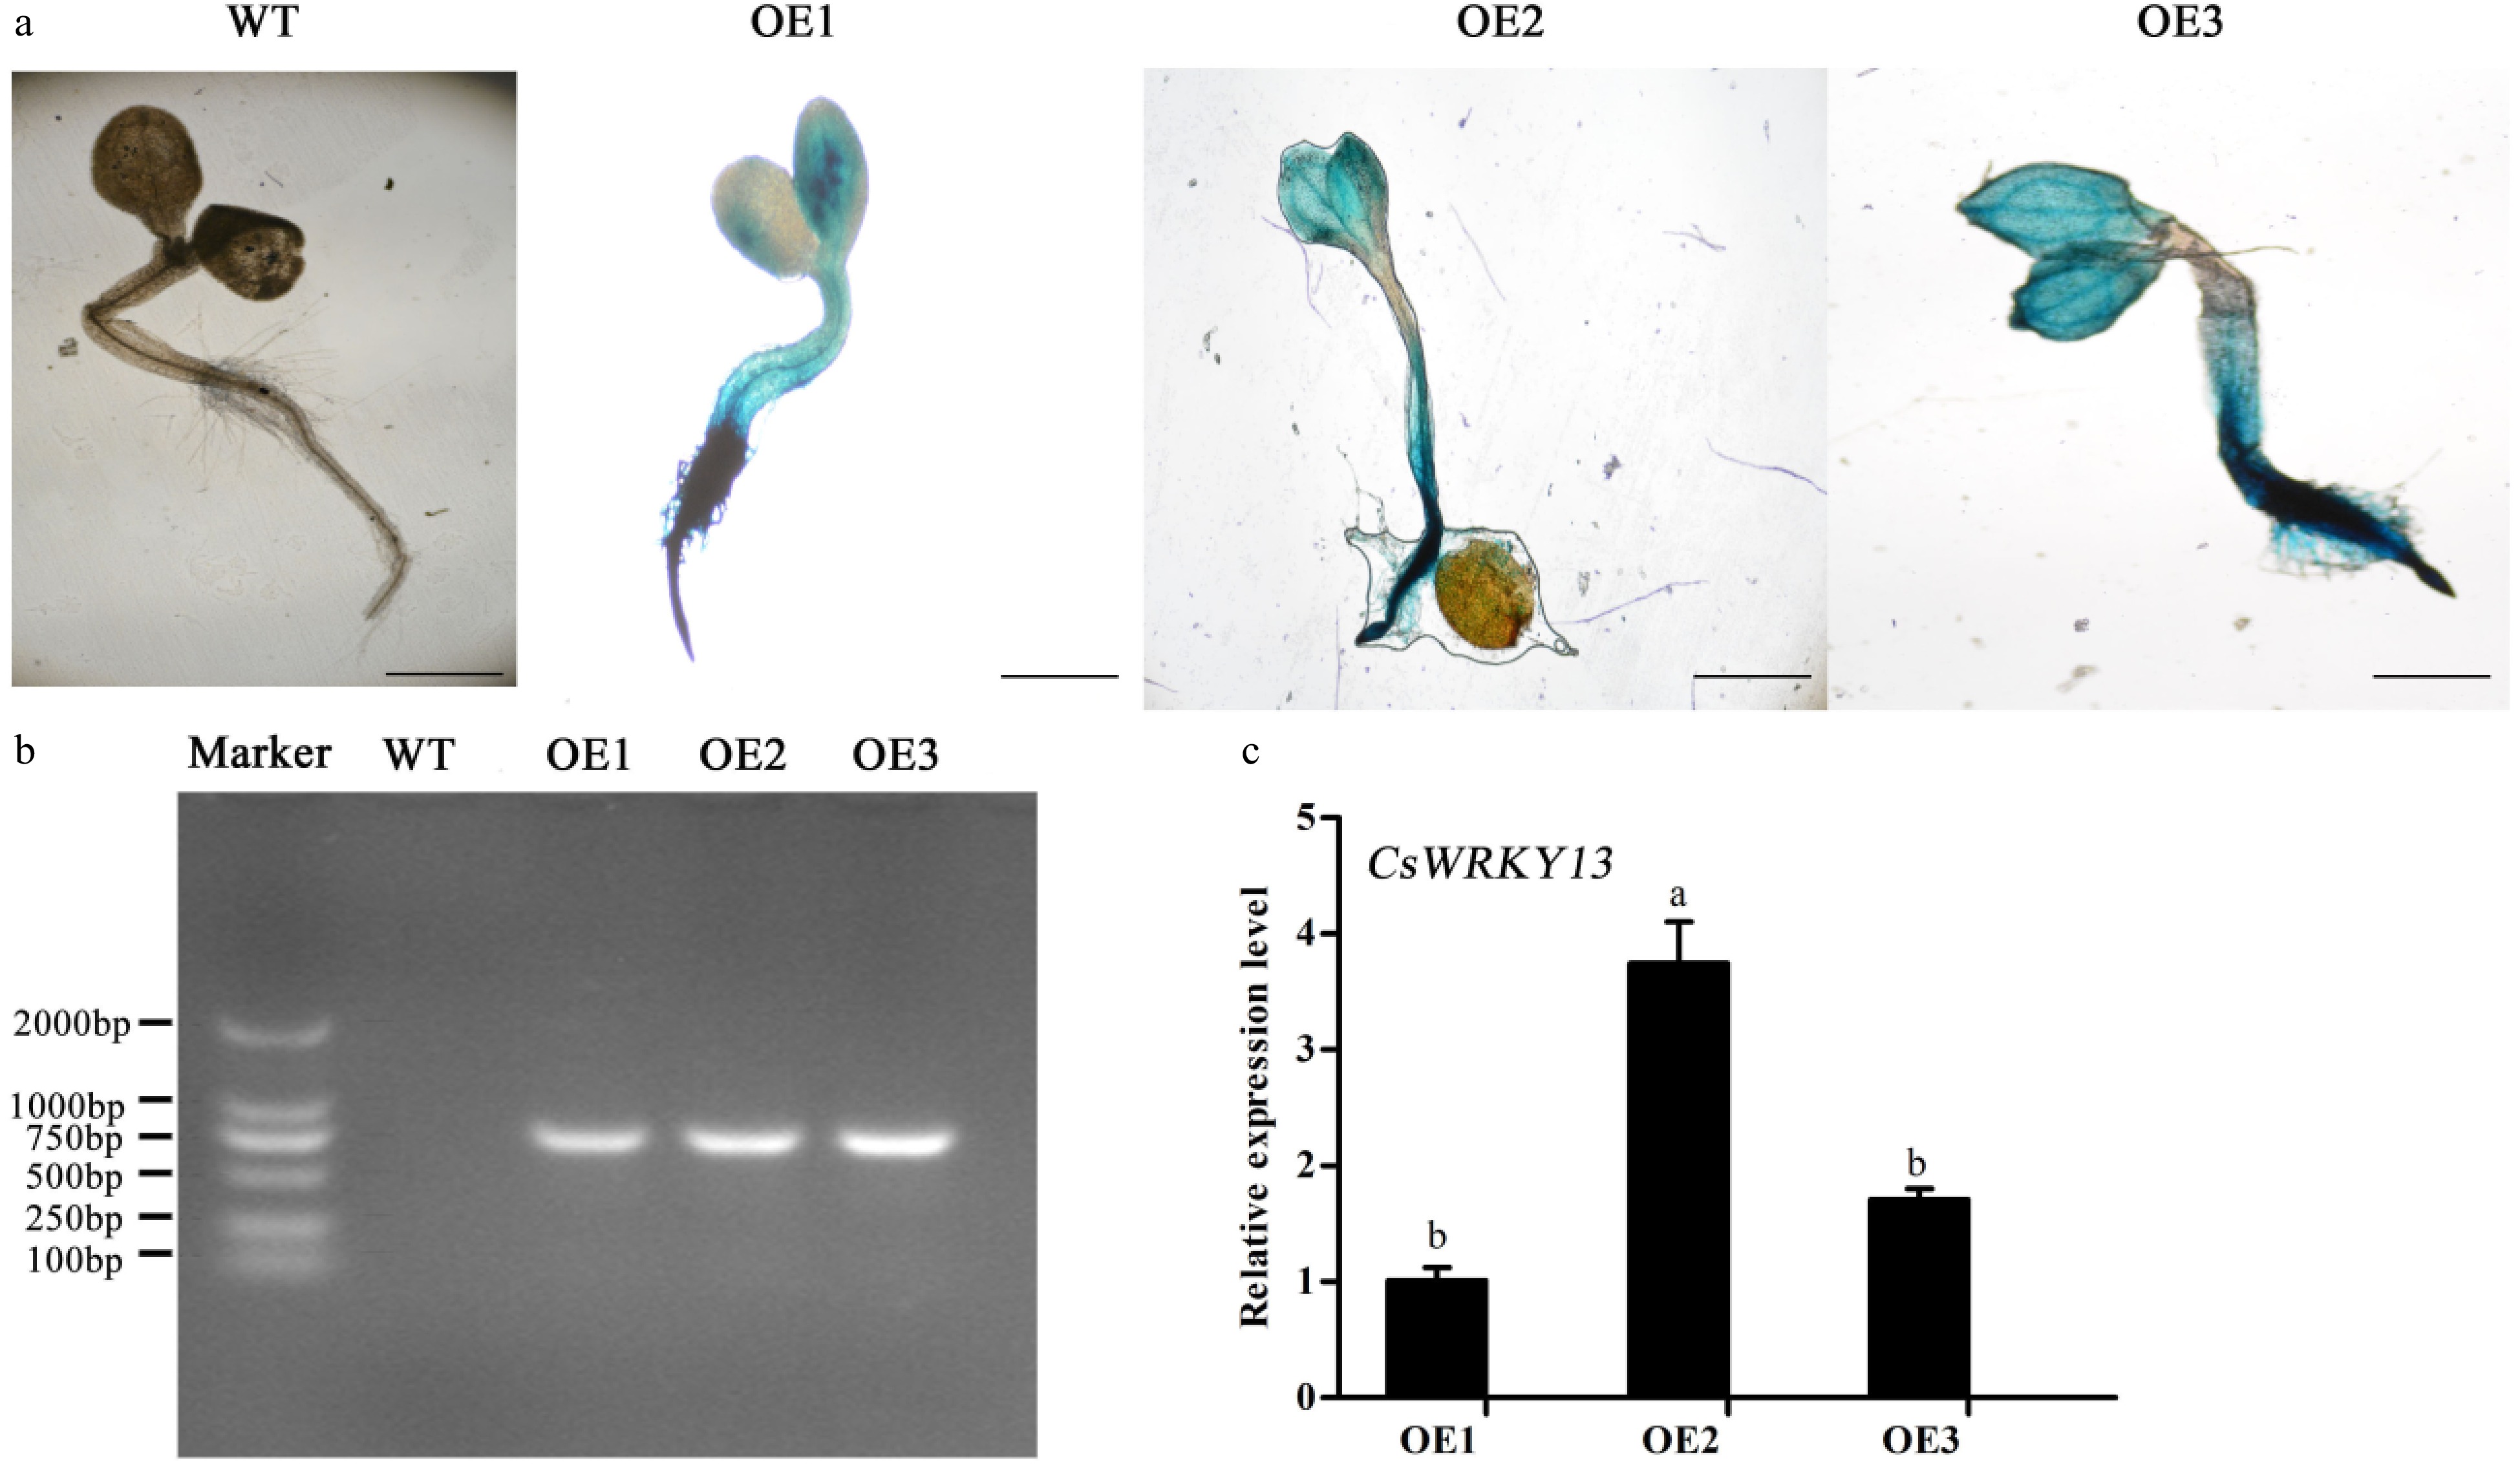
Figure 6. Confirmation of transgenic Arabidopsis carrying the CsWRKY13 gene by GUS staining and PCR assays. (a) GUS assays of WT and transgenic Arabidopsis. Bar: 1 mm. (b) PCR analysis of CsWRKY13 of WT and transgenic Arabidopsis. (c) The relative expression levels of the CsWRKY13 gene.
-
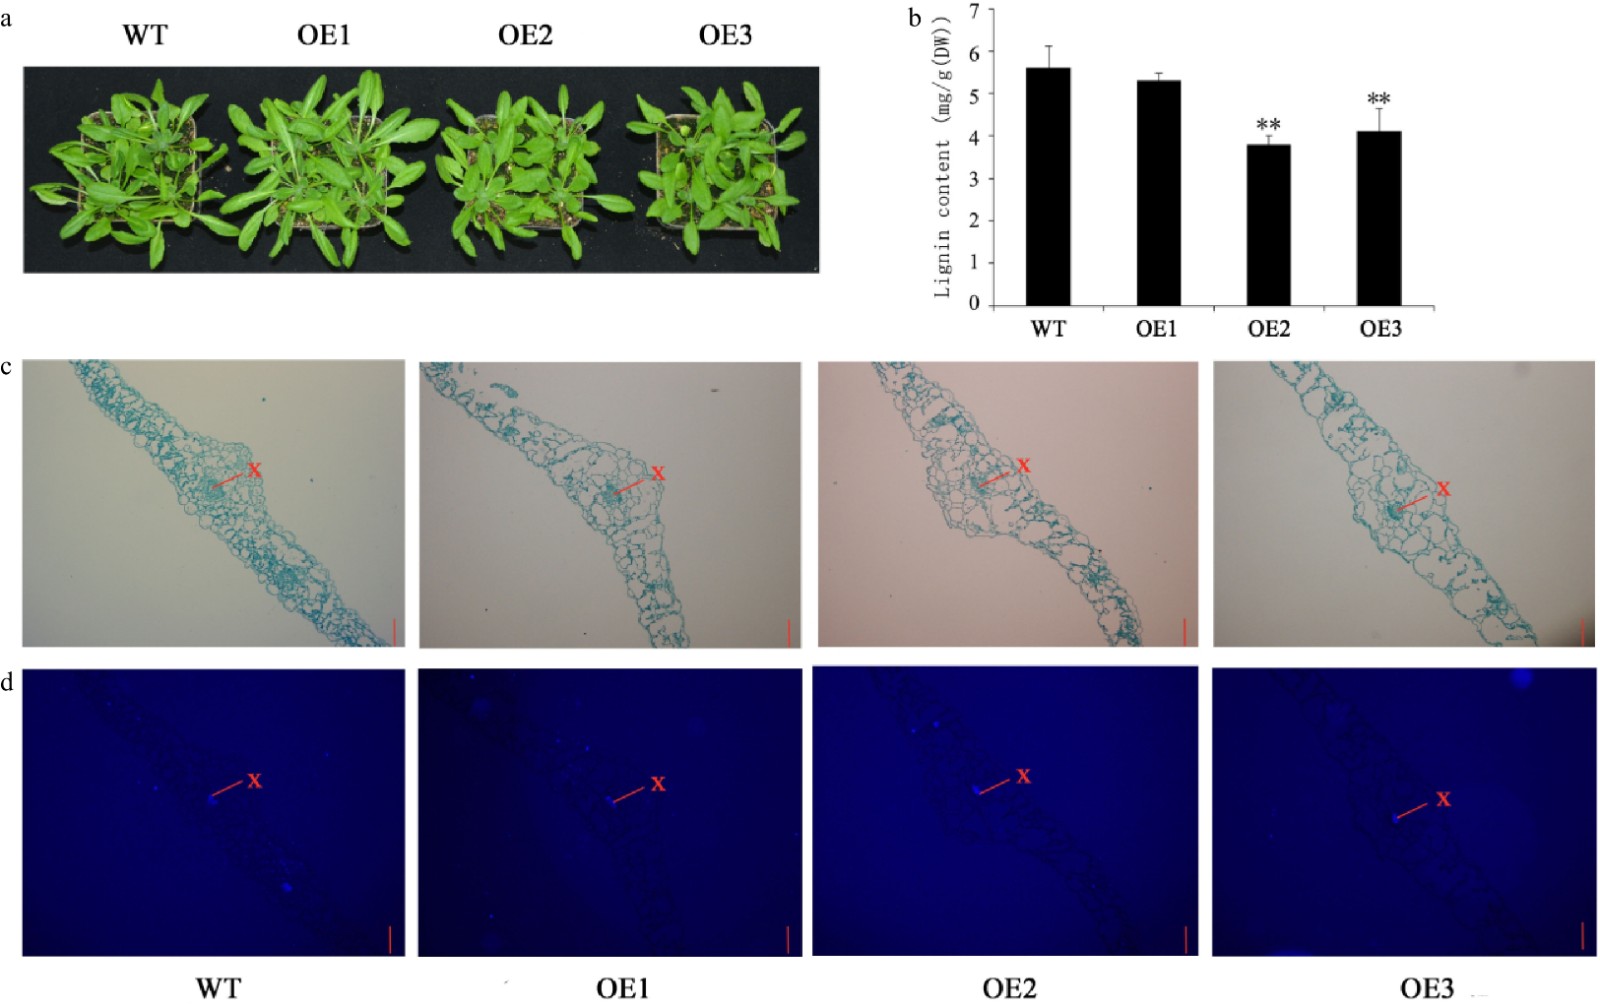
Figure 7. Growth status and lignin content of 5-week-old Arabidopsis. (a) Growth status of WT and transgenic Arabidopsis. (b) Lignin content of leaves. (c) Safranin-O staining. (d) Fluorescence micrographs. Scale bars = 50 μm. The red lines indicate the xylem. Error bars represent standard deviation (SD). (**) indicates the significance of the difference (p < 0.01).
-

Figure 8. Growth status and accumulation of lignin in 7-week-old WT and CsWRKY13 transgenic A. thaliana. (a) Growth status of WT and transgenic Arabidopsis. (b) Lignin content of stems. (c) Safranin-O staining. (d) Fluorescence micrographs. Scale bars = 50 μm. The red lines indicate the xylem. Error bars represent standard deviation (SD). (*) indicate that the value is significantly different from that of the WT at the same time point (* p < 0.05; ** p < 0.01; *** p < 0.001).
-
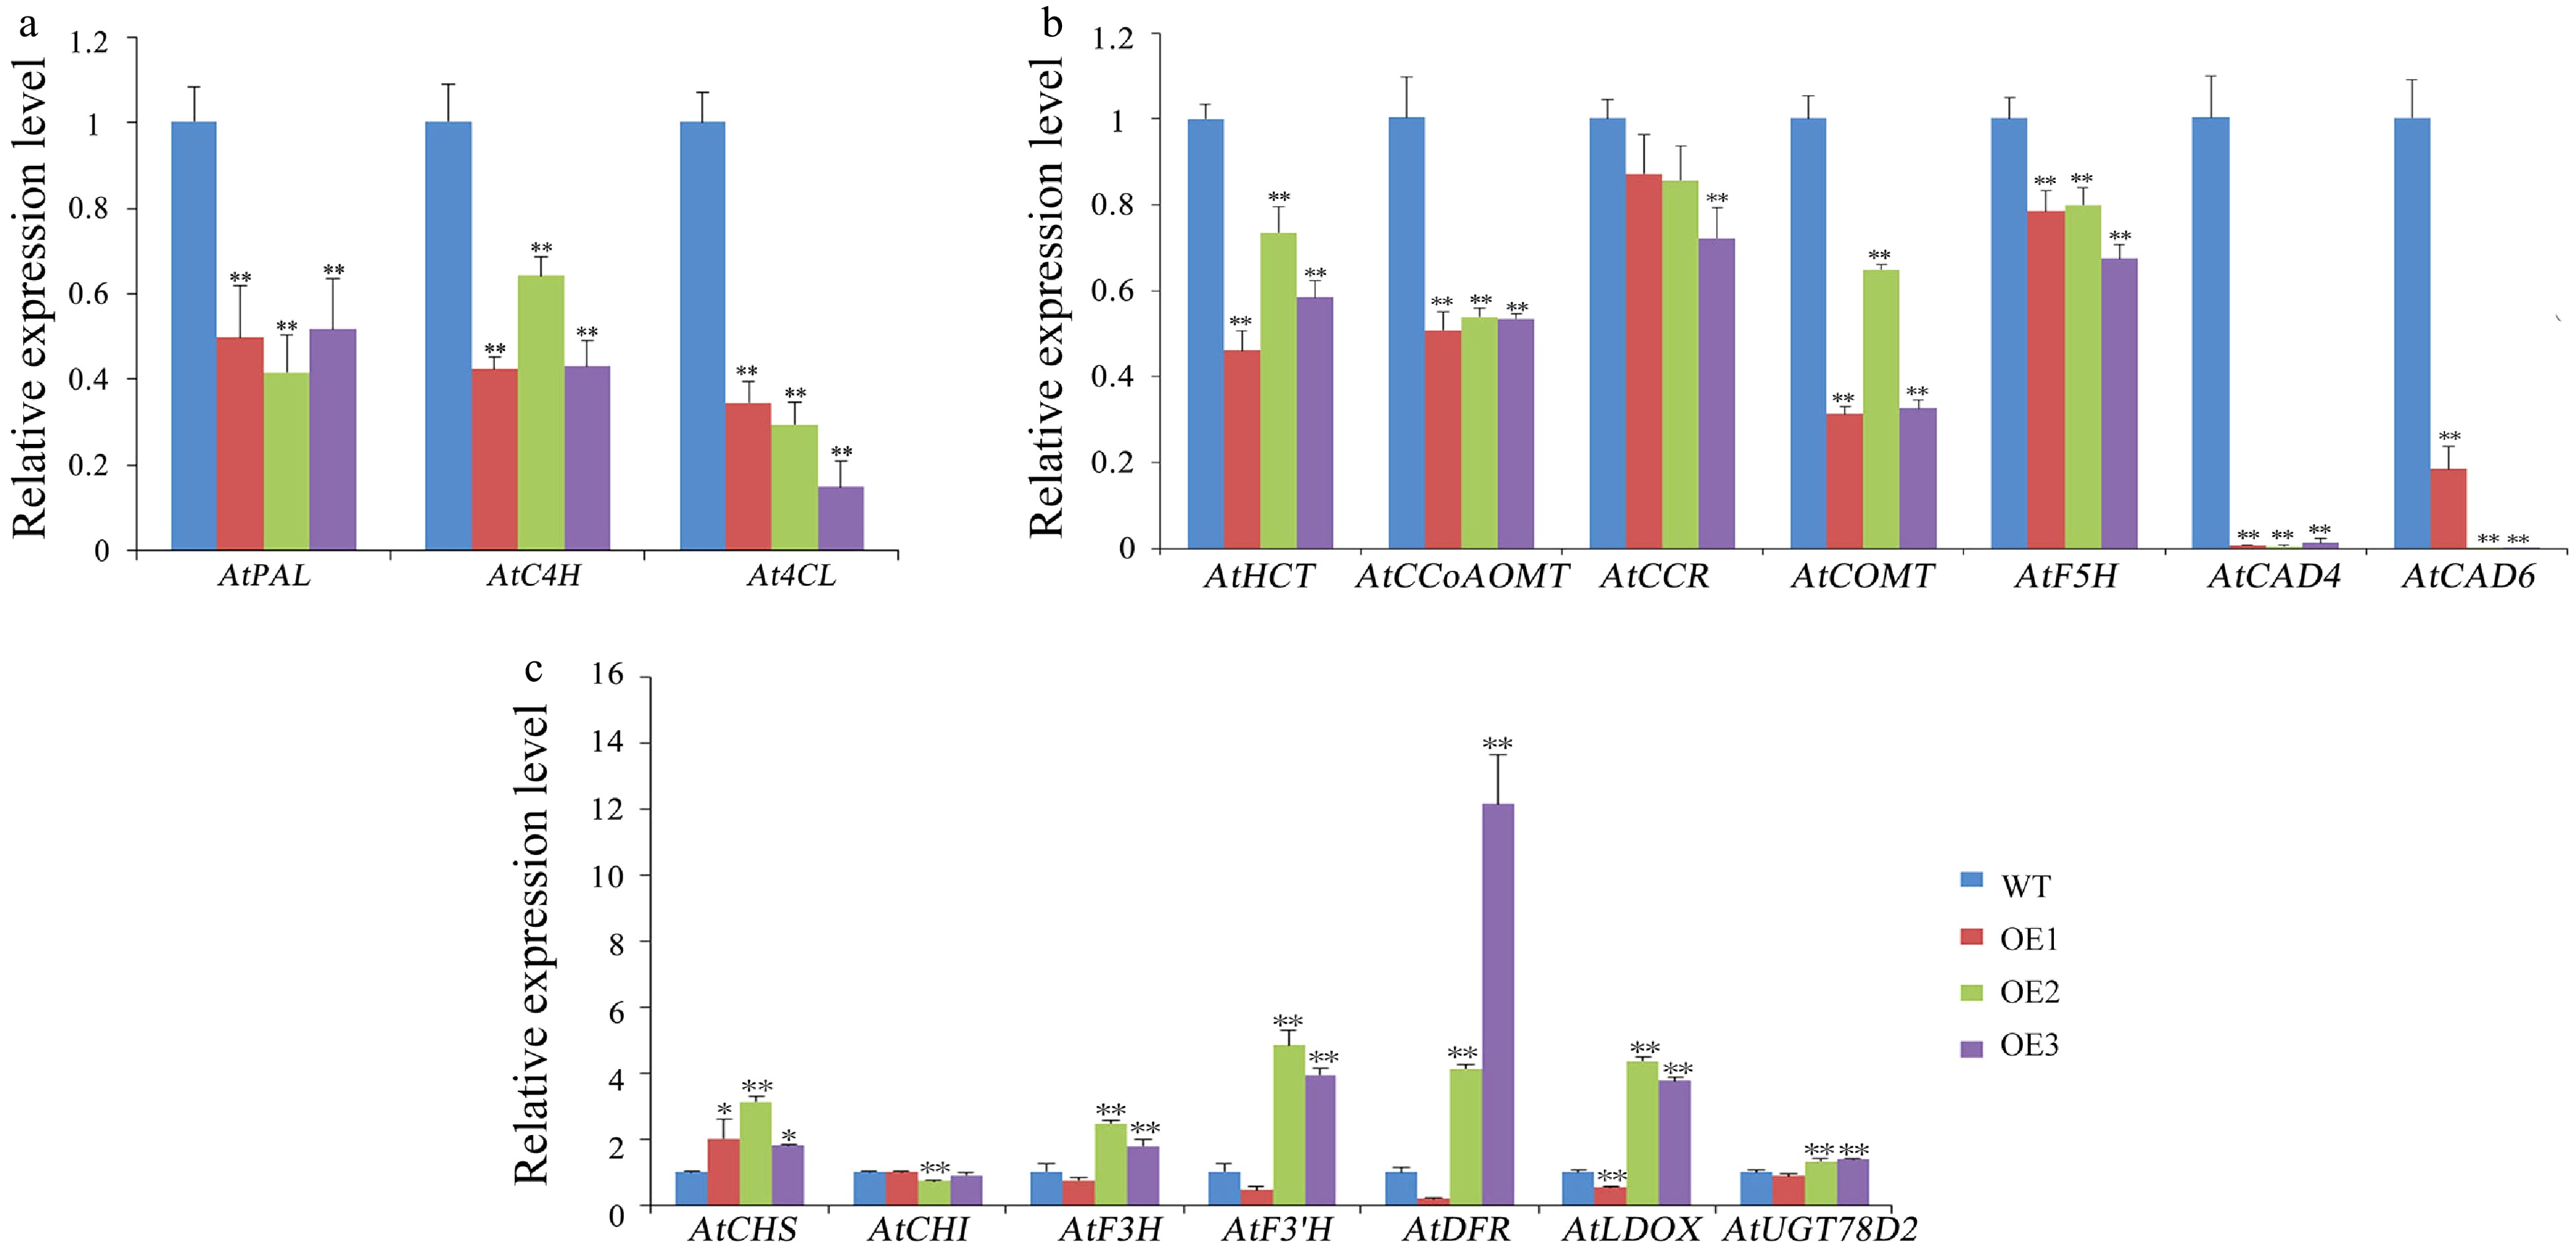
Figure 9. Expression levels of lignin and flavonoids pathway genes and secondary-wall-related genes in WT and transgenic Arabidopsis. (a,b) Expression levels of lignin pathway genes in WT and transgenic Arabidopsis. (c) Expression levels of flavonoids pathway genes in WT and transgenic Arabidopsis. Error bars represent standard deviation (SD). (*) indicate that the value is significantly different from that of the WT at the same time point (* p < 0.05; ** p < 0.01; *** p < 0.001).
Figures
(9)
Tables
(0)