-
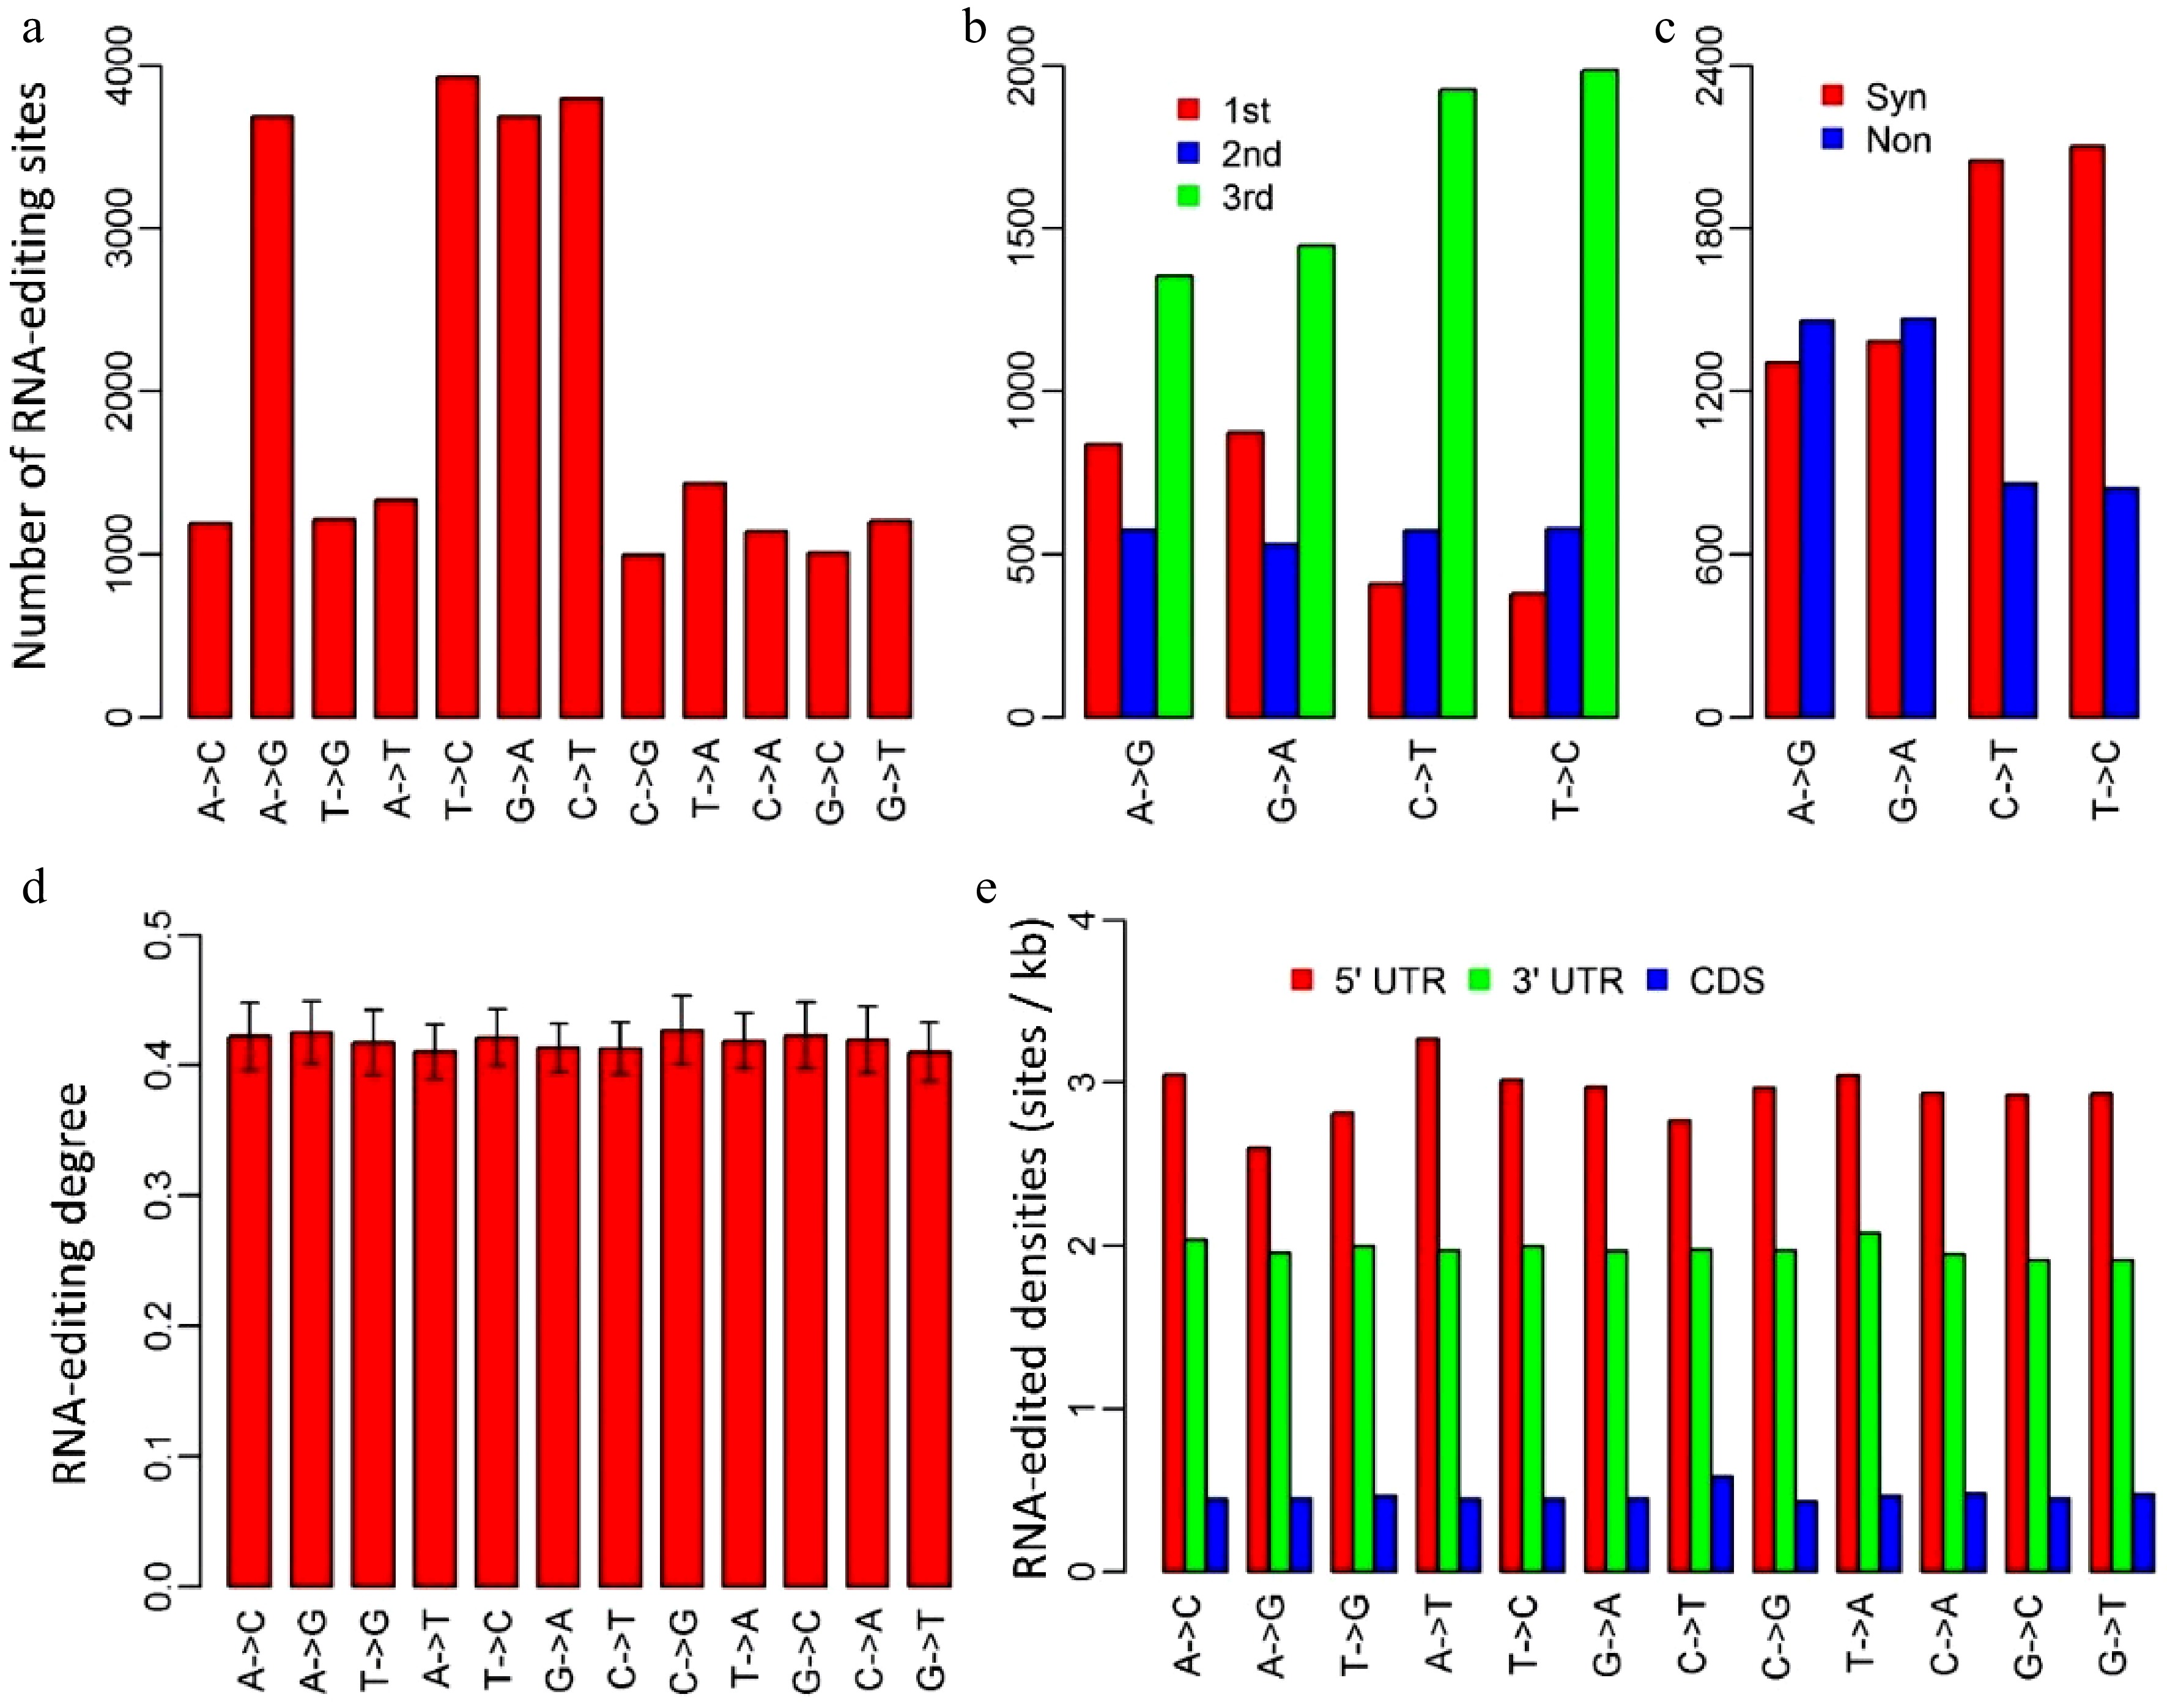
Figure 1. Characteristics of RNA-editing sites in Populus trichocarpa nuclear genome. (a) The numbers of the 12 RNA-editing types. (b) The numbers of the four dominant nuclear RNA-editing types in respect to the positions within genetic codons. 1st, 2nd and 3rd represent the first, second and third positions within codons. (c) The numbers of the four dominant nuclear RNA-editing types in respect to synonymous and non-synonymous RNA-editing. Synonymous RNA-editing refers to RNA-editing events that change the RNA sequence but do not change the amino acid sequences, whereas non-synonymous RNA-editing is regarding the events that alter both RNA and amino acid sequences. (d) RNA-editing densities of the 12 RNA-editing types for 5’ untranslated regions (UTR), 3’UTRs and coding regions (CDS). (e) RNA-editing densities of the 12 editing types in respect to 5’UTR, coding regions and 3’ UTRs. CDS represents coding region.
-
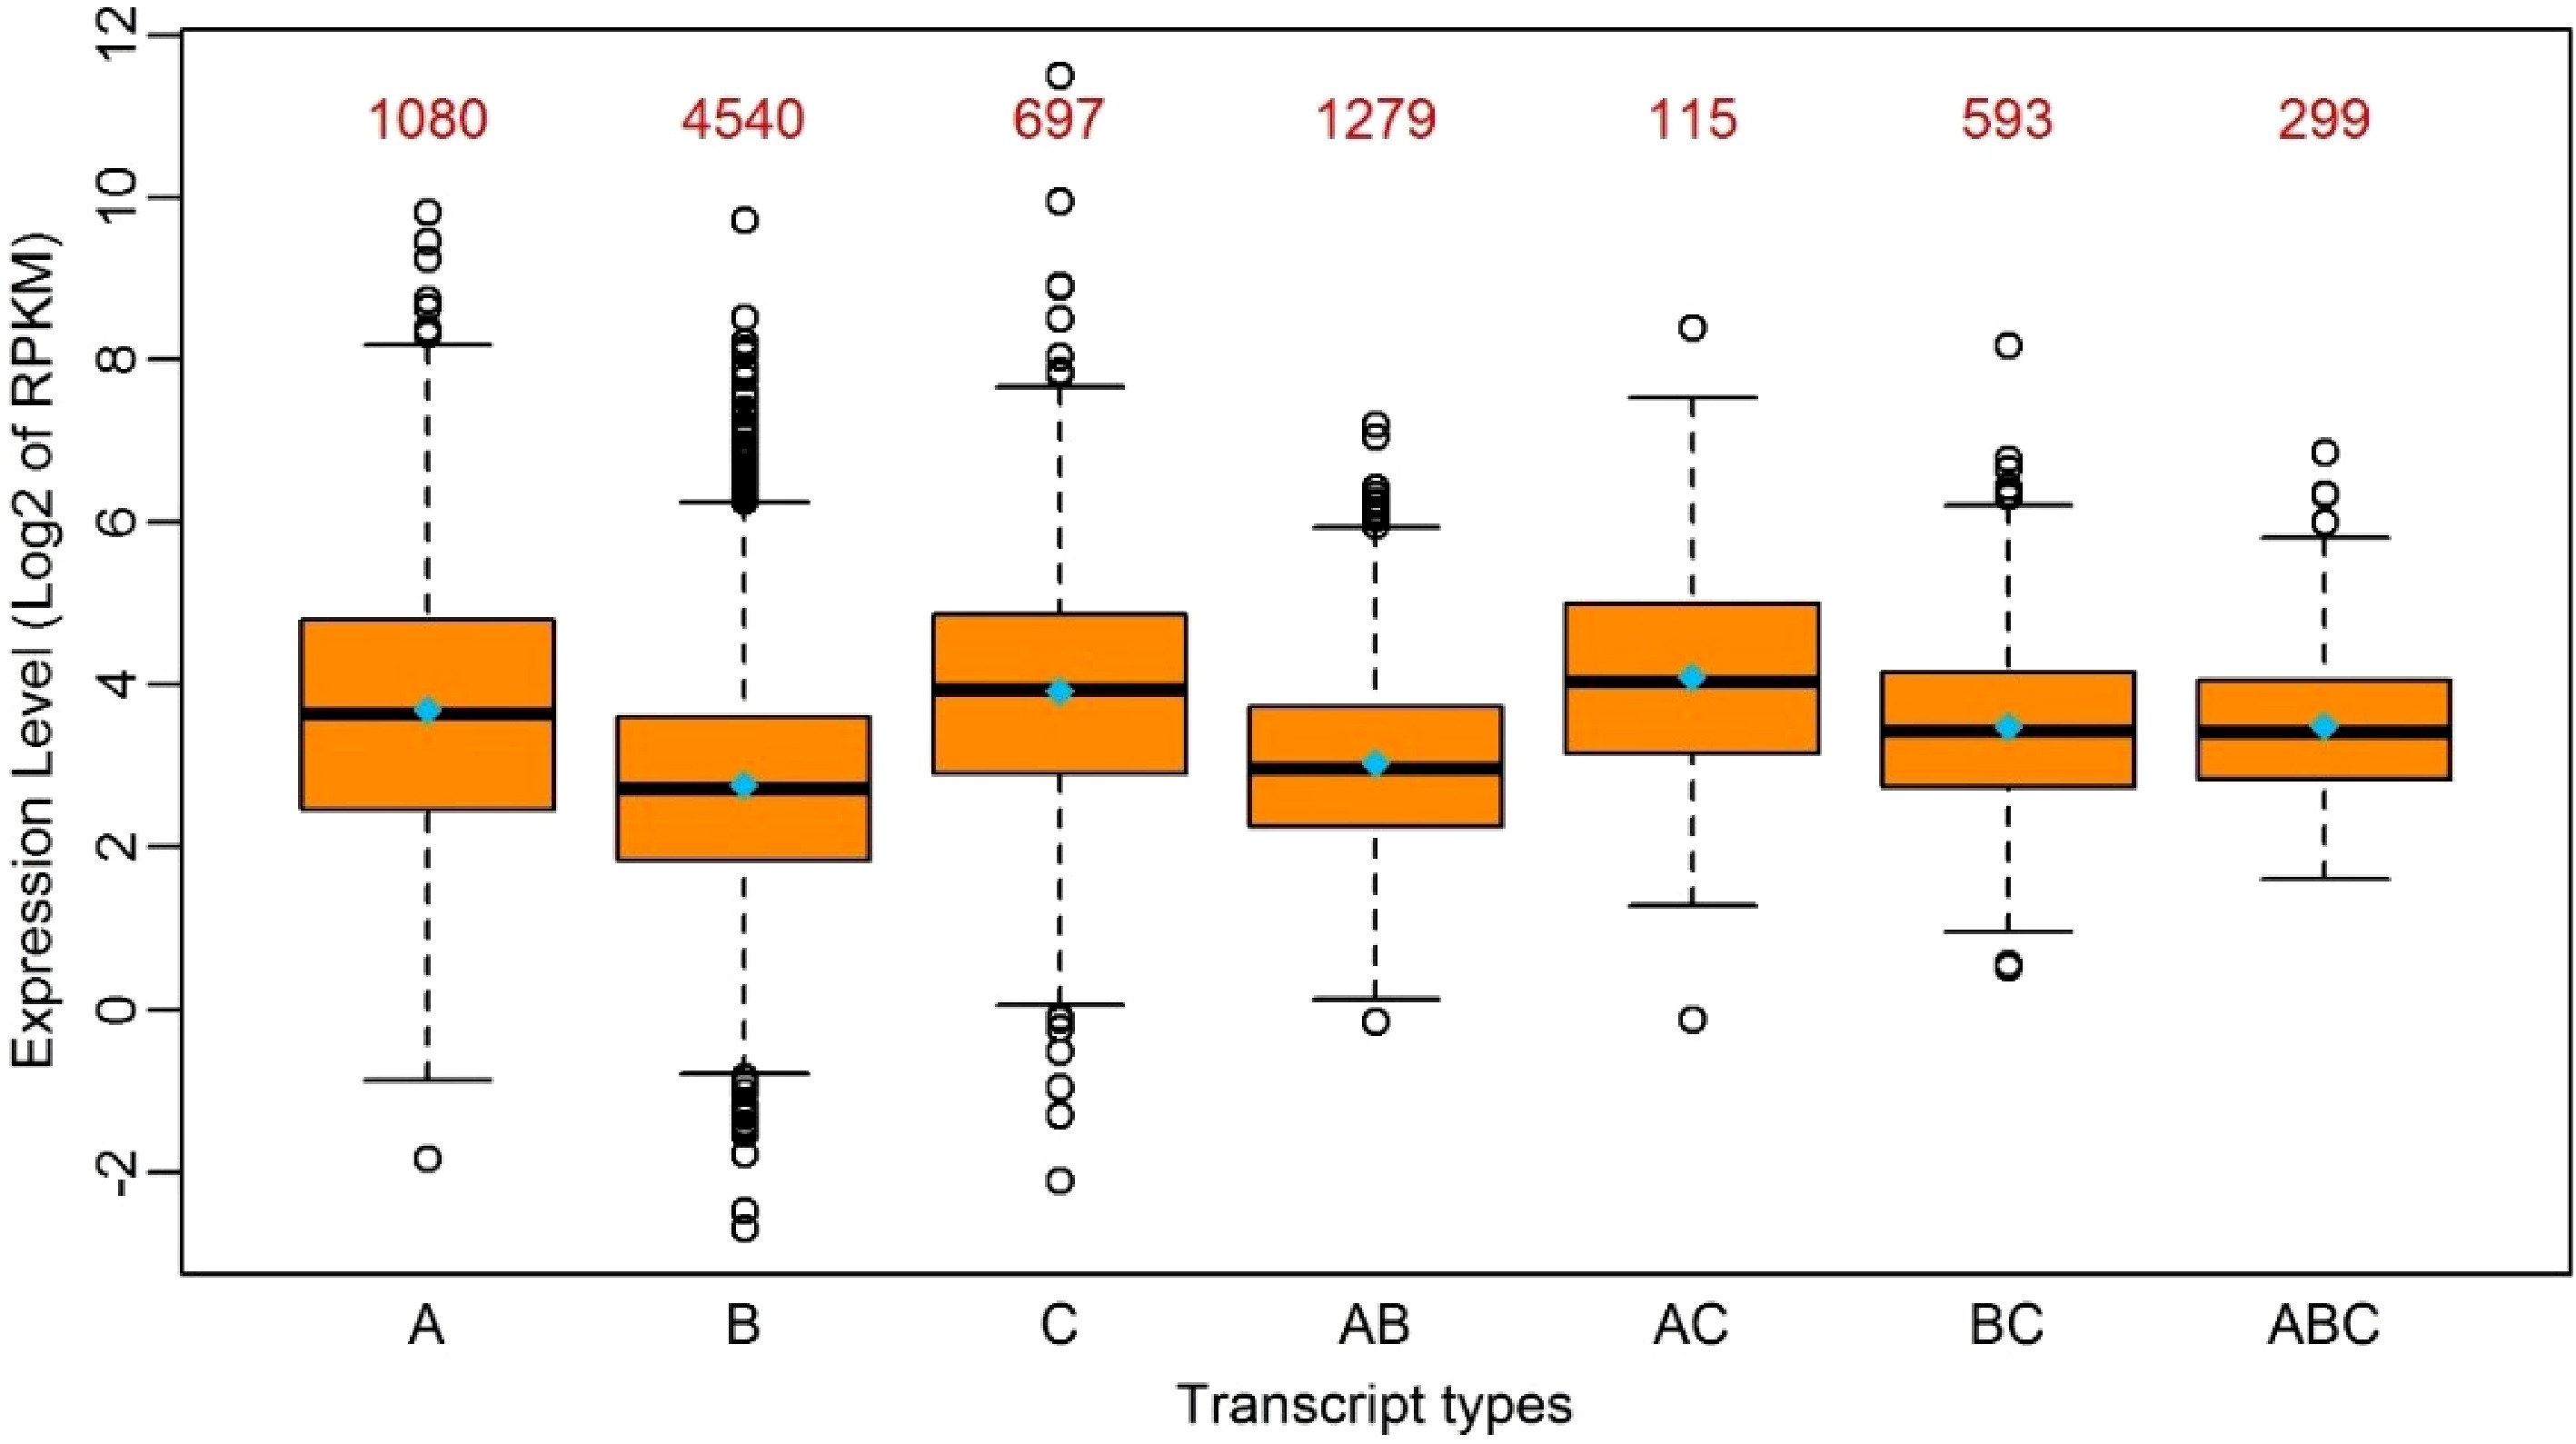
Figure 2. Boxplot of the expression levels of edited transcripts in seven groups. A: Transcripts with RNA-editing only in 5’UTR; B: Transcripts with RNA-editing only in the coding region; C: Transcripts with RNA-editing only in 3’UTR; AB: Transcripts with RNA-editing in 5’UTR and the coding region simultaneously; AC: Transcripts with RNA-editing in 5’UTR and 3’UTR simultaneously; BC: Transcripts with RNA-editing in the coding region and 3’-UTR simultaneously; ABC: Transcripts with RNA-editing in 5’UTR, the coding region and 3’UTR simultaneously. The median and the mean of each group is represented by a horizontal bar and diamond, respectively. The numbers above the boxes represent the numbers of the transcripts in each group.
-
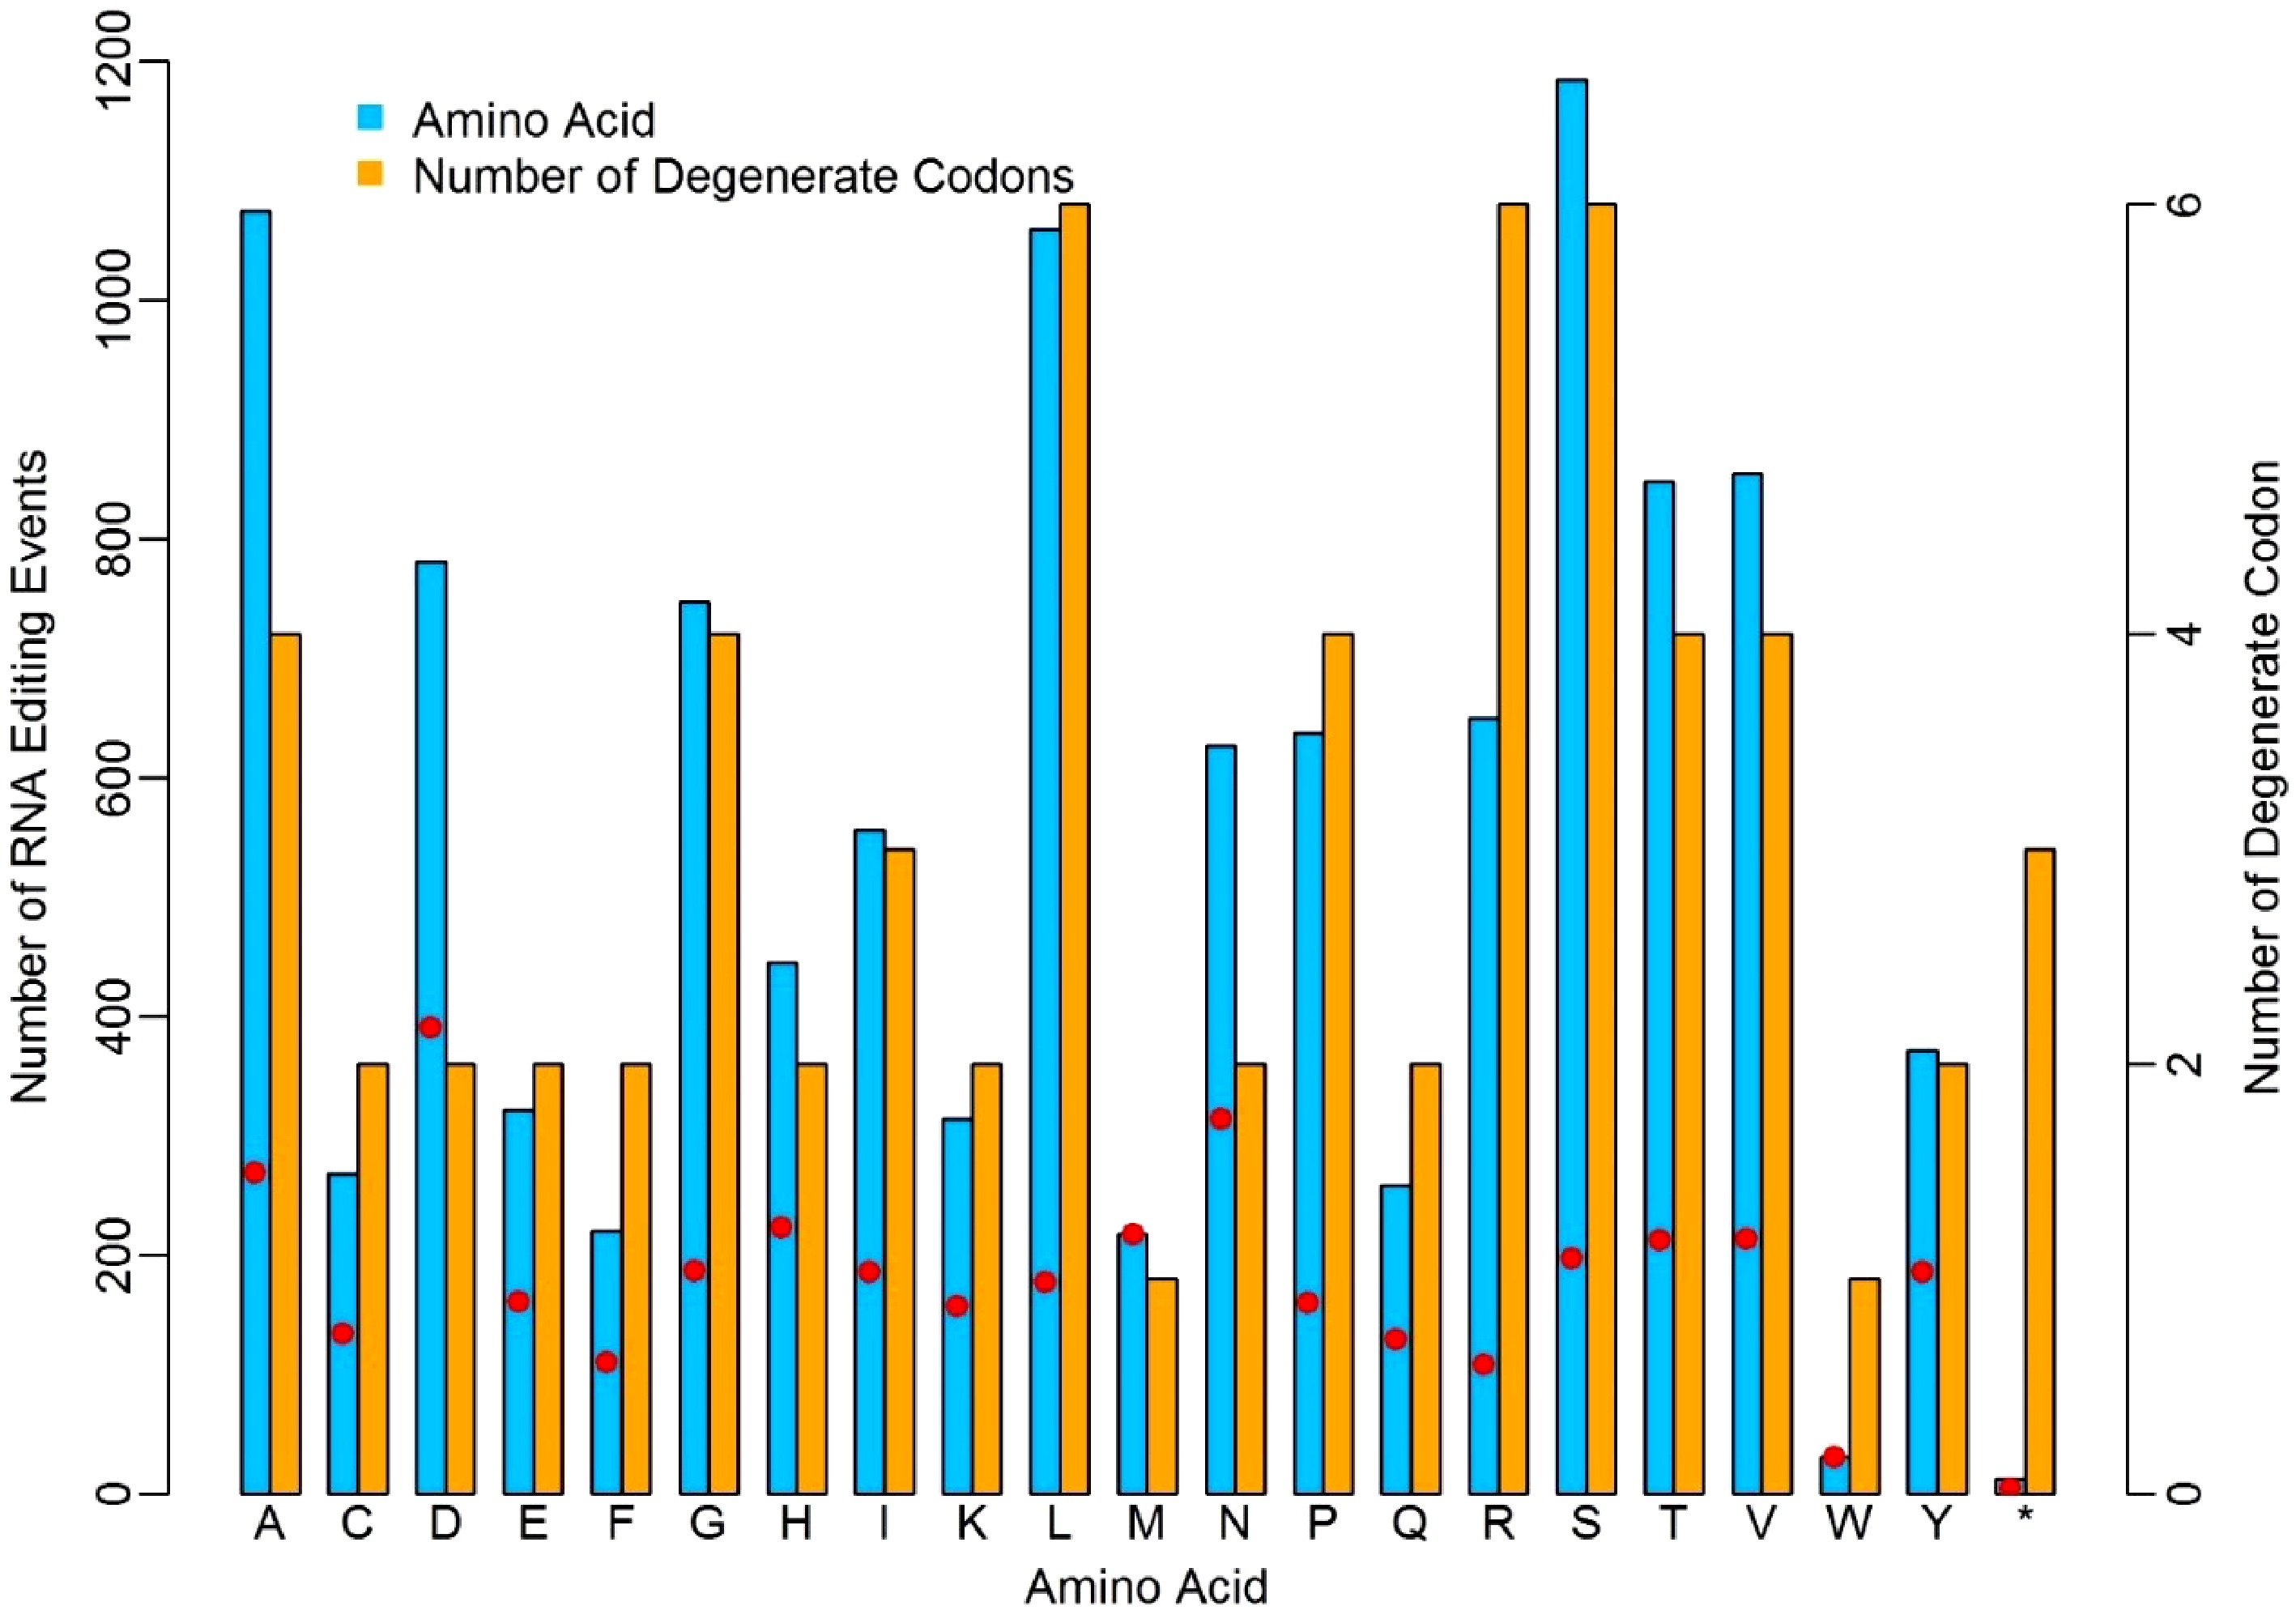
Figure 3. Distinct discrepancy of nuclear RNA-editing events in relation to different amino acids. The red dots represent the ratios of editing sites to the number of degenerate codons.
-
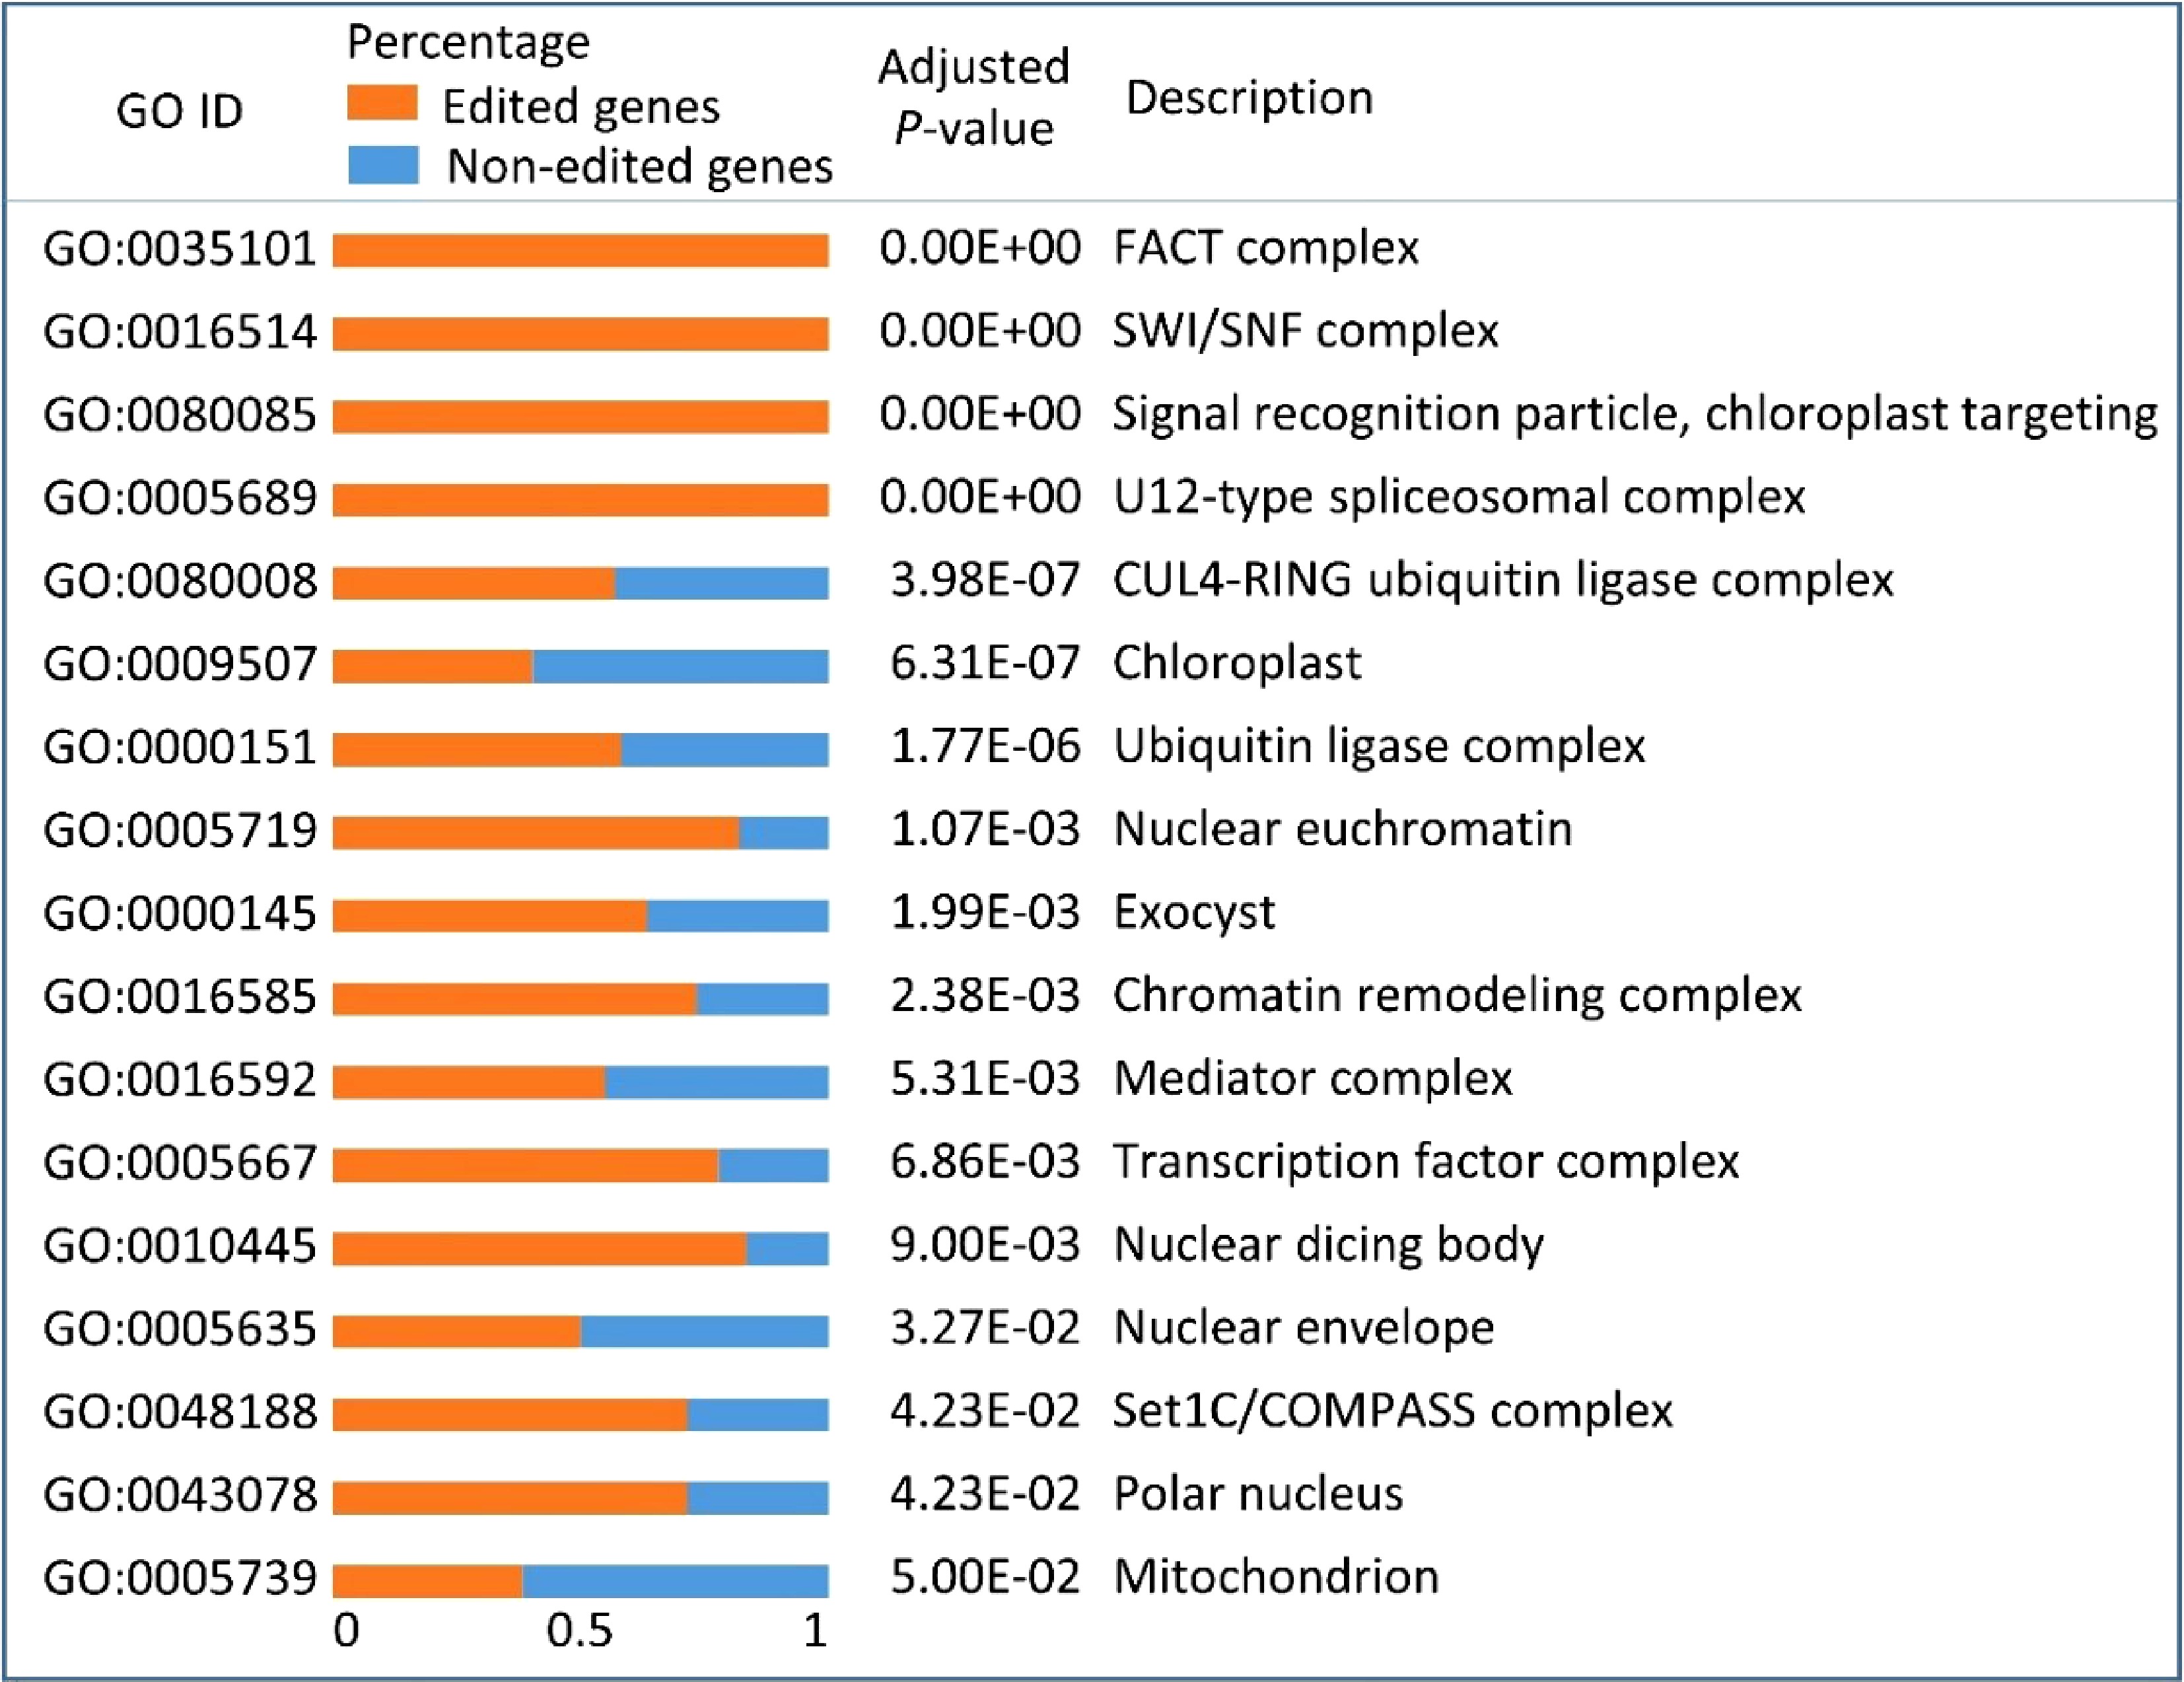
Figure 4. Gene ontology (GO) enrichment results of all the edited genes in Populus trichocarpa nuclei. Orange bars and blue bars represent the percentages of edited genes and non-edited genes, respectively, in each GO category.
-
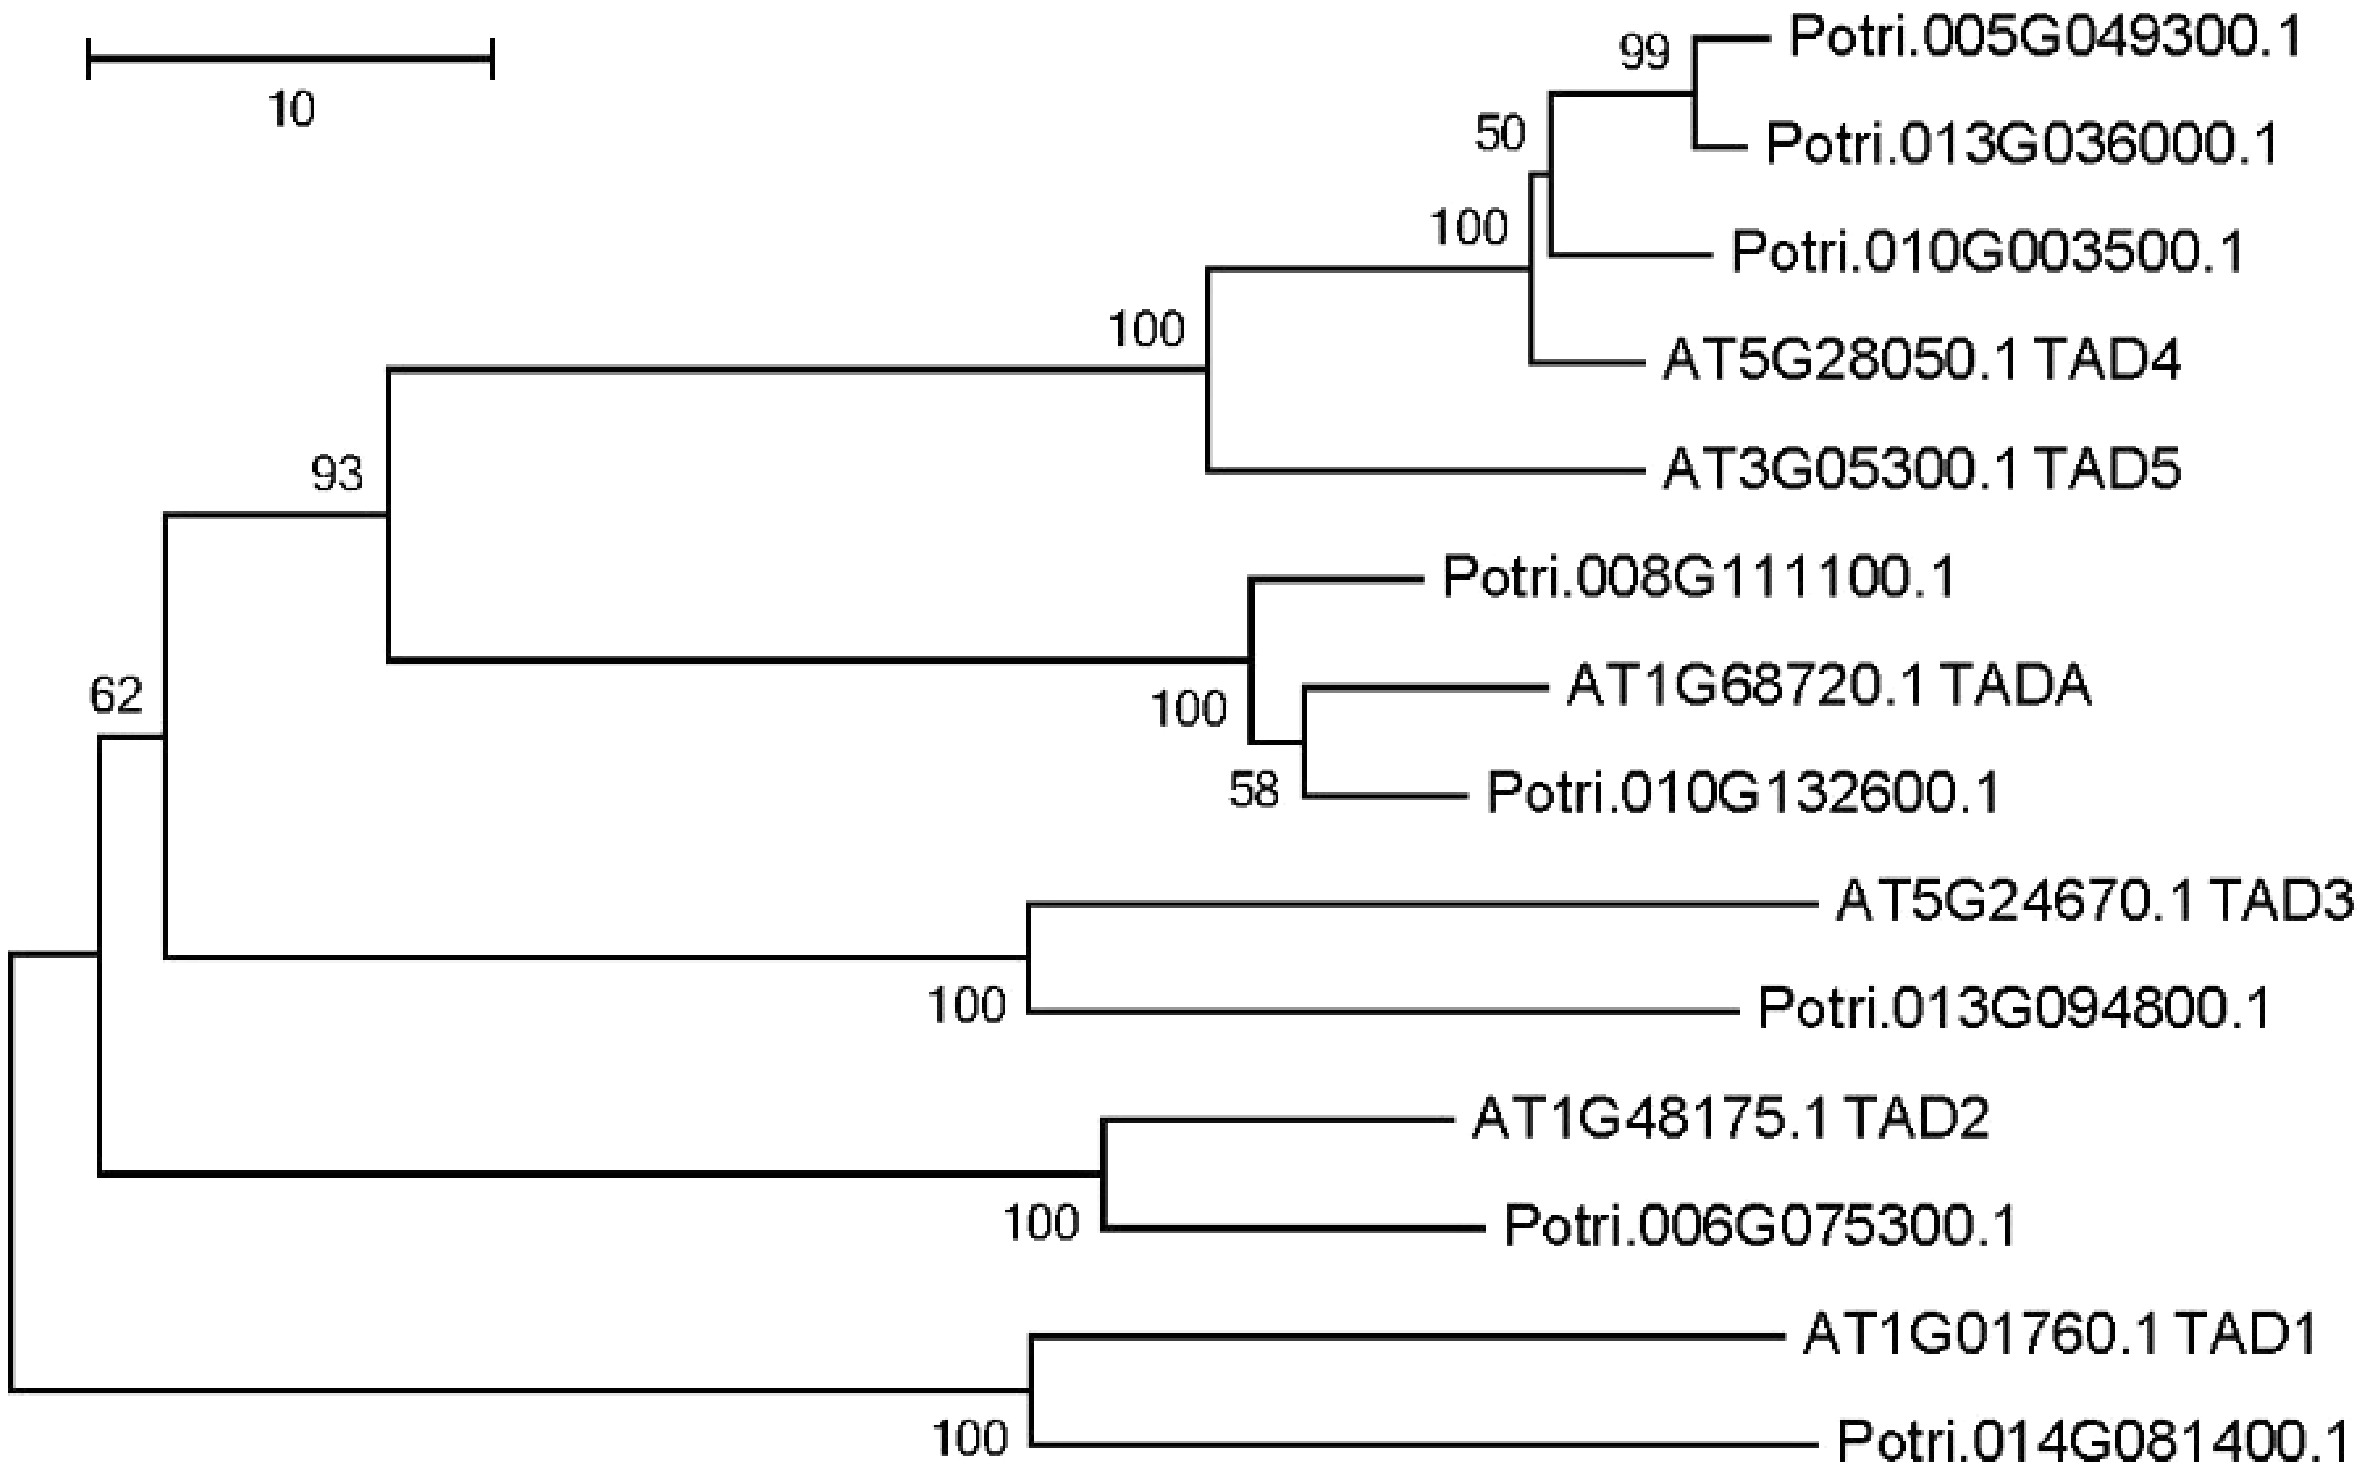
Figure 5. Phylogenetic tree analysis of putative adenosine deaminases in the Populus trichocarpa and A. thaliana nuclear genome. Protein sequences were aligned with ClustalW, and MEGA was used to construct the phylogenetic tree based on the neighbor-joining method with 1,000 bootstrap replications.
-
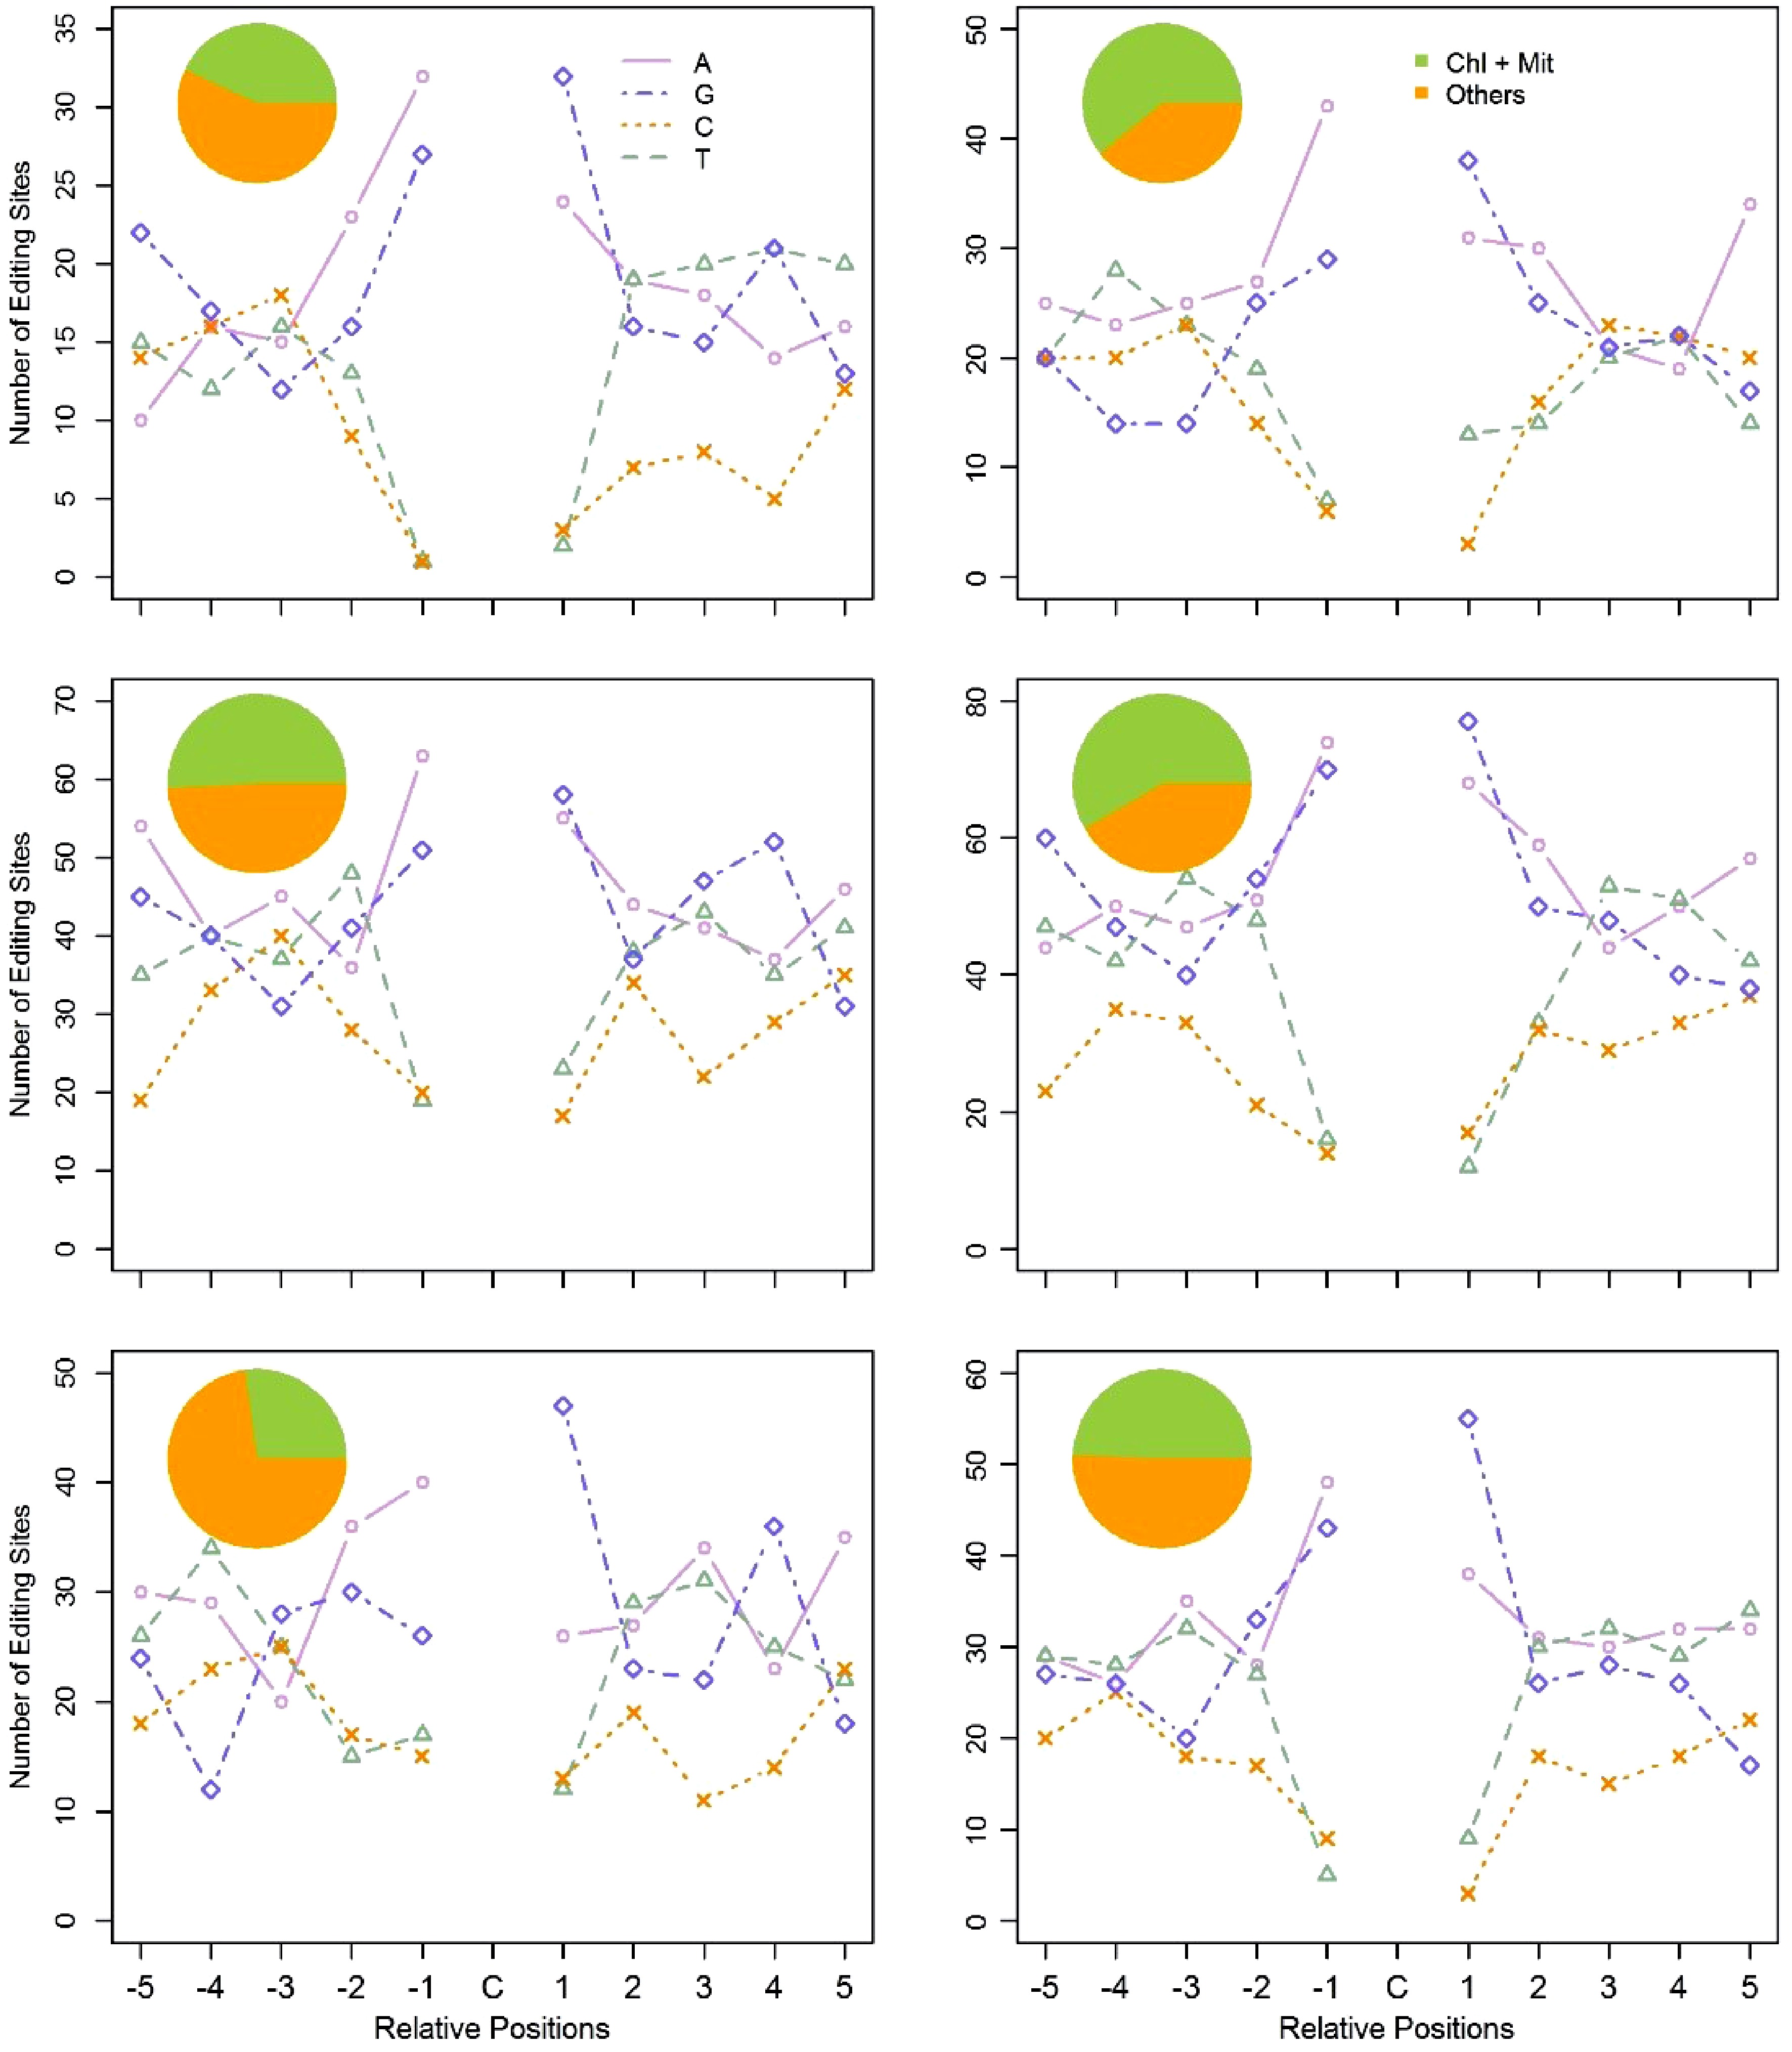
Figure 6. Flanking sequences of the edited C residues, and subcellular location of the edited genes in the six clusters. Using the coexpression based method, we clustered PPR genes and the C-to-U edited genes into six clusters. The pie chart represents the subcellular location of the C-to-U edited genes in each cluster. The line chart represents the ten adjacent bases of the edited C residues in each cluster. For the X axis, C represents the edited C residues; -5 to -1 represent the five upstream bases of the edited C residues; 1 to 5 represent the five downstream bases of the edited C residues. The Y axis represents the number of RNA-editing sites in each cluster.
-
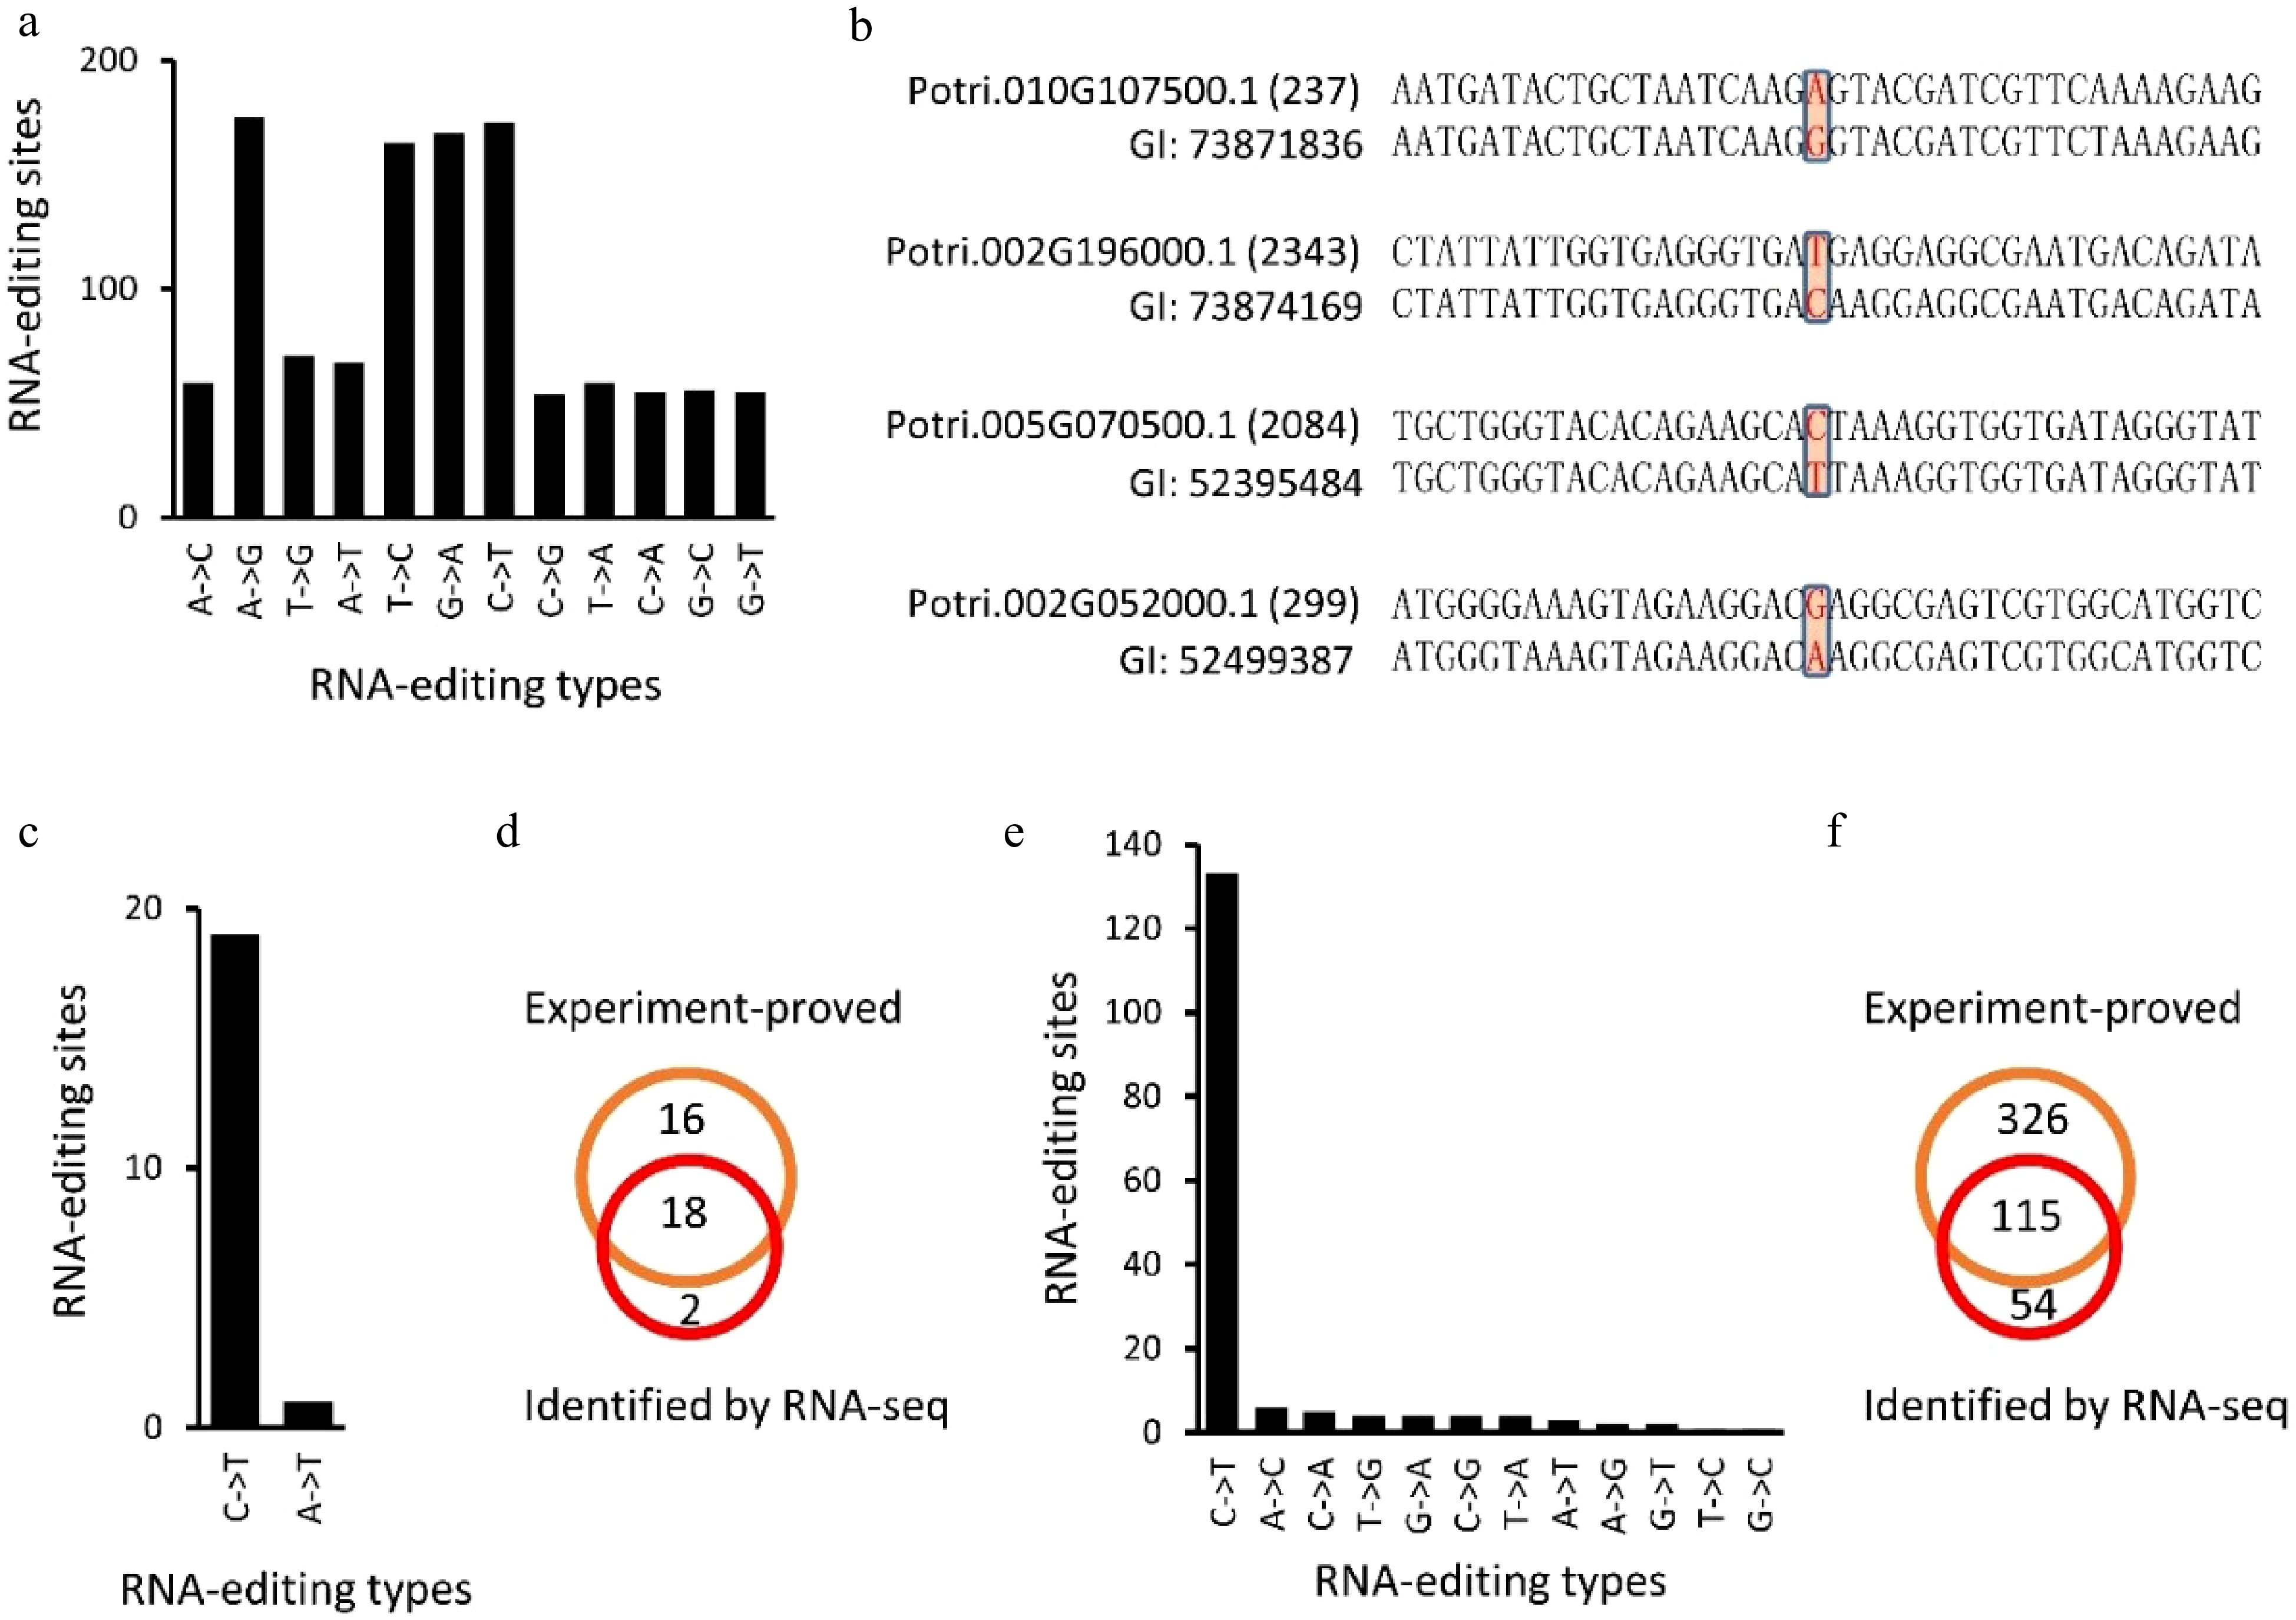
Figure 7. Identification of RNA-editing sites using expressed sequence tags (EST) of Populus trichocarpa (Nisqually-1). (a), (b), (e) and (f) showed the identified RNA editing sites in P. trichocarpa while (c) and (d) showed the RNA editing sites identified in A. thaliana chloroplasts that have been experimentally verified (Fig. 7c, d).
-

Figure 8. A model of the establishment of plant organelles and possible roles of RNA-editing during this process. Protein complexes or cellular components with red dots indicated they were subjected to RNA-editing. At the beginning of endosymbiosis (1), the plant ancestral cell engulfed a prokaryotic bacterium. (2) Upon engulfment, plant ancestral cells performed significant intracellular remodeling, which altered the nuclear membrane, the protein degradation system and the chromatin remodeling system, to embrace this bacterium. (3) After successful establishment of organelles, the genome of the organelle was significantly smaller compared to its ancestor. HGT: horizontal gene transfer. CRC: chromatin remodeling complex. UPS: ubiquitin-proteasome system. SPR: signal recognition particle, chloroplast targeting.
-
Cluster ID Number of edited genes Number of PPRs 1 51 4 2 75 4 3 115 5 4 151 15 5 66 8 6 88 10 Table 1. Number of PPR genes and C-to-U edited genes in each cluster.
-
Gene Genome position DNA RNA Position within the codon Confirmed atpF ArthCp008 1,207 C T 2 Yes rpoB ArthCp014 25,992 C T 2 Yes rpoB ArthCp014 25,779 C T 2 yes rpoB ArthCp014 23,898 C T 2 yes ycf9 ArthCp019 35,800 C T 2 Yes rps14 ArthCp020 37,161 C T 2 Yes rps14 ArthCp020 37,092 C T 2 Yes accD ArthCp031 57,868 C T 2 Yes psbF ArthCp038 63,985 C T 2 Yes psbE ArthCp039 64,109 C T 2 Yes rps18 ArthCp044 67,930 A T 2 New clpP ArthCp048 69,942 C T 1 Yes rpoA ArthCp055 78,691 C T 2 Yes ndhD ArthCp074 117,166 C T 2 Yes ndhD ArthCp074 116,785 C T 2 yes ndhD ArthCp074 116,494 C T 2 yes ndhD ArthCp074 116,290 C T 2 yes ndhD ArthCp074 116,281 C T 2 yes ndhG ArthCp077 118,858 C T 2 yes ndhI ArthCp078 119,549 C T 1 New Table 2. Identified RNA-editing sites in the A. thaliana chloroplast.
Figures
(8)
Tables
(2)