-

Figure 1. Effect of nitrate treatments on the phenotype of roots, scale bar = 1 cm. (a) The root numbers, root length, root volume, root surface area, and root projection area were measured after five weeks of nitrate treatment. (b) B9 apple rootstock nursery plants grown on 1/2 strength Hoagland solution without nitrate served as control plants, for treatment, the amount of nitrate are as a follows: T1, 2.25 mM L−1; T2, 9 mM L−1; T3, 18 mM L−1; T4, 36 mM L−1; and T5, 72 mM L−1. Error bars refer to the average value ± SD from three biological replicates. Asterisks indicate significant differences at * p < 0.05, ** p < 0.01, *** p < 0.001, and **** p < 0.0001.
-
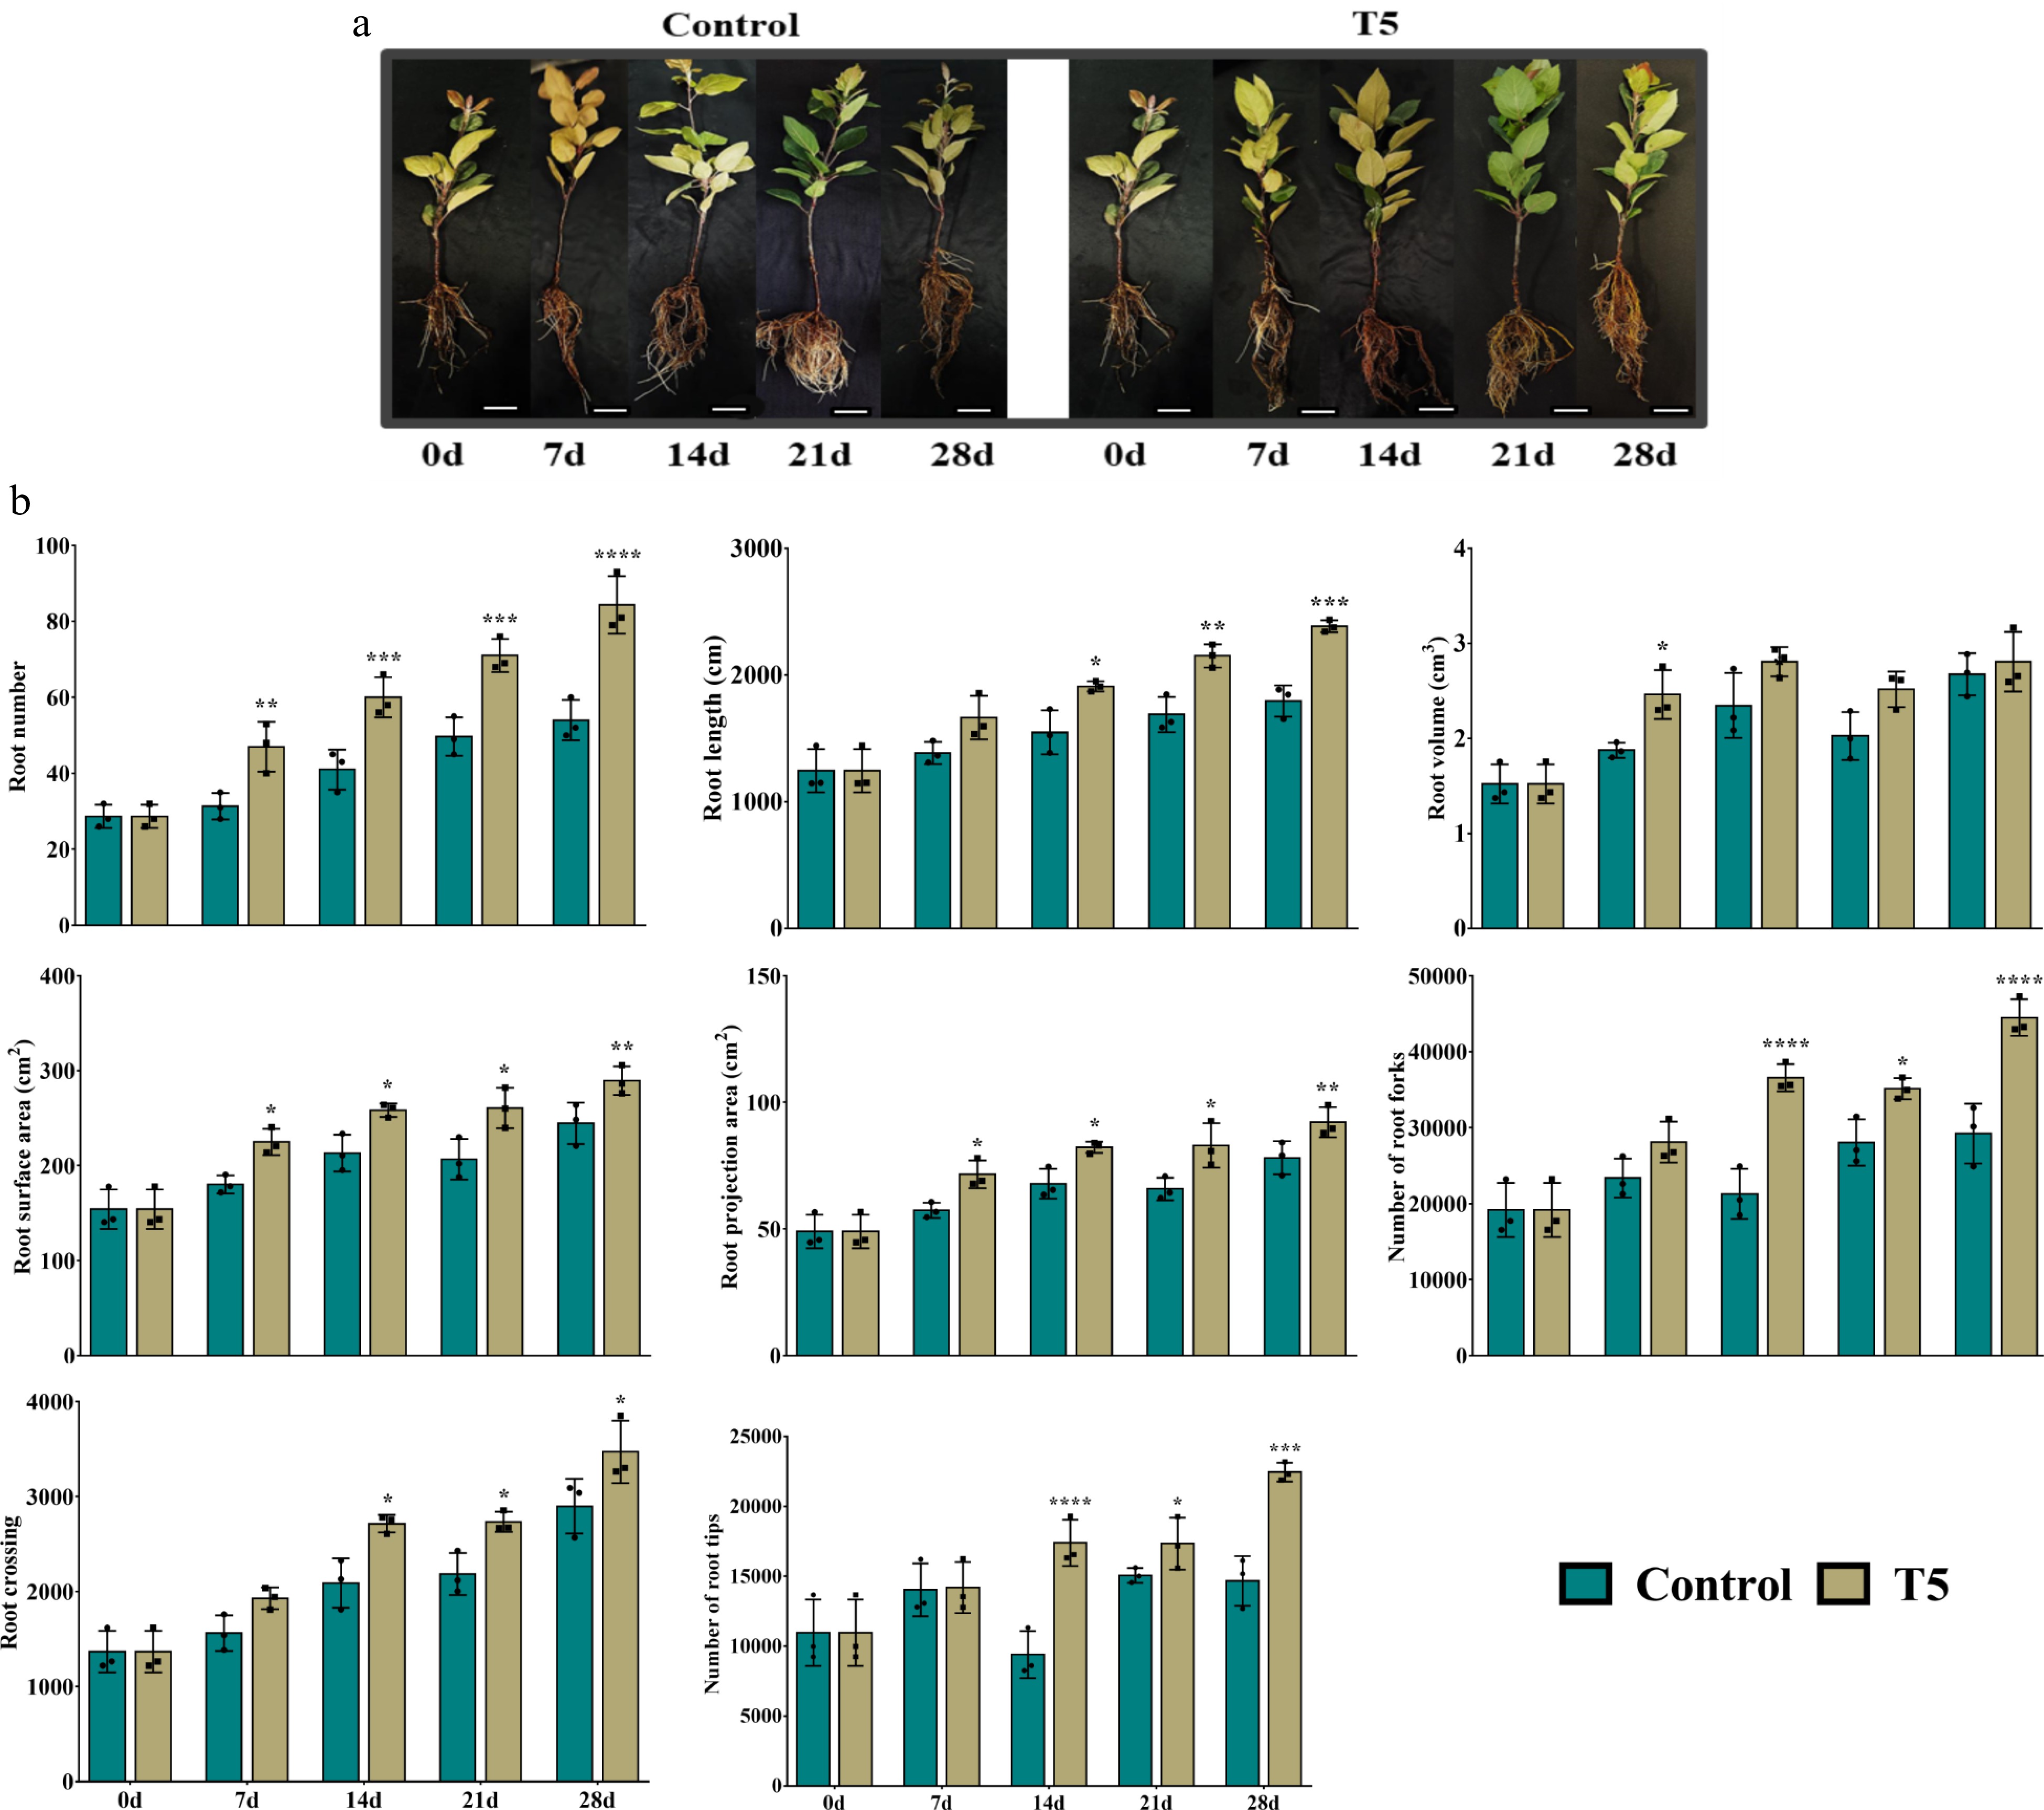
Figure 2. Effect of nitrate treatment (control and T5, 72 mM L-1) on the phenotype of roots, scale bar = 1 cm. (a) The root numbers, root length, root volume, root surface area, root projection area, number of root forks, root crossing, and number of root tips were measured at different time points (0 d, 7 d, 14 d, 21 d, and 28 d). Asterisks indicate significant differences at * p < 0.05, ** p < 0.01, *** p < 0.001, and **** p < 0.0001.
-
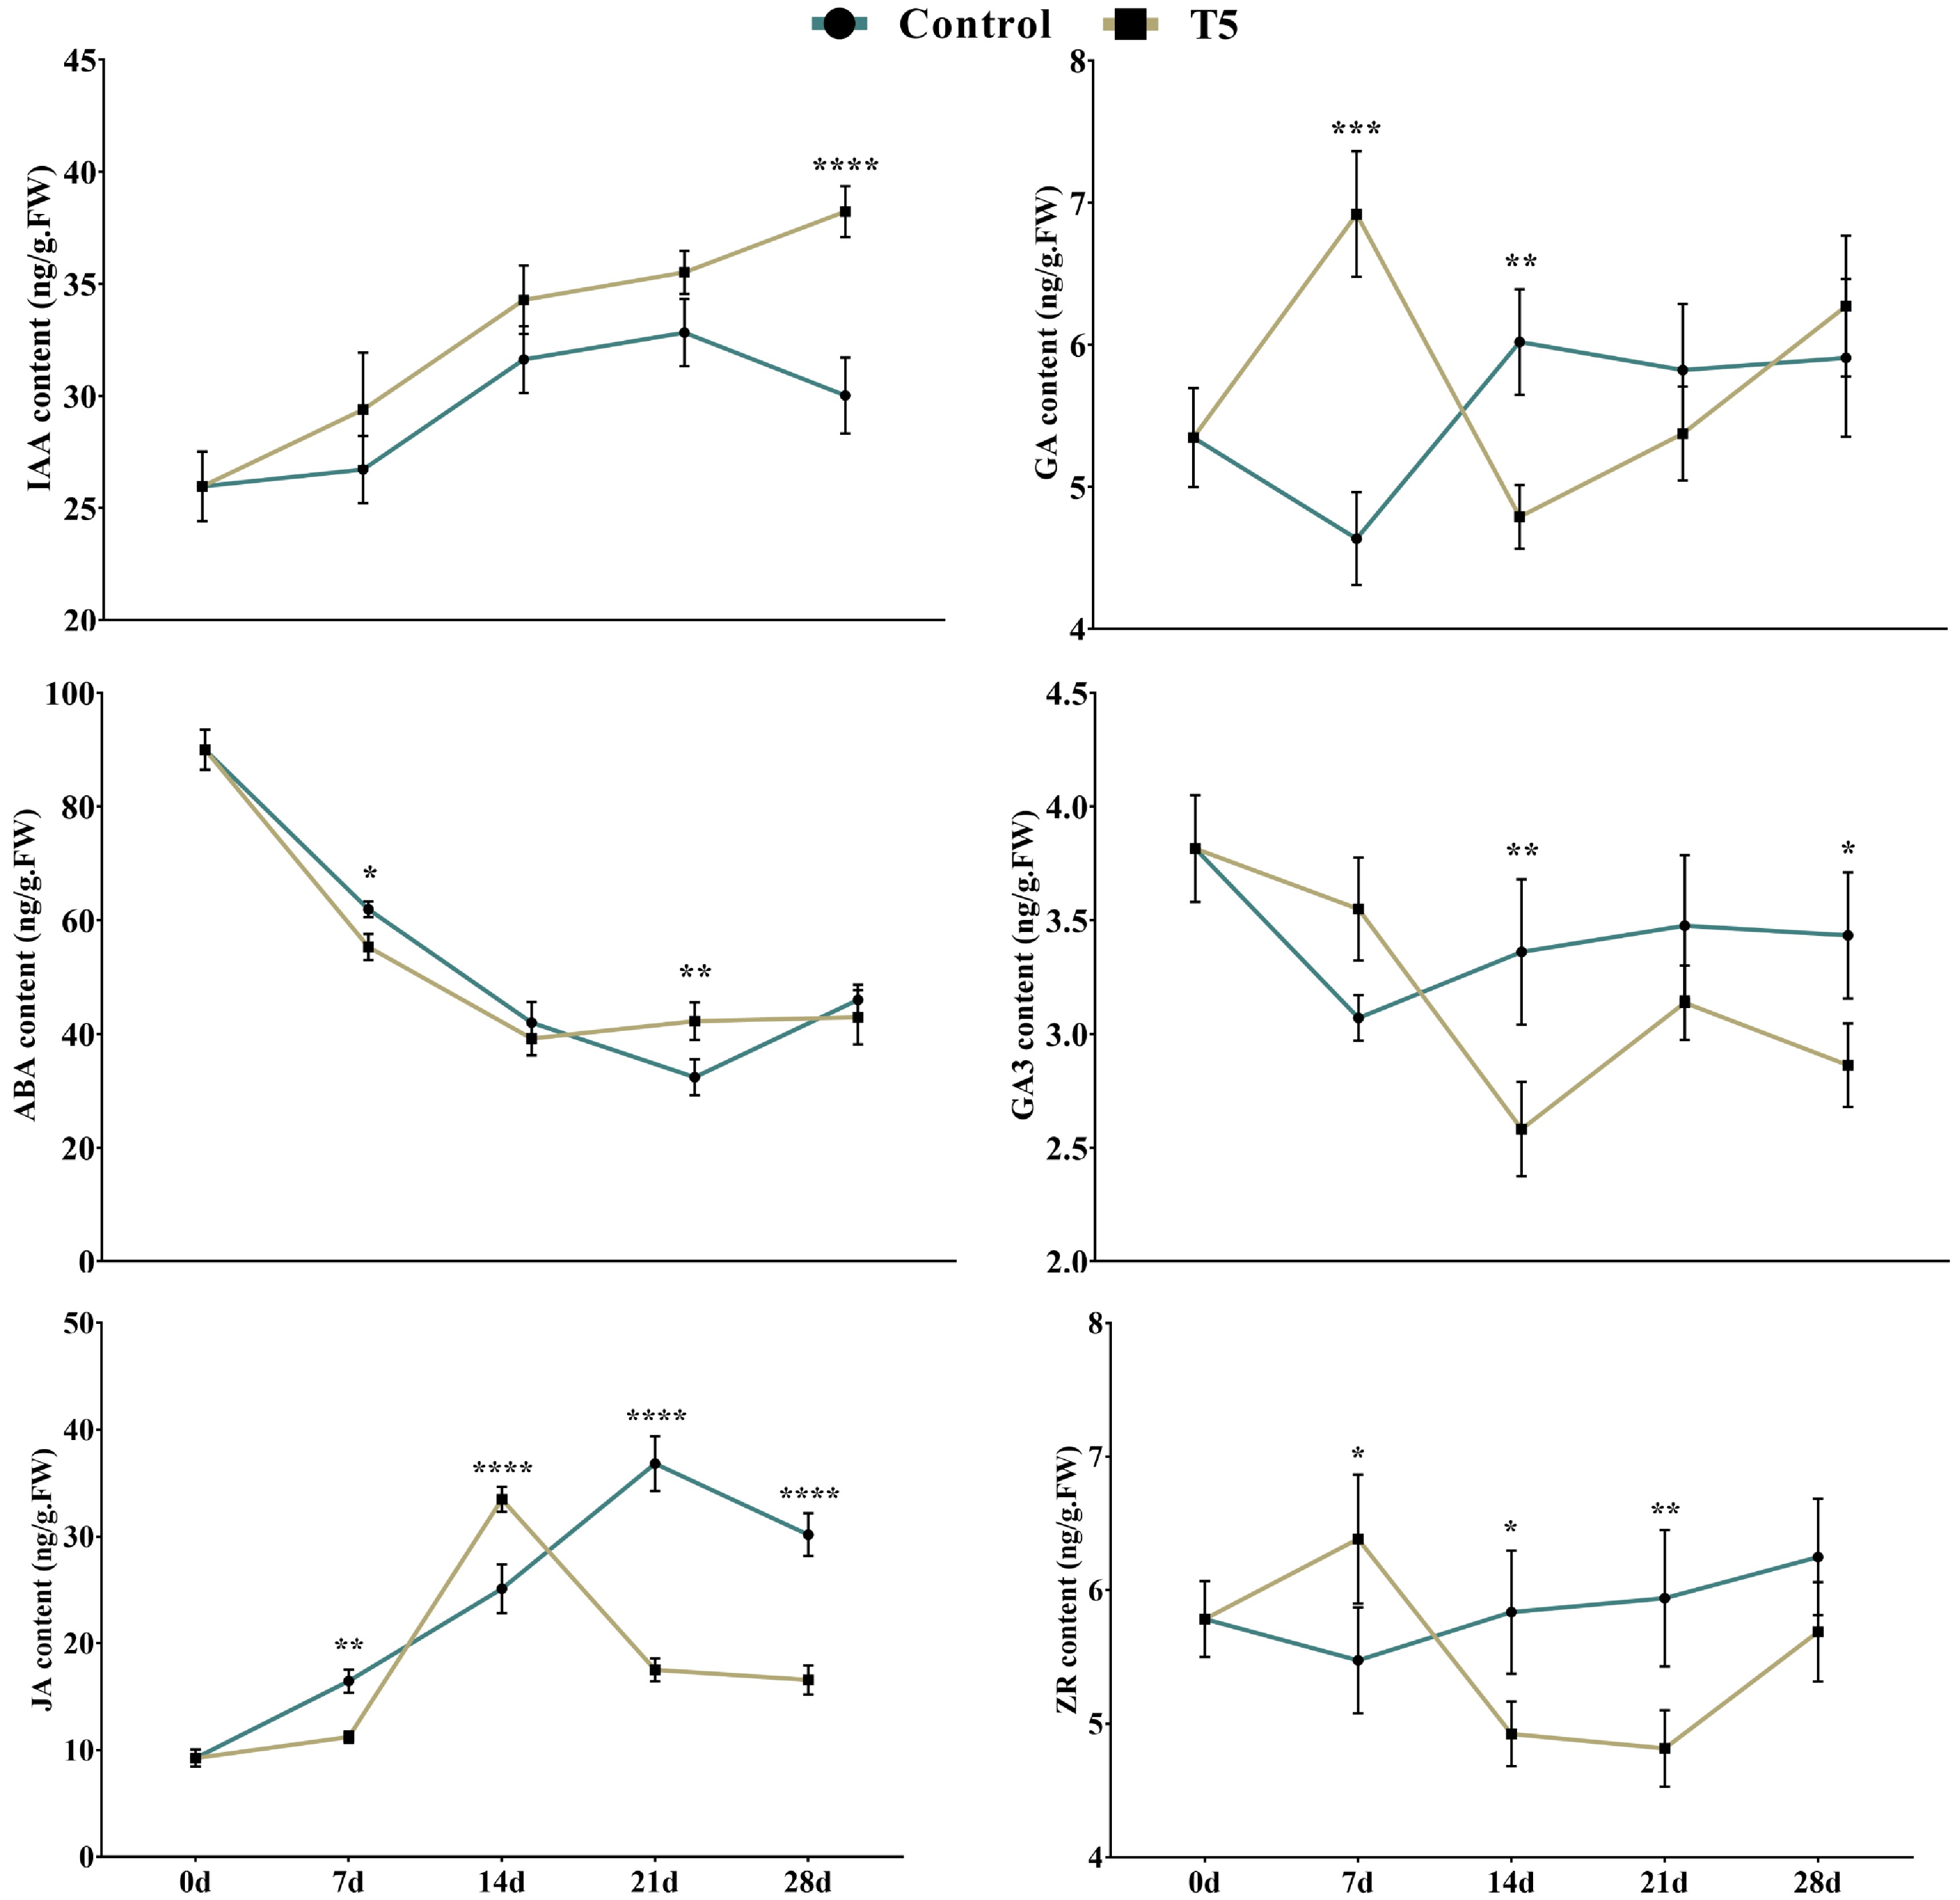
Figure 3. Effect of nitrate treatment (control and T5, 72 mM L-1) on the IAA: indole acetic acid, GA: gibberellic acid, ABA: abscisic acid, GA3: gibberellic acid 3, JA: jasmonic acid. ZR: zeatin riboside. Error bars denote an average value of ± SD from three biological replicates. Asterisks indicate significant differences at * p < 0.05, ** p < 0.01, *** p < 0.001, and **** p < 0.0001.
-

Figure 4. Effect of nitrate treatment (control and T5, 72 mM L-1) on the relative expression of nitrate-related genes over the study period (0 d, 7 d, 14 d, 21 d, and 28 d) during LR development. Error bars refer to the average value ± SD from three biological replicates. Asterisks indicate significant differences at * p < 0.05, ** p < 0.01, *** p < 0.001, and **** p < 0.0001.
-
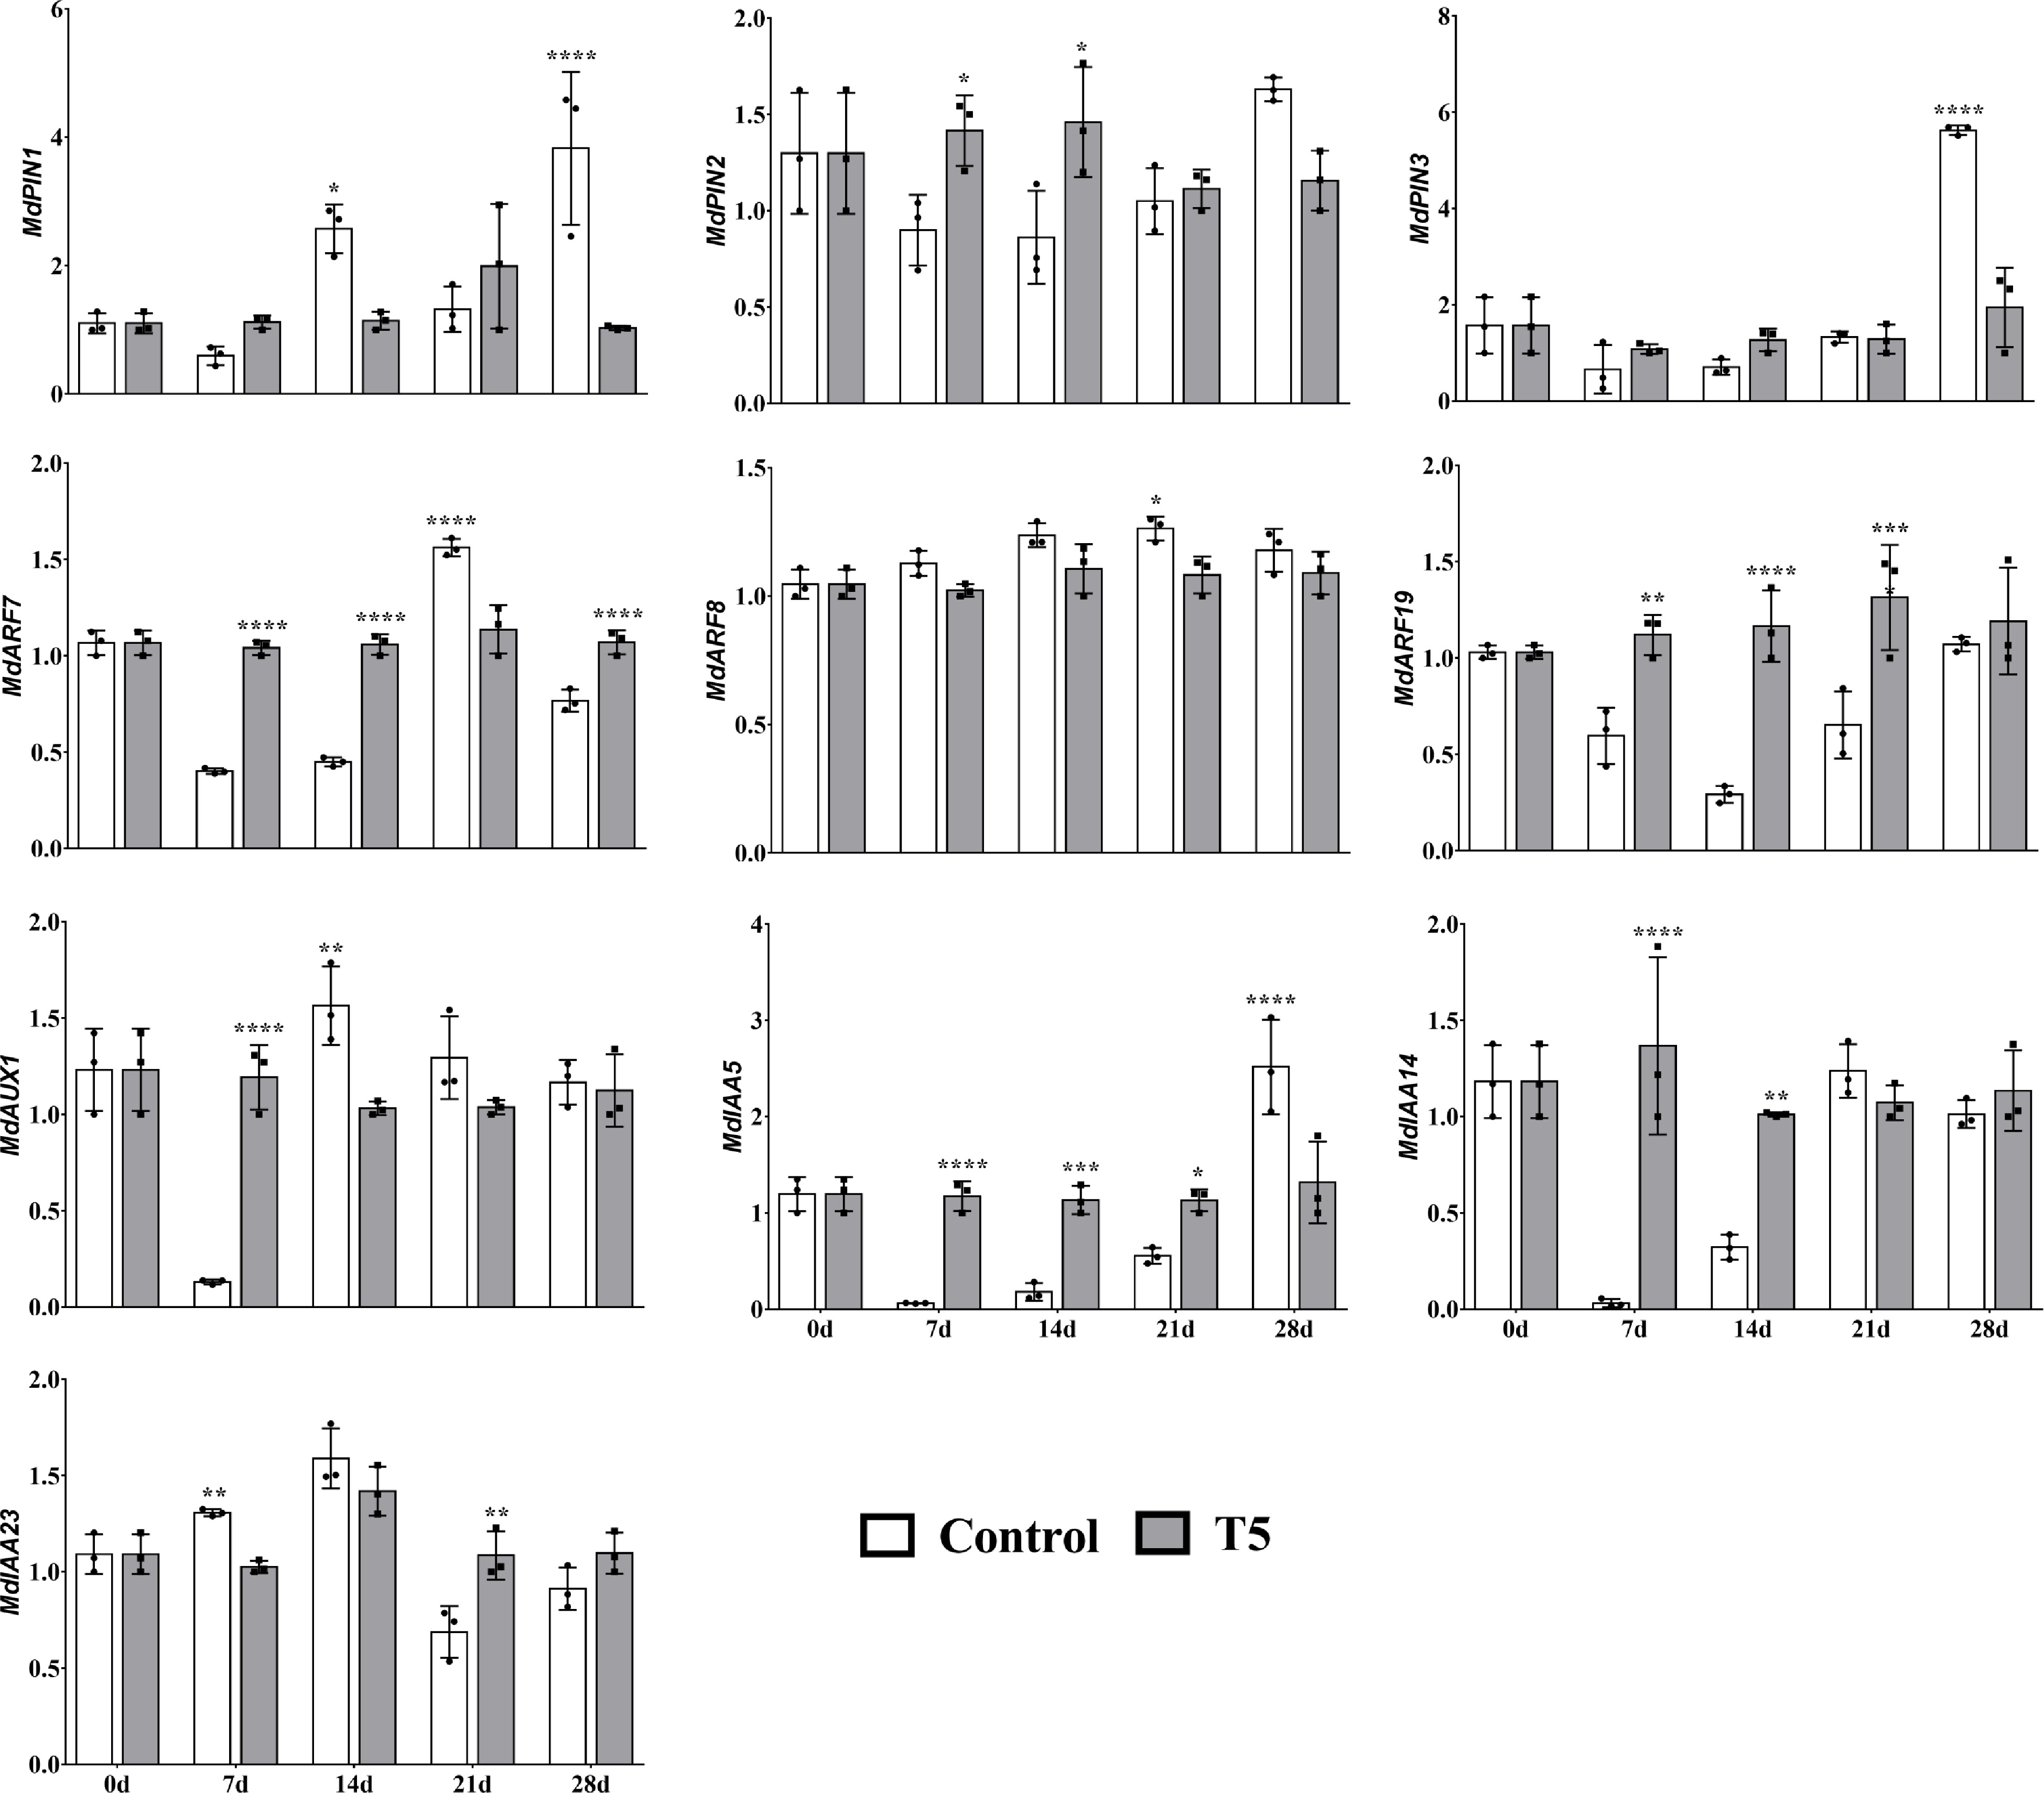
Figure 5. Effect of nitrate treatment (control and T5, 72 mM L-1) on the relative expression of IAA-related genes over this study's time course (0 d, 7 d, 14 d, 21 d, and 28 d) during LR development. Error bars refer to the average value ± SD from three biological replicates. Asterisks indicate significant differences at * p < 0.05, ** p < 0.01, *** p < 0.001, and **** p < 0.0001.
-
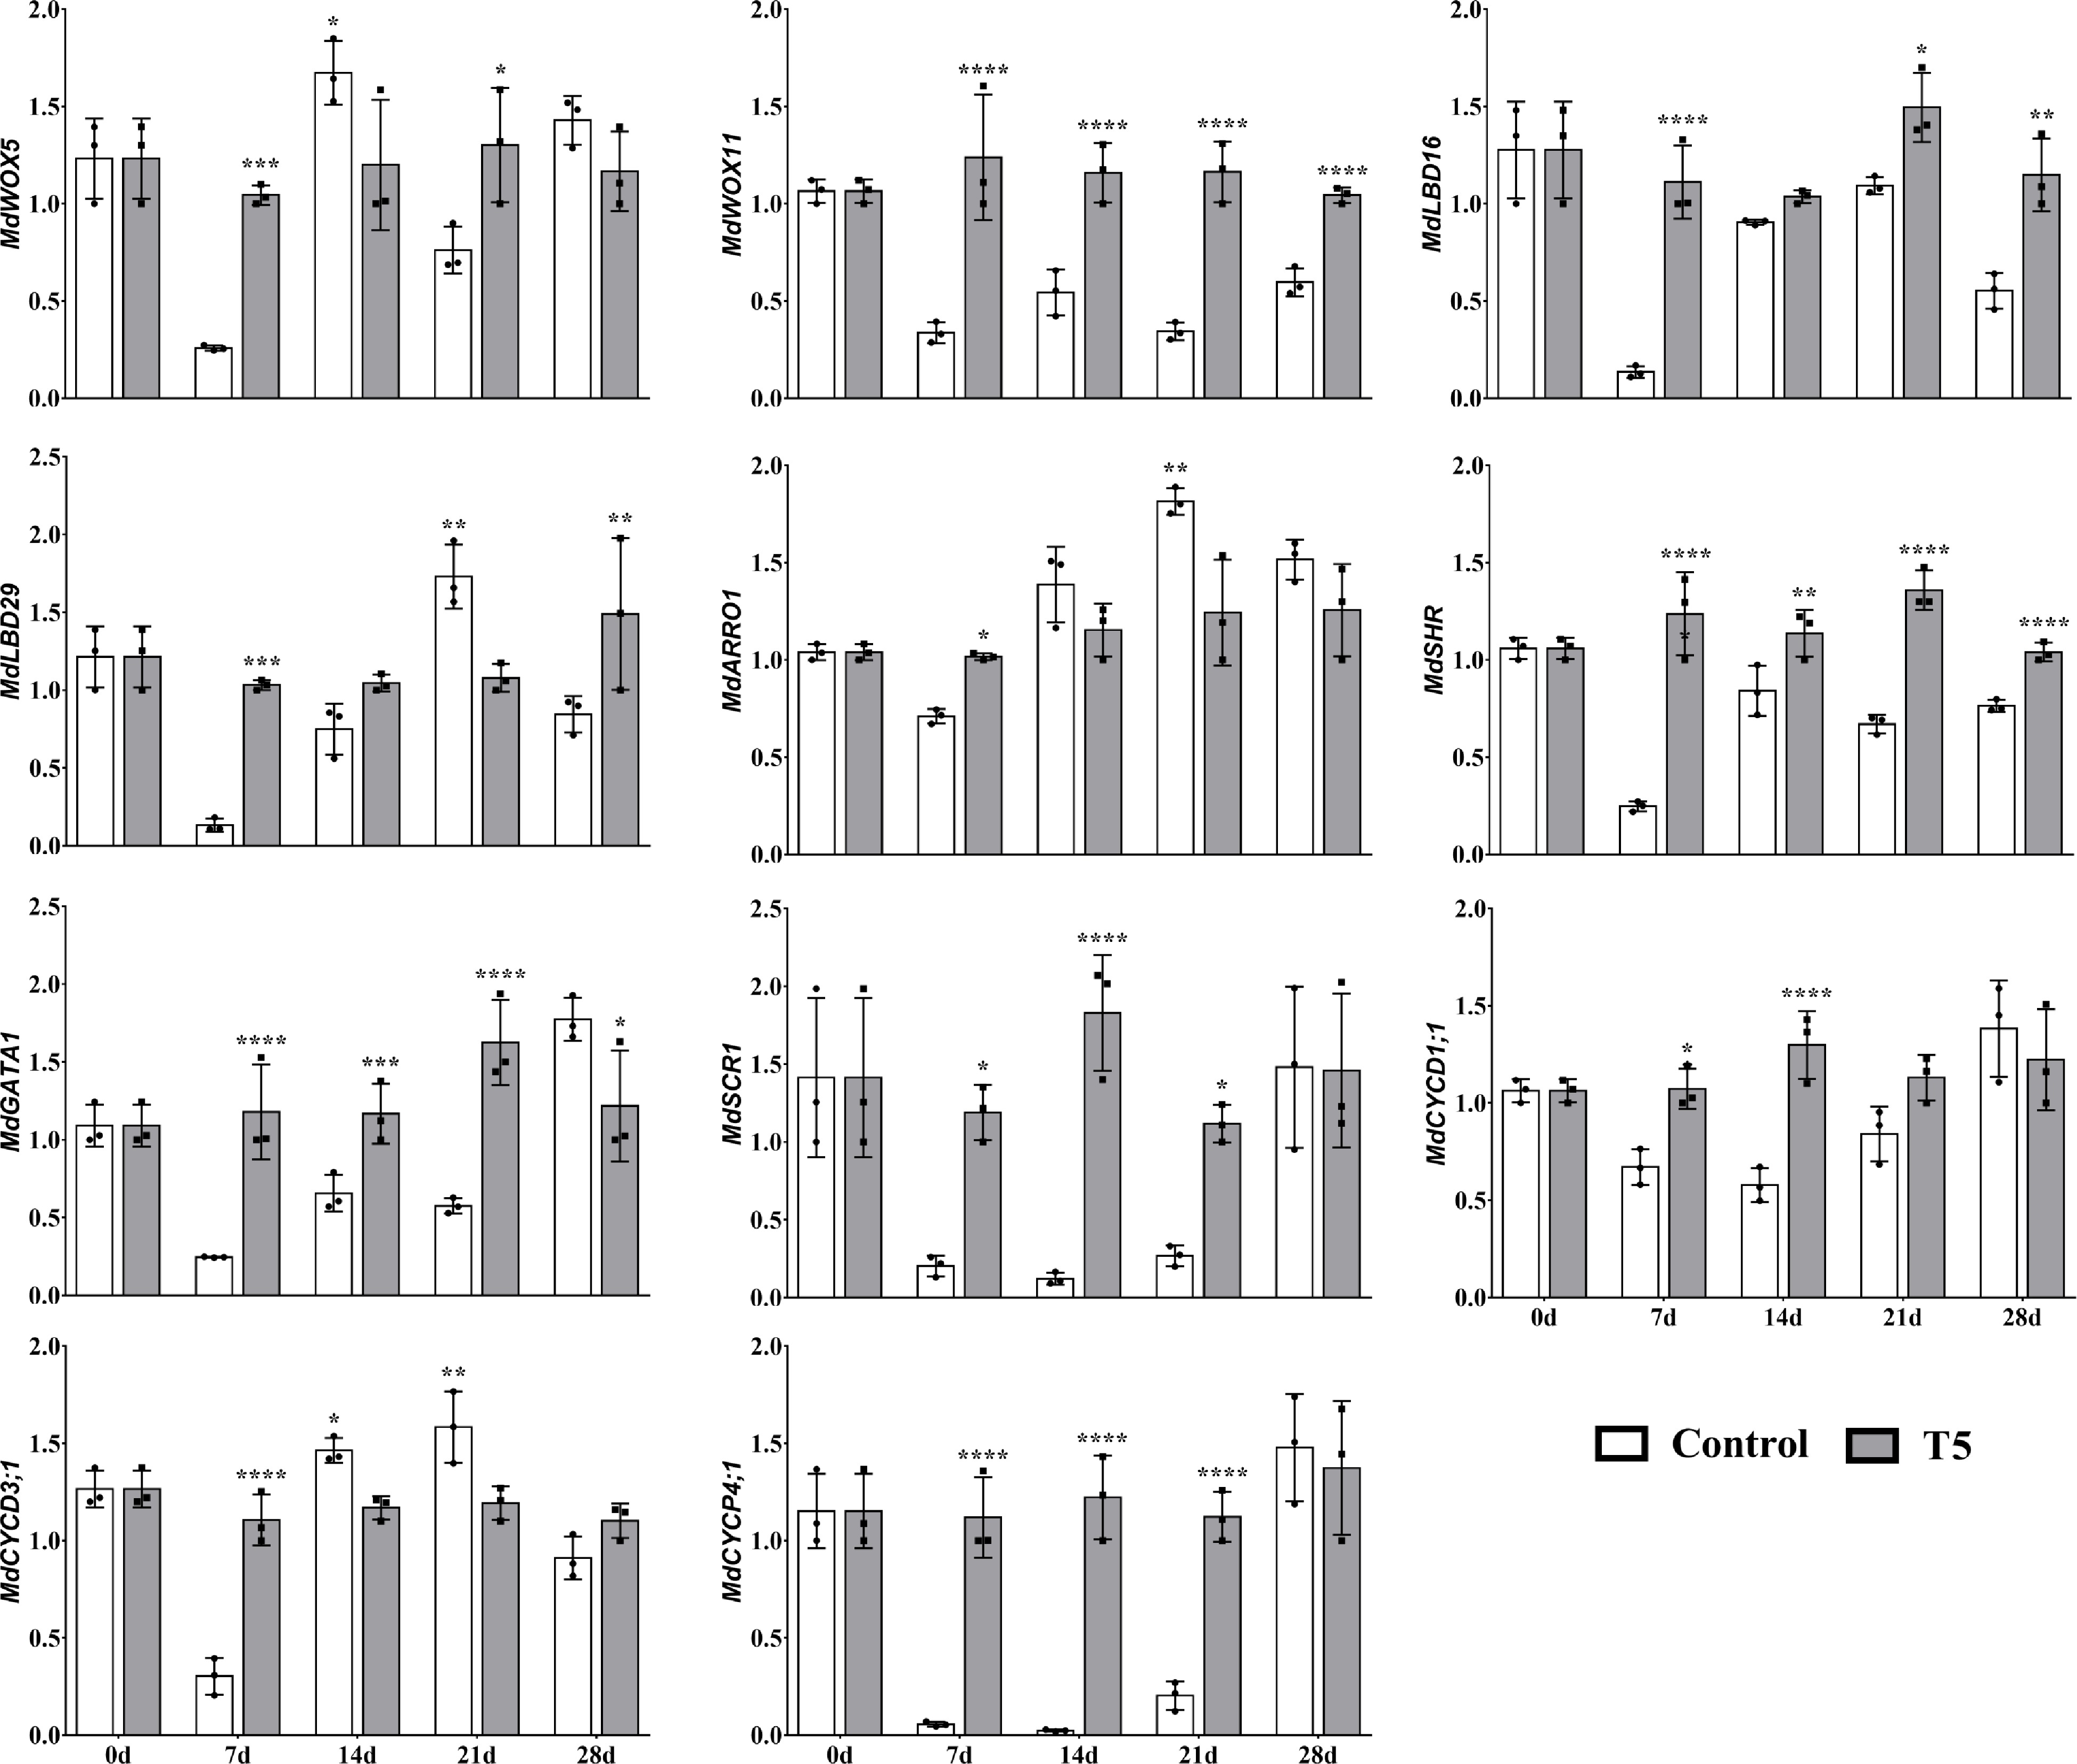
Figure 6. Effect of nitrate treatment (control and T5, 72 mM L-1) on the relative expression of root development- and cell cycle-related genes over the course of the study (0 d, 7 d, 14 d, 21 d, and 28 d) during LR development. Error bars refer to the average value ± SD from three biological replicates. Asterisks indicate significant differences at * p < 0.05, ** p < 0.01, *** p < 0.001, and **** p < 0.0001.
-
Treatments The length of different diameters (cm) The surface area of different diameters (cm2) The volume of different diameters (cm3) 0−0.5 mm 0.5−2 mm 2−4.5 mm > 4.5 mm 0−0.5 mm 0.5−2 mm 2−4.5 mm > 4.5 mm 0−0.5 mm 0.5−2 mm 2−4.5 mm > 4.5 mm CK 1721 ± 129.54 164.4 ± 20.25 5.85 ± 0.12 0.18 ± 0.007 107.06 ± 8.66 45.81 ± 4.60 2.63 ± 0.09 0.52 ± 0.19 0.68 ± 0.06 1.33 ± 0.15 0.20 ± 006 0.07 ± 0.03 T1 1828 ± 50.98 263.7 ± 21.88 6.17 ± 1.54 1.30 ± 0.26 130.64 ± 4.79* 72.27 ± 6.94* 6.08 ± 1.45 2.51 ± 0.59 0.90±0.03 1.87 ± 0.21* 0.48 ± 0.11 0.41 ± 0.11 T2 1904 ± 107.52 235.6 ± 11.41 5.91 ± 0.87 1.16 ± 0.24 134.29 ± 6.13** 63.33 ± 3.44 5.73±0.82 2.37 ± 0.47 0.92 ± 0.03 1.62±0.10 0.45 ± 0.06 0.39 ± 0.07 T3 1986 ± 72.02** 352.1 ± 25.95 7.49 ± 1.08 1.33 ± 0.18 151.05 ± 6.66**** 93.27 ± 7.25**** 7.49 ± 1.06 2.71 ± 0.37 1.11 ± 0.05 2.38 ± 0.15**** 0.61 ± 0.08 0.47 ± 0.07 T4 2049 ± 81.10** 337.7 ± 33.50 6.90 ± 1.33 0.88 ± 0.35 158.60 ± 0.35**** 89.56 ± 9.62**** 6.83 ± 1.30 1.59 ± 0.70 1.15 ± 0.05 2.23 ± 0.26*** 0.553 ± 0.10 0.23 ± 1.11 T5 2306 ± 89.85**** 332.3 ± 16.40 6.03 ± 1.70 0.45 ± 0.14 171.80 ± 8.09**** 87.44 ± 5.61**** 5.64 ± 1.68 0.95 ± 0.36 1.21 ± 0.06* 2.15 ± 0.19*** 0.43 ± 0.13 0.13 ± 0.04 Roots were classified into four different size groups based on their diameter: < 0.5 mm, 0.5−2 mm, 2−4.5 mm, and > 4.5 mm. Values are the means ± SD of three biological replicates. Table 1. Root length, root surface area, and root volume in control and nitrate-treated B9 apple nursery plants.
Figures
(6)
Tables
(1)