-
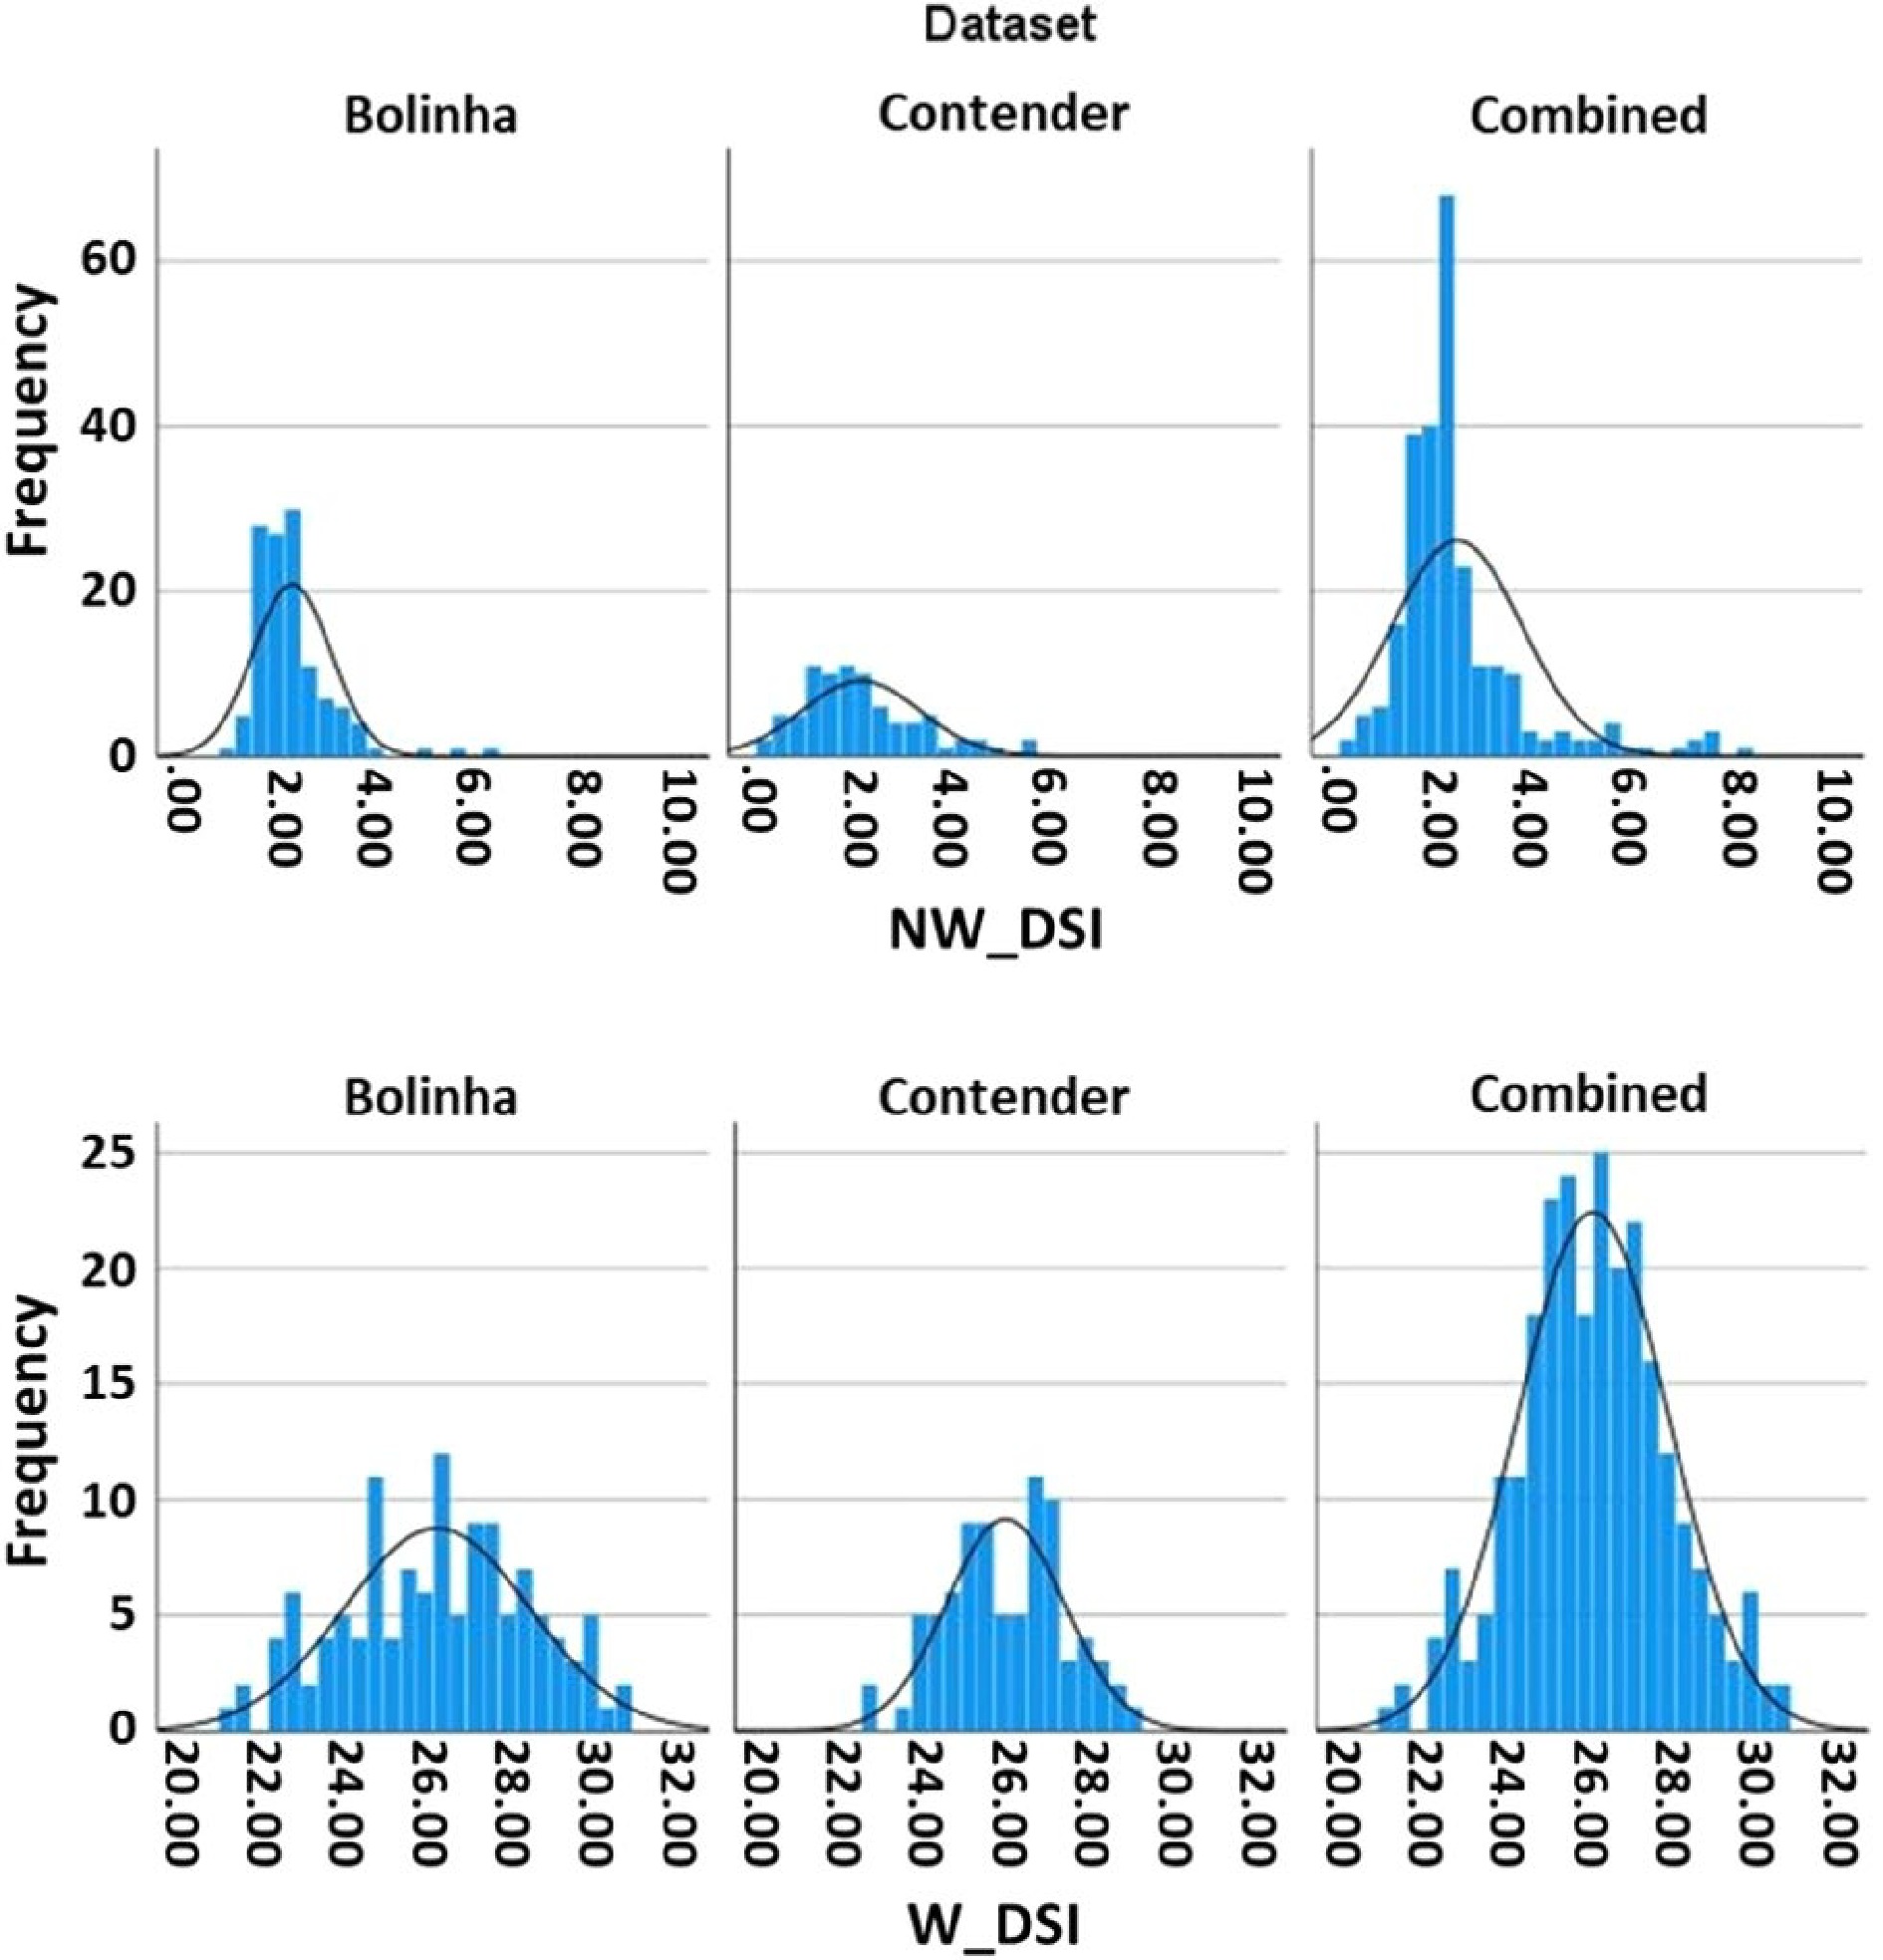
Figure 1. Disease severity index (DSI) distribution in the three datasets (Bolinha, Contender, Combined).
-
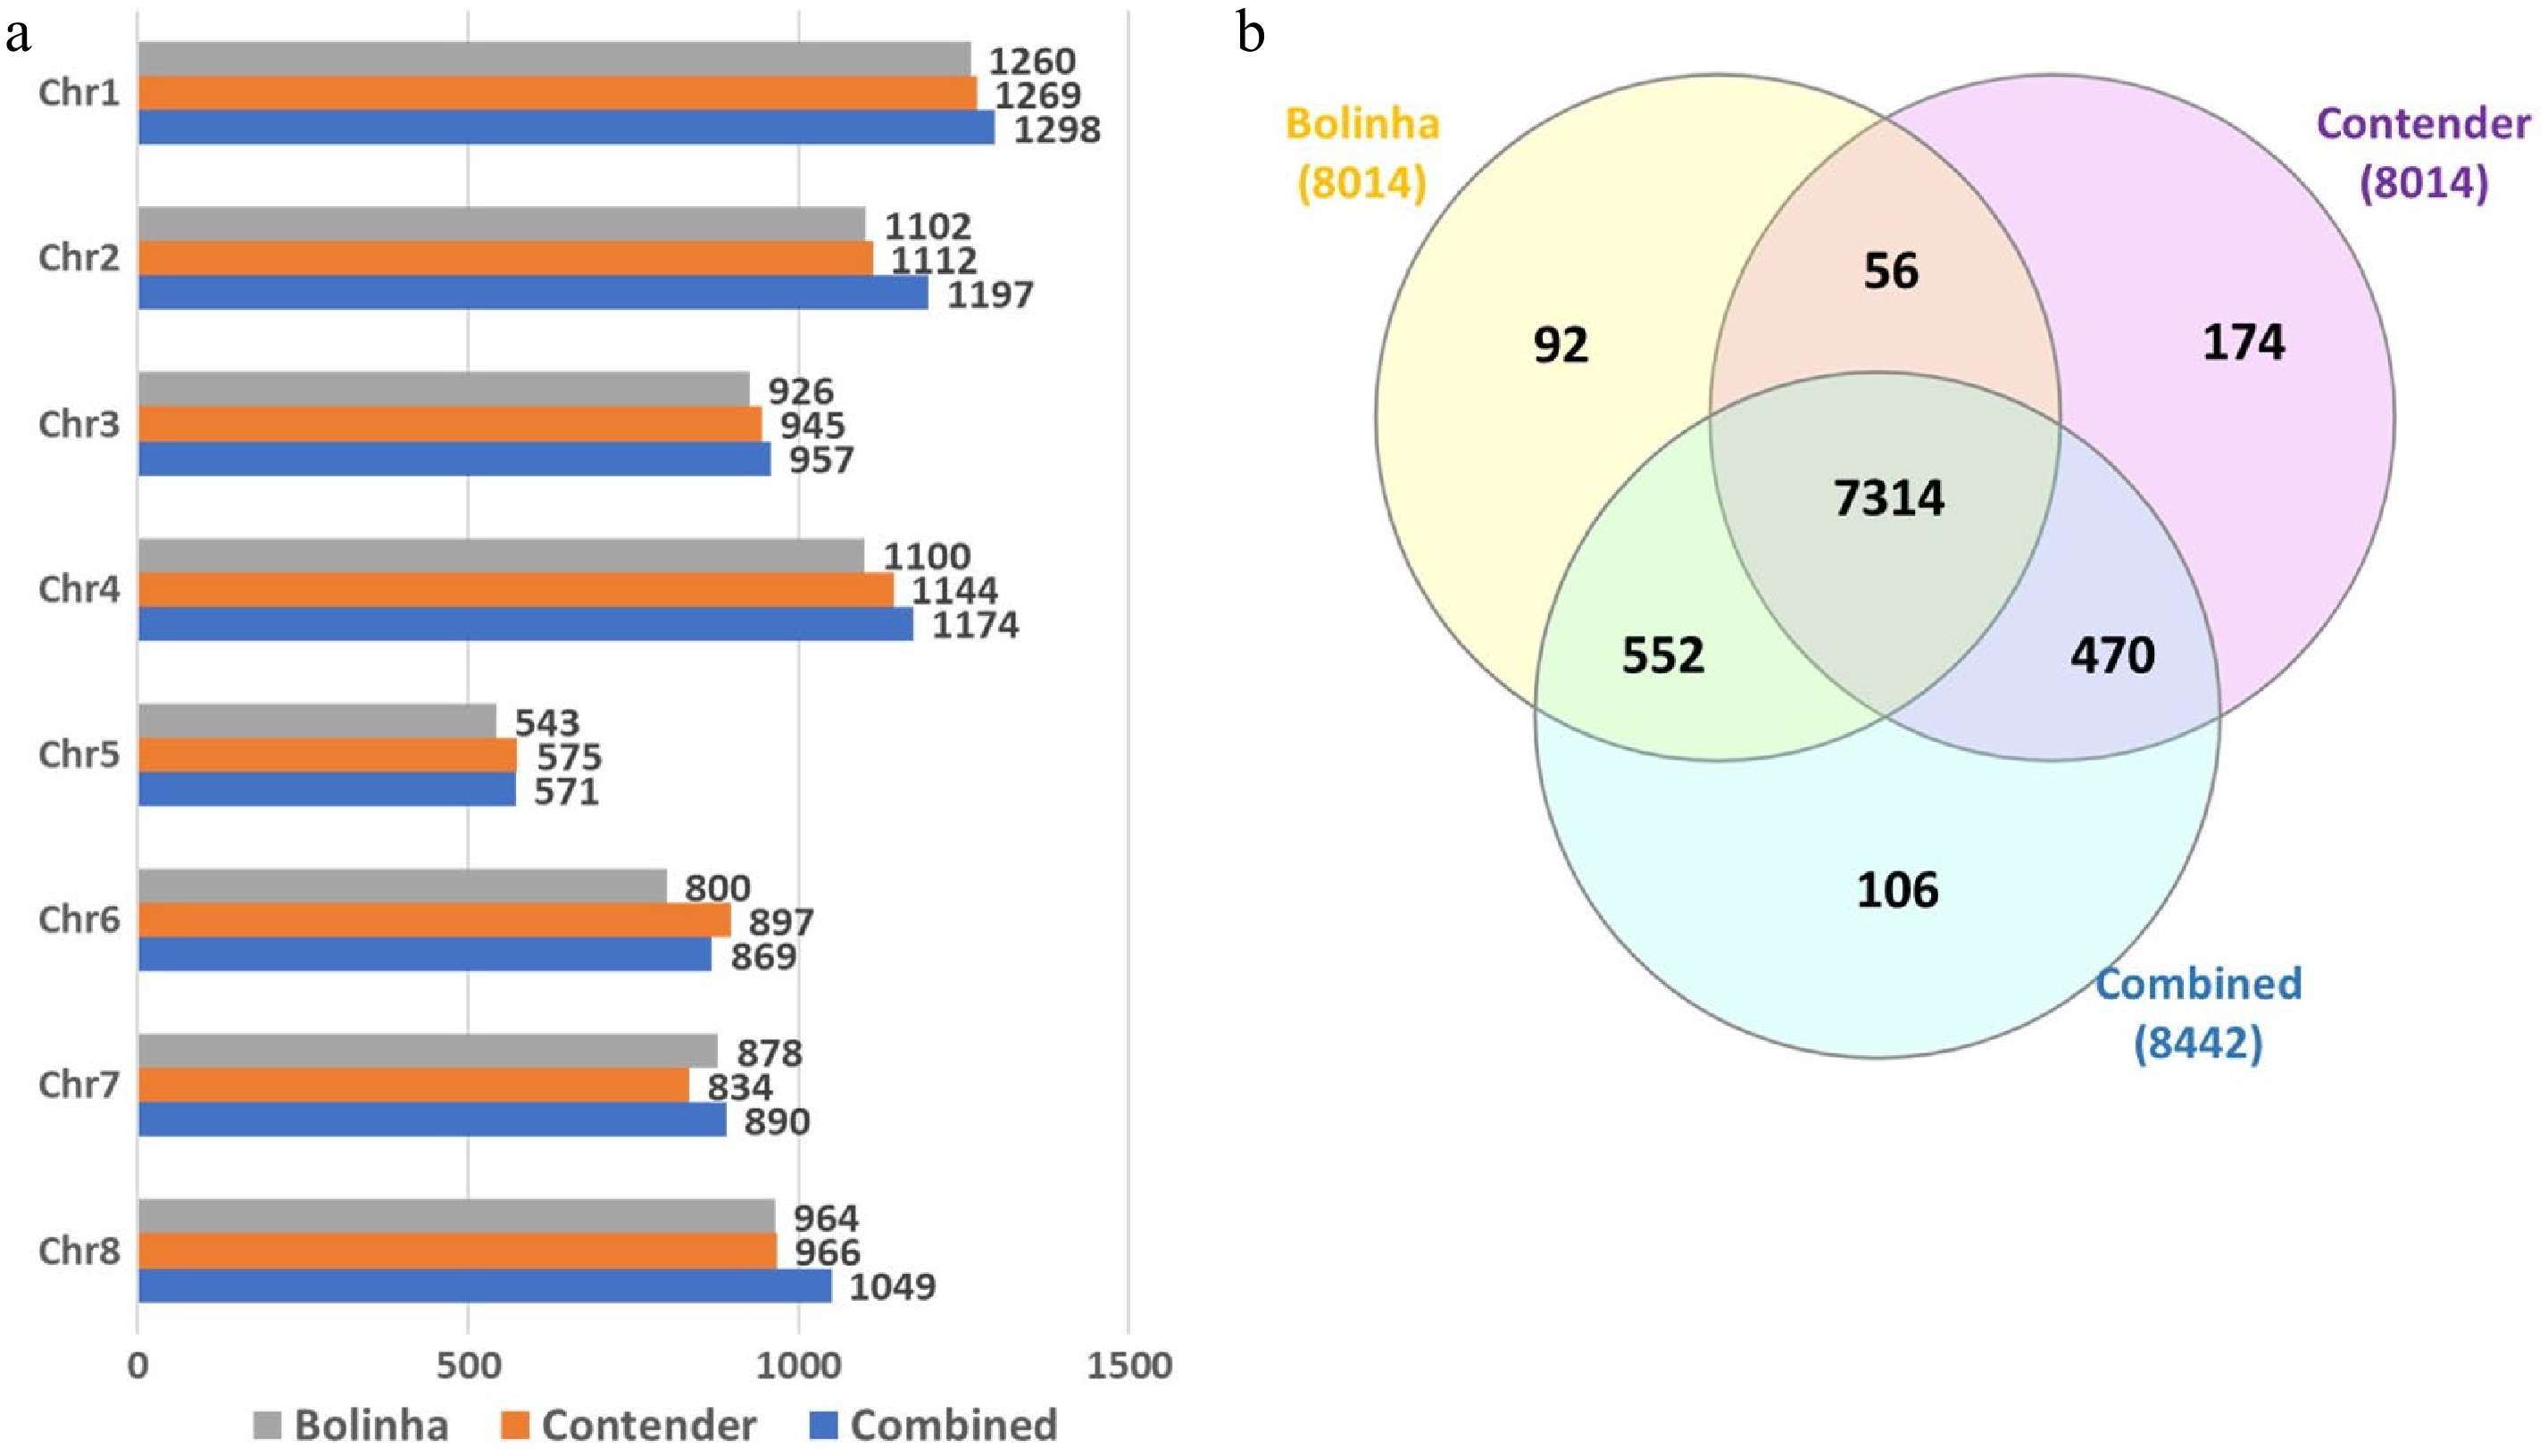
Figure 2. Number of SNPs included in genome wide association study and genomic prediction analysis for the three datasets (Bolinha, Contender and Combined). (a) Number of SNPs per chromosome. (b) Venn diagram for SNPs shared by all three datasets.
-
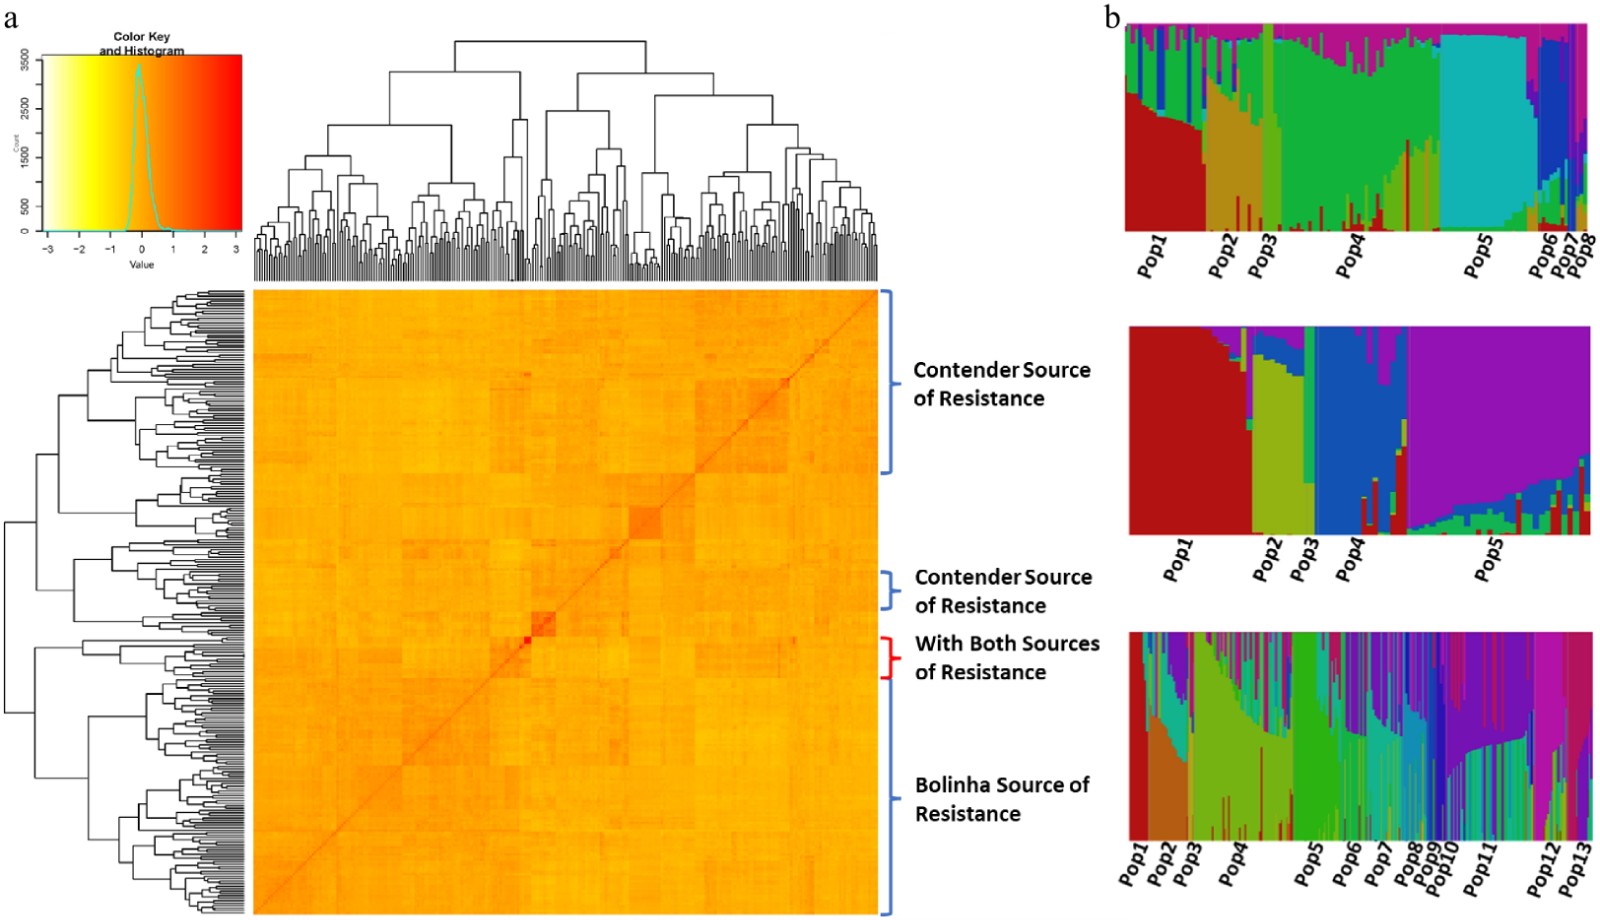
Figure 3. (a) Heat map of kinship matrix of the testing panel and, (b) population structure of the three datasets (Bolinha, Contender and Combined).
-

Figure 4. Predictive accuracy for five-fold cross validation of several genomic prediction models and marker-assisted selection (MAS) model in three datasets (Bolinha, Contender and Combined) for wounded (W) and non-wounded (NW) disease severity index (DSI).
-
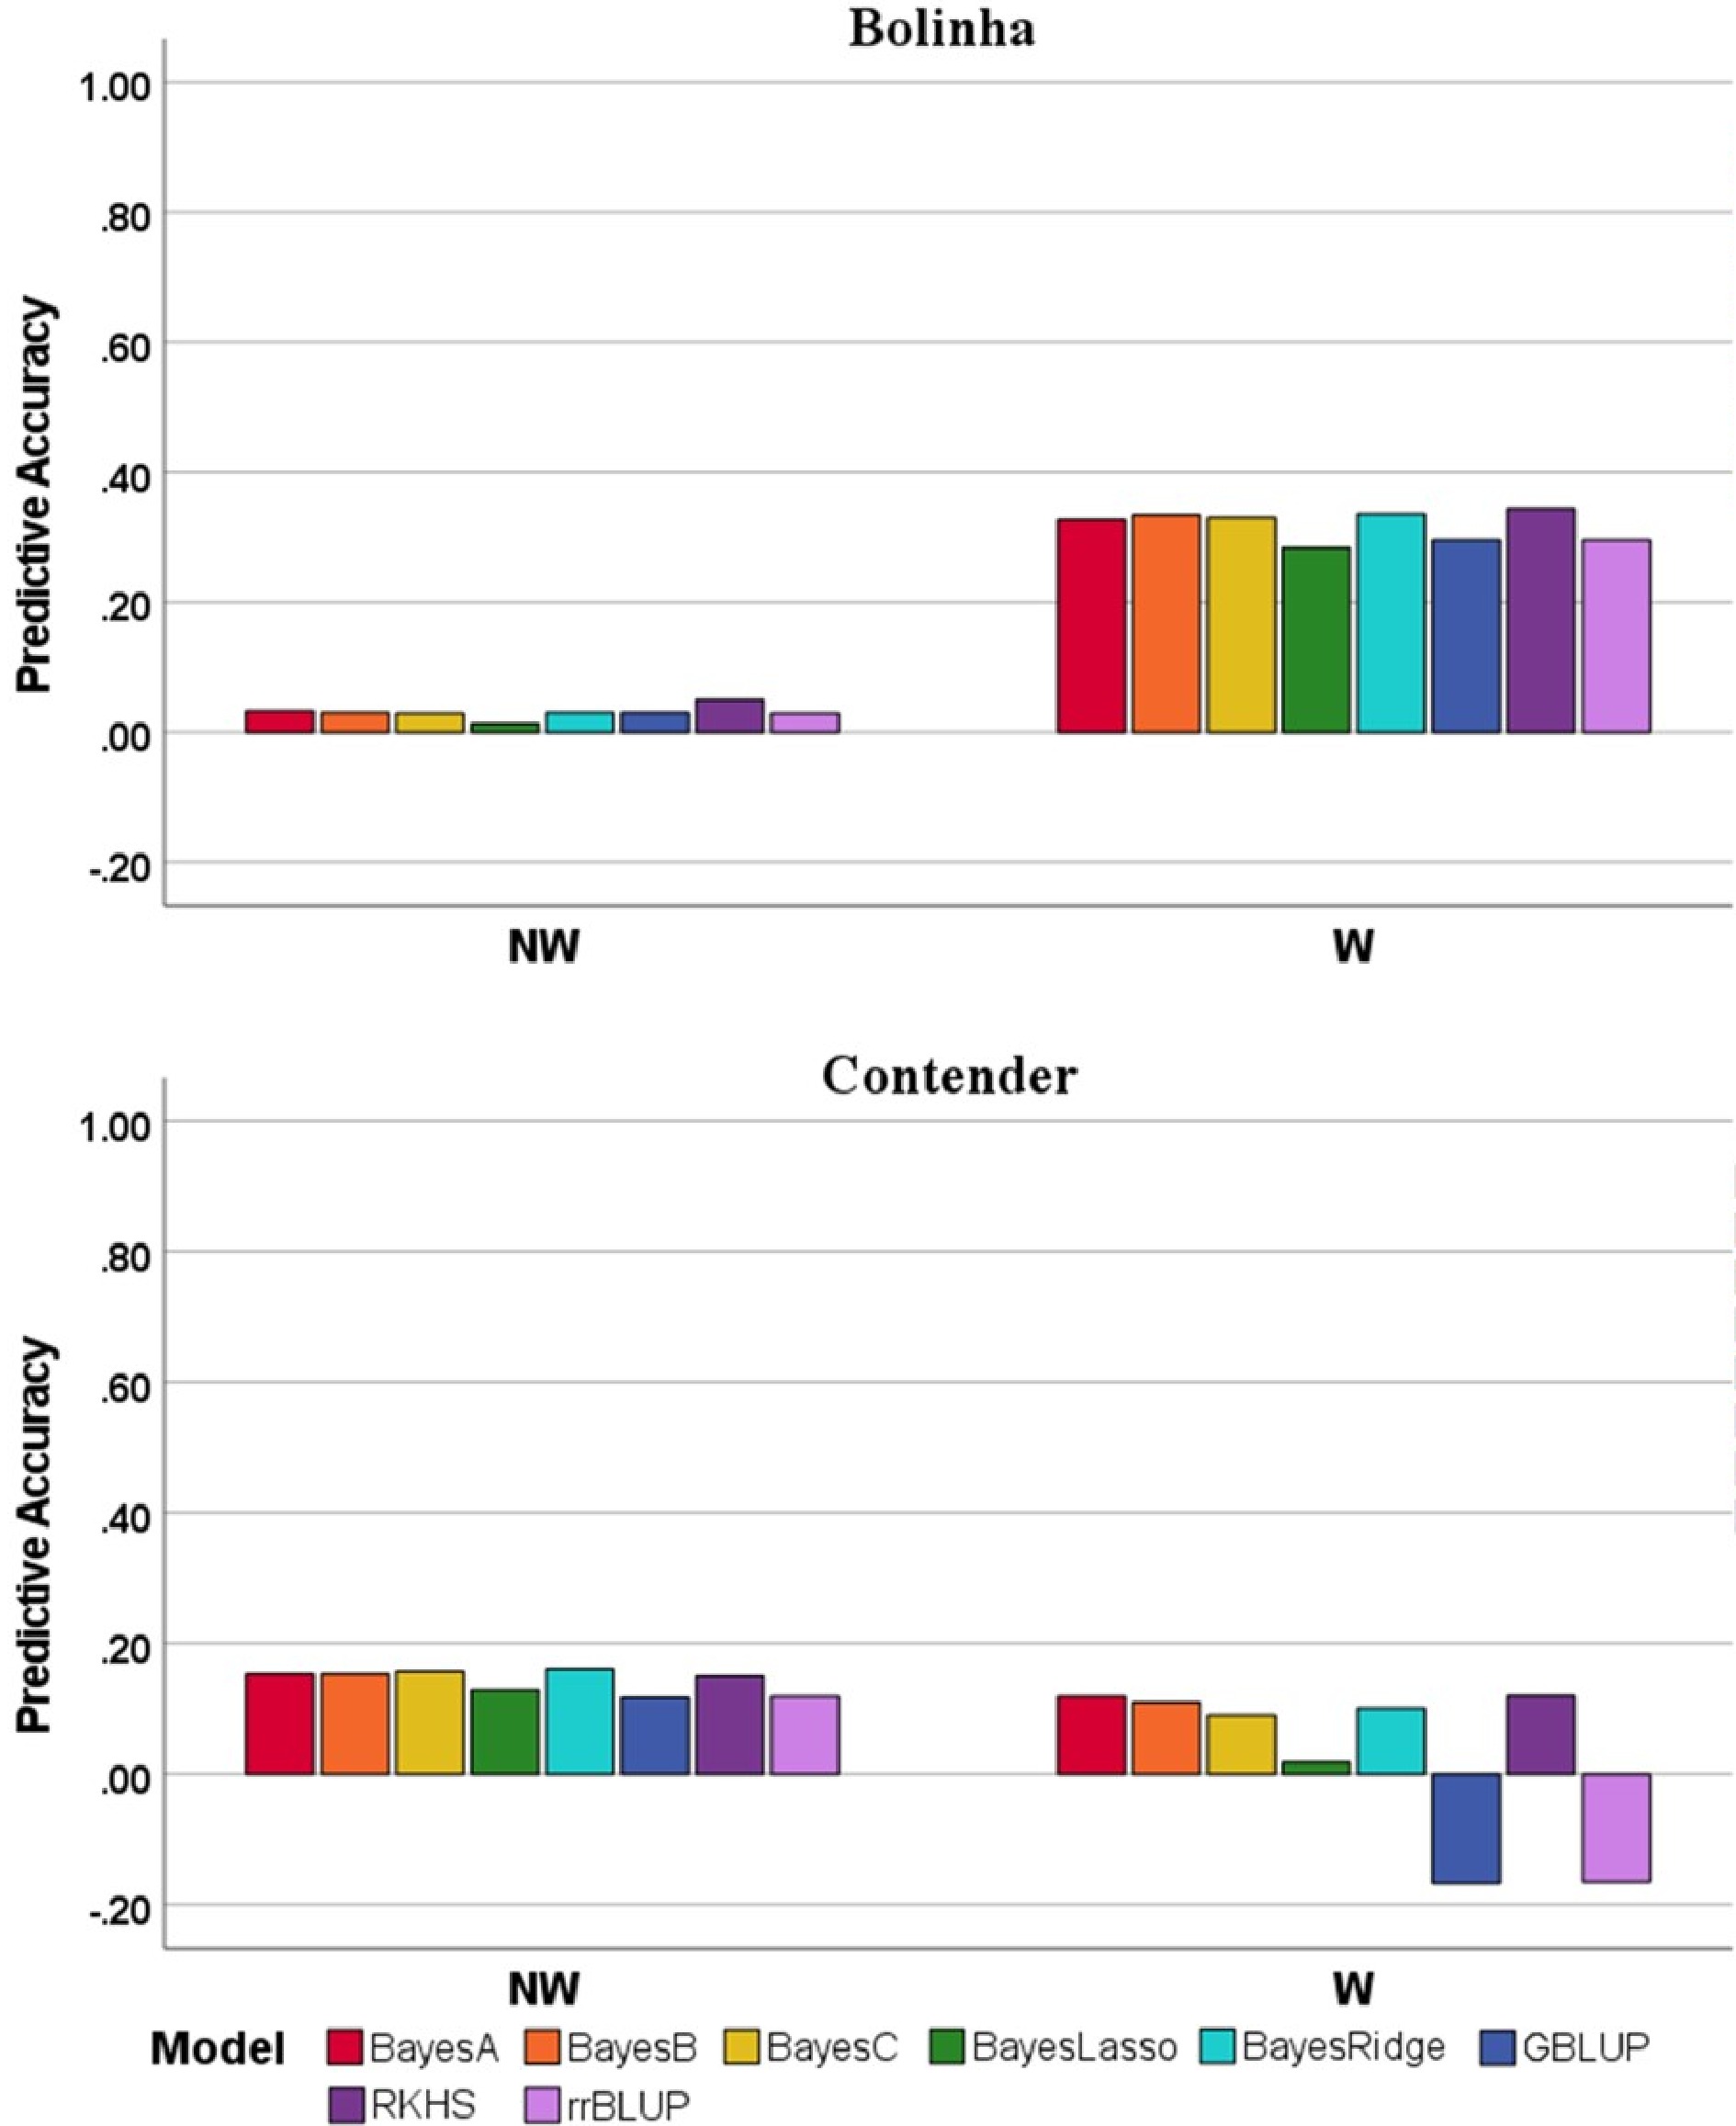
Figure 5. Predictive accuracy for leave-one-family-out cross-validation of several genomic prediction models in the Bolinha and Contender datasets for wounded (W) and non-wounded (NW) disease severity index (DSI).
-
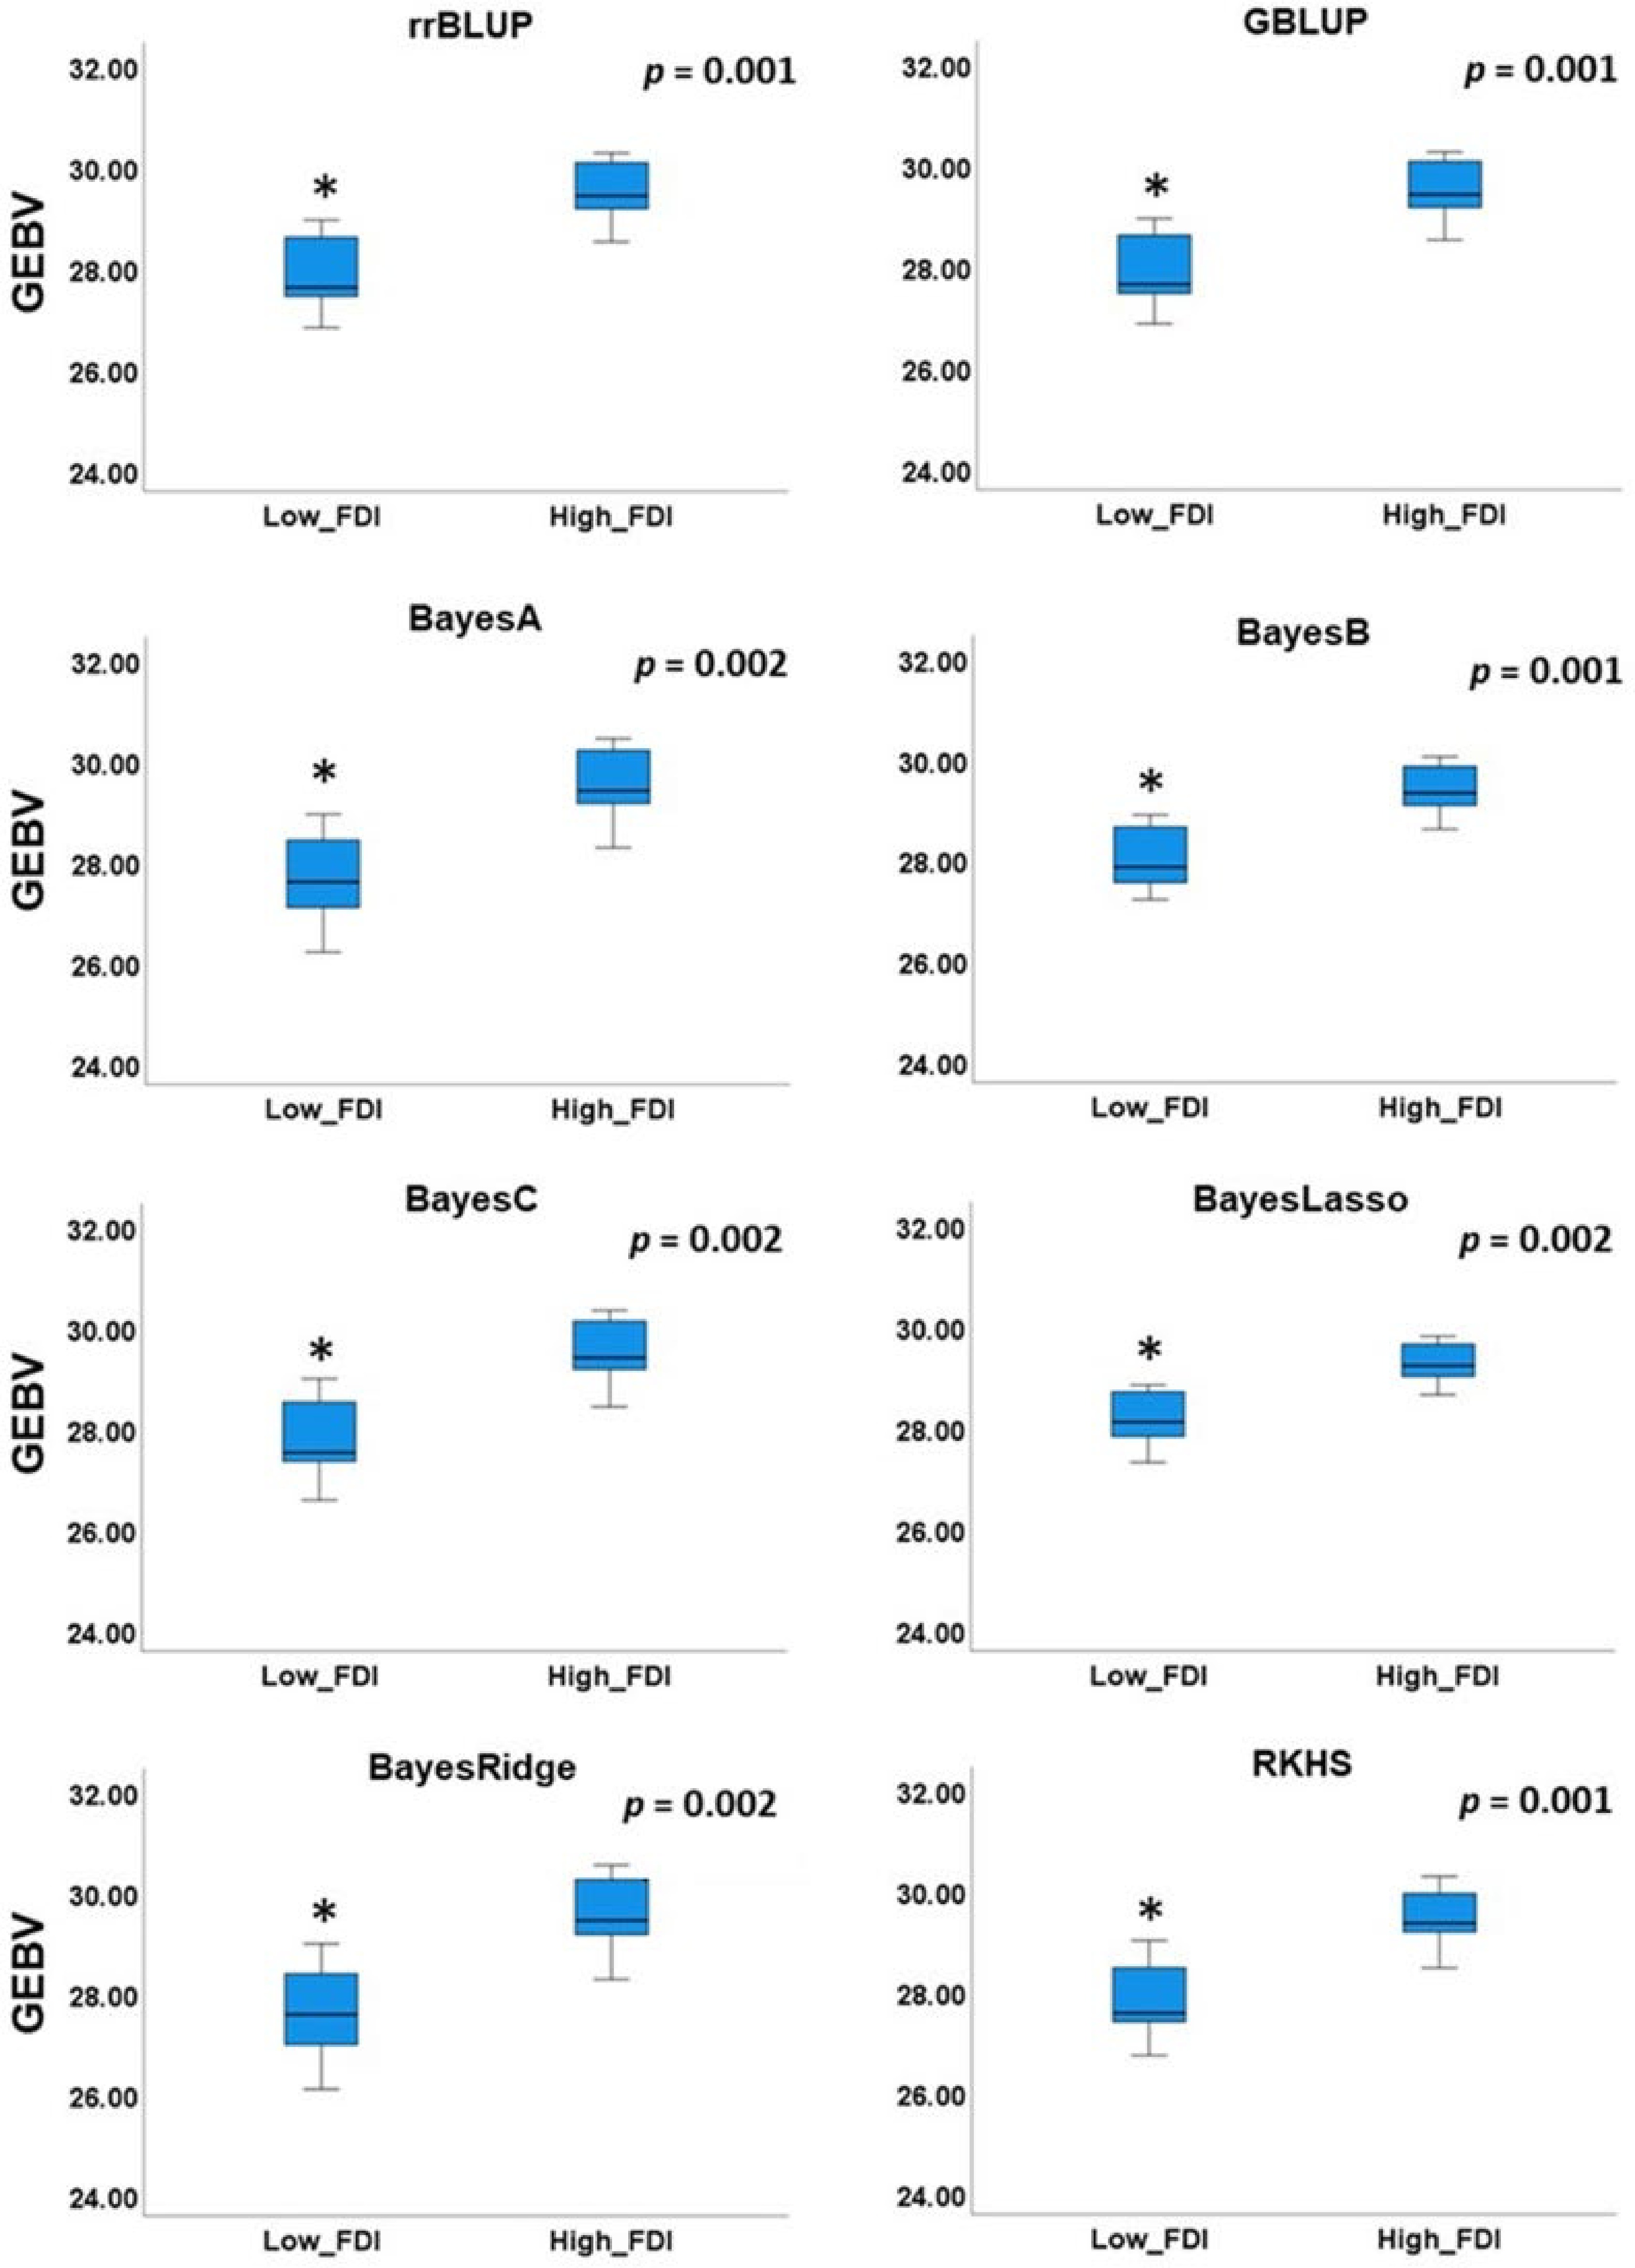
Figure 6. Comparison of mean genomic estimated breeding value (GEBV) between individuals with low and high field observed disease incidence (FDI).
-
Trait Training set Validation set Model Predictive accuracy NW DSI Bolinha Contender Bayes A 0.154 Bayes B 0.166 Bayes C 0.147 Bayesian LASSO 0.156 Bayesian Ridge 0.156 GBLUP 0.158 RKHS 0.128 rrBLUP 0.154 Other Bayes A 0.279 Bayes B 0.292 Bayes C 0.307 Bayesian LASSO 0.279 Bayesian Ridge 0.289 GBLUP 0.293 RKHS 0.301 rrBLUP 0.293 Contender Bolinha Bayes A 0.06 Bayes B 0.057 Bayes C 0.057 Bayesian LASSO 0.079 Bayesian Ridge 0.066 GBLUP 0.063 RKHS 0.052 rrBLUP 0.06 Other Bayes A −0.129 Bayes B −0.139 Bayes C −0.107 Bayesian LASSO 0.012 Bayesian Ridge −0.117 GBLUP −0.095 RKHS −0.132 rrBLUP −0.095 W DSI Bolinha Contender Bayes A 0.157 Bayes B 0.131 Bayes C 0.125 Bayesian LASSO 0.097 Bayesian Ridge 0.121 GBLUP 0.147 RKHS 0.147 rrBLUP 0.13 Other Bayes A 0.121 Bayes B 0.104 Bayes C 0.105 Bayesian LASSO 0.11 Bayesian Ridge 0.097 GBLUP 0.106 RKHS 0.116 rrBLUP 0.106 Contender Bolinha Bayes A −0.133 Bayes B −0.15 Bayes C −0.133 Bayesian LASSO −0.132 Bayesian Ridge −0.147 GBLUP −0.096 RKHS −0.137 rrBLUP −0.103 Other Bayes A −0.169 Bayes B −0.139 Bayes C −0.177 Bayesian LASSO −0.192 Bayesian Ridge −0.139 GBLUP −0.219 RKHS −0.142 rrBLUP −0.218 Table 1. Predictive accuracy of genomic prediction models for wounded (W) and non-wounded (NW) disease severity (DSI) traits when using the Bolinha or Contender datasets as the training population.
-
BLUP rrBLUP GBLUP BayesA BayesB BayesC BayesLasso BayesRidge RKHS FDI_BLUP − rrBLUP 0.550** − GBLUP 0.549** 1.000** − BayesA 0.548** 0.995** 0.995** − BayesB 0.549** 0.998** 0.999** 0.991** − BayesC 0.550** 0.998** 0.998** 0.998** 0.995** − BayesLasso 0.537** 0.994** 0.994** 0.984** 0.997** 0.989** − BayesRidge 0.553** 0.995** 0.994** 0.999** 0.990** 0.998** 0.982** − RKHS 0.552** 0.991** 0.991** 0.994** 0.986** 0.994** 0.978** 0.994** − ** − Correlation detected at the significant level of 0.01. Table 2. Spearman's correlation between BLUP of field observed flesh disease incidence (W_FDI) and genomic estimated breeding value obtained from genomic prediction models.
Figures
(6)
Tables
(2)