-
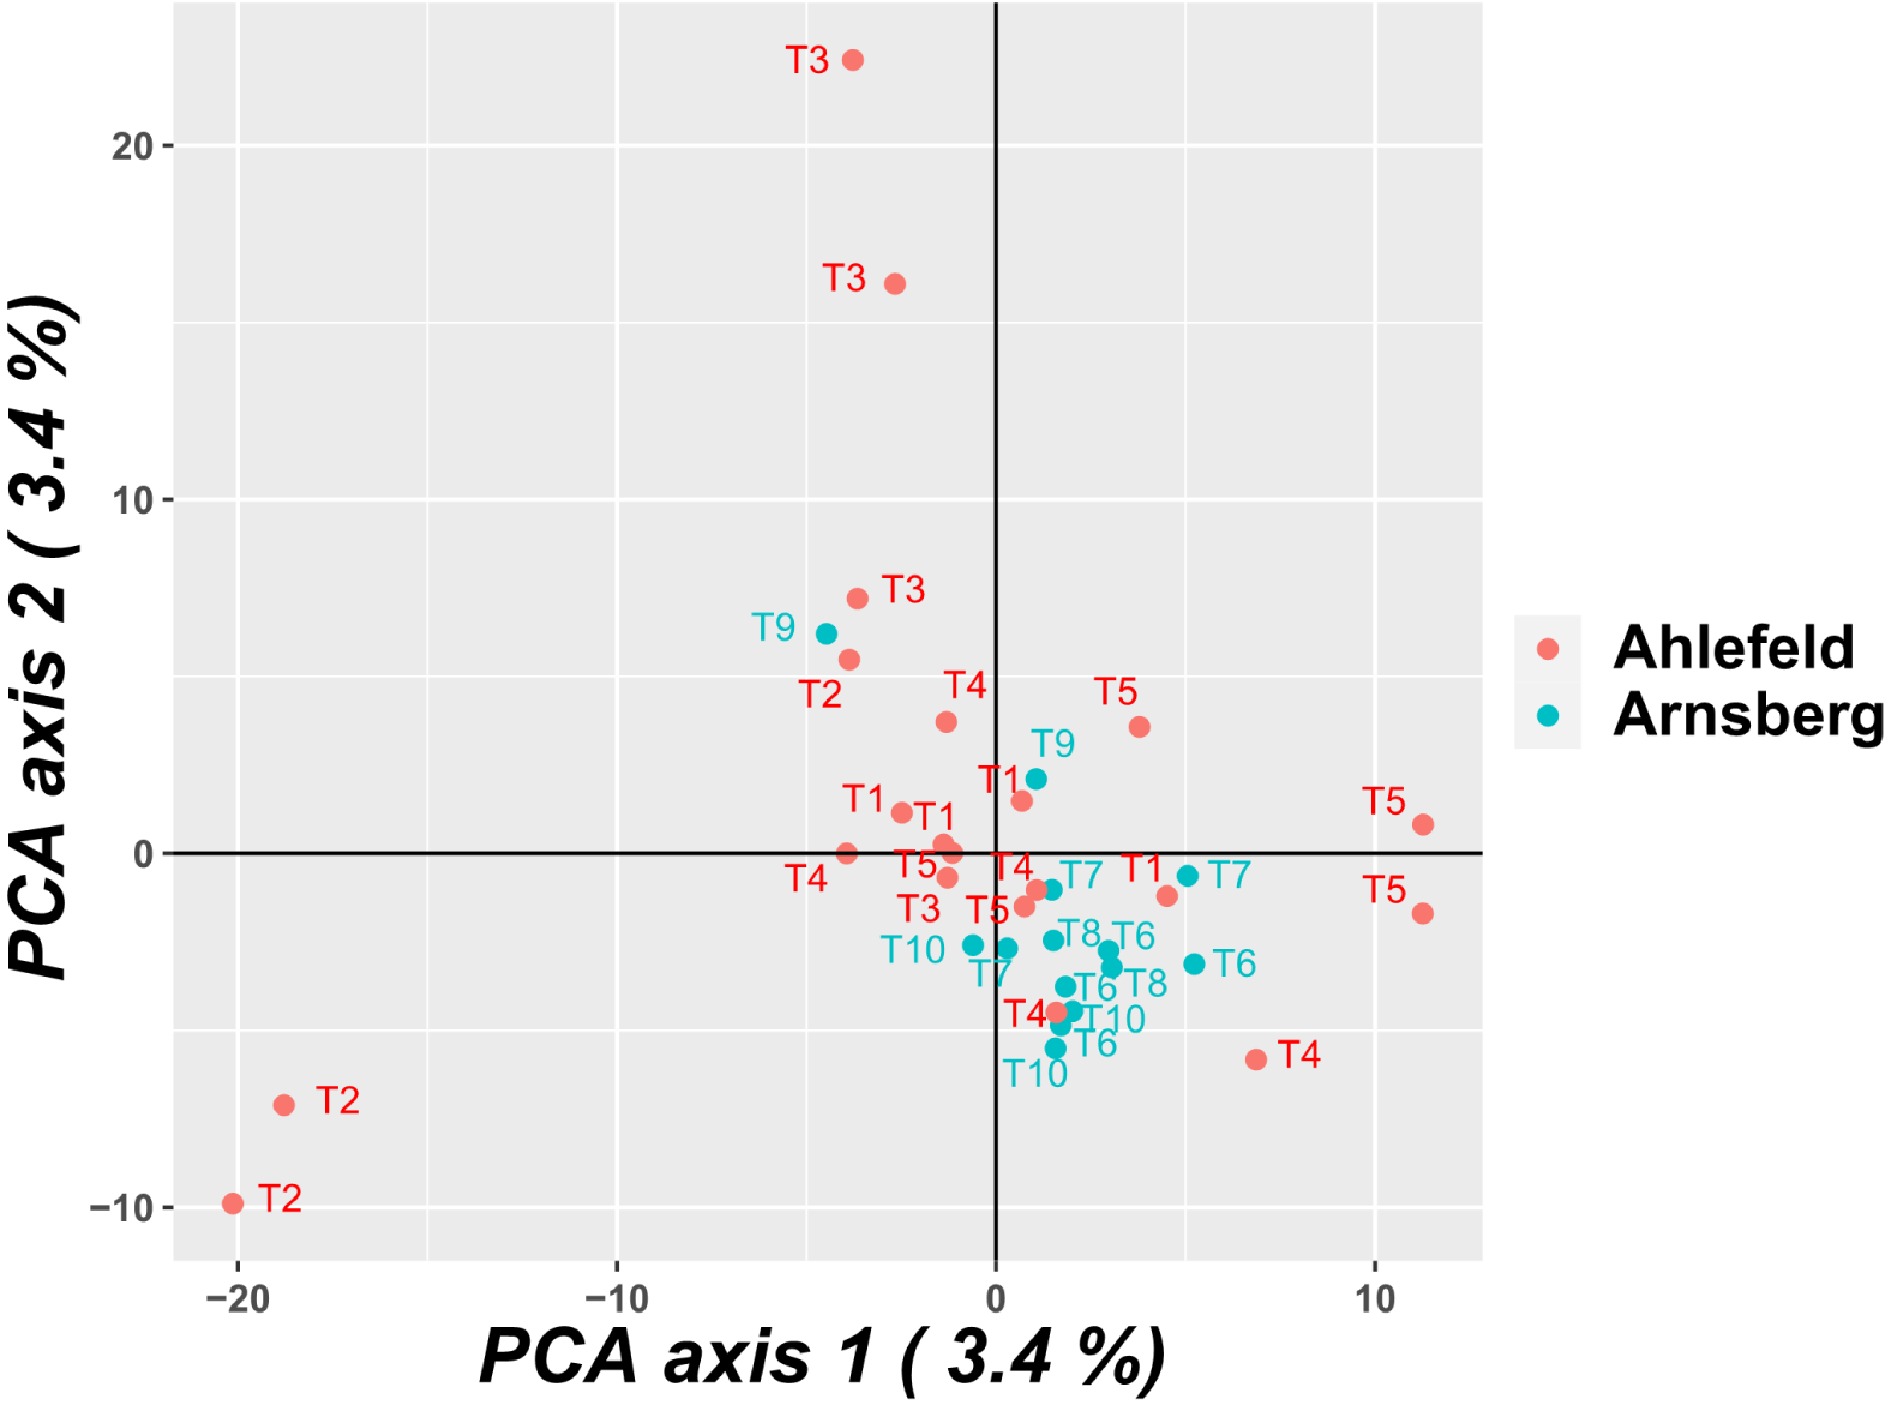
Figure 1.
Principle component analysis (PCA) of the pools. Similar numbers refer to pools of samples taken from the same tree.
-
Population N Ho He Ar Fis FST Ahlefeld 21 0.245 0.265 1.84 0.077 0.001 Arnsberg 14 0.258 0.275 1.83 0.061 Over all 35 0.241 0.259 1.83 0.069 N: number of pools, Ho: observed heterozygosity, He: expected heterozygosity, Fis: inbreeding coefficient (not significantly different from zero), FST: fixation index (not significant) Table 1.
Genetic diversity indices and genetic differentiation of the populations.
-
Population Latitude Longitude No. of
sampled treesNo. of
poolsEngelskirchen 50.97610798 7.41474115 NA 28 Ahlefeld 50.99651943 7.55328433 5 21 Arnsberg 51.44245304 7.99021258 5 14 Table 2.
Overview of the sampled populations.
Figures
(1)
Tables
(2)