-
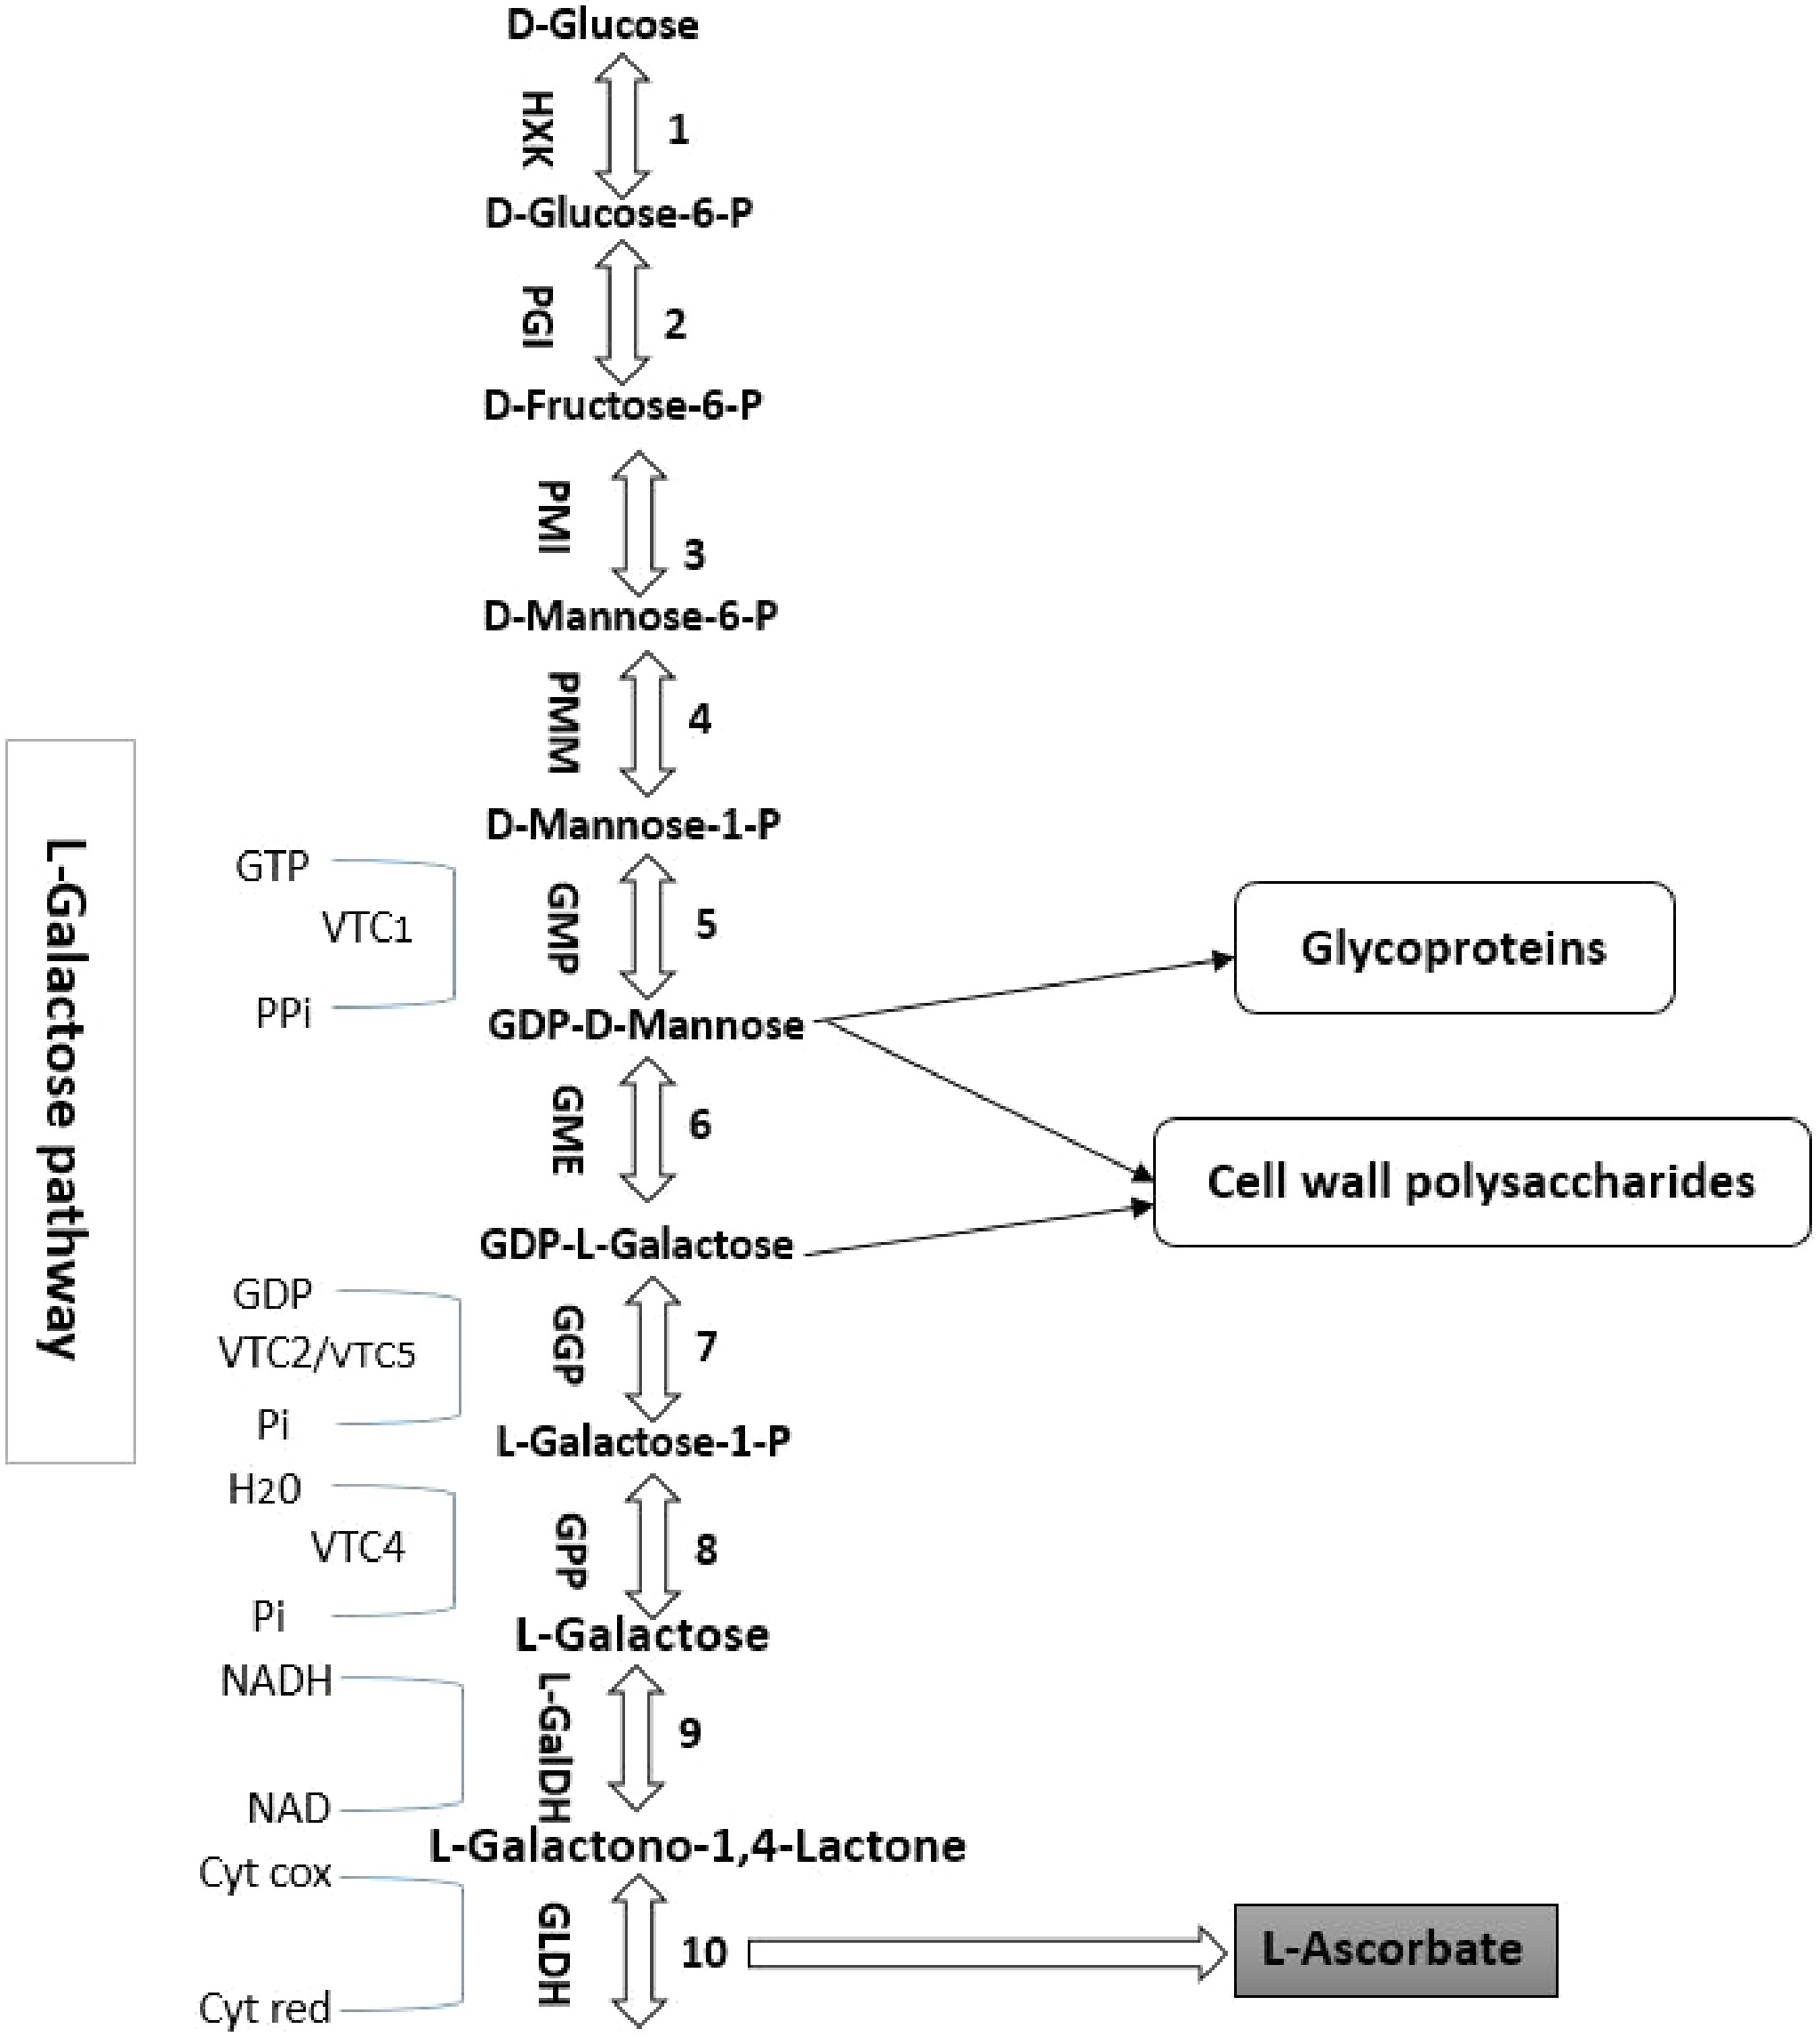
Figure 1.
The biosynthetic pathway of ascorbic acid in higher plants (D-mannose/L-galactose pathway). The reactions catalyzed by the enzymes are numbered as follows: 1. HXK (hexokinase); 2. PGI (phosphoglucose isomerase); 3. PMI (phosphomannose isomerase); 4. PMM (phosphomannomutase); 5. GMP (GDP-D-mannose pyrophosphorylase); 6. GME (GDP-D-mannose 30,50-epimerase); 7. GGP (GDP-L-galactose phosphorylase); 8. GPP (L-galactose-1-P phosphatase); 9. L-GalDH (L-galactose dehydrogenase); 10. GLDH (L-galactono-1,4-lactone dehydrogenase). VTC2 and VTC5 catalyze the first commitment step in the synthesis of GGP from L-ascorbic acid (step 7).
-
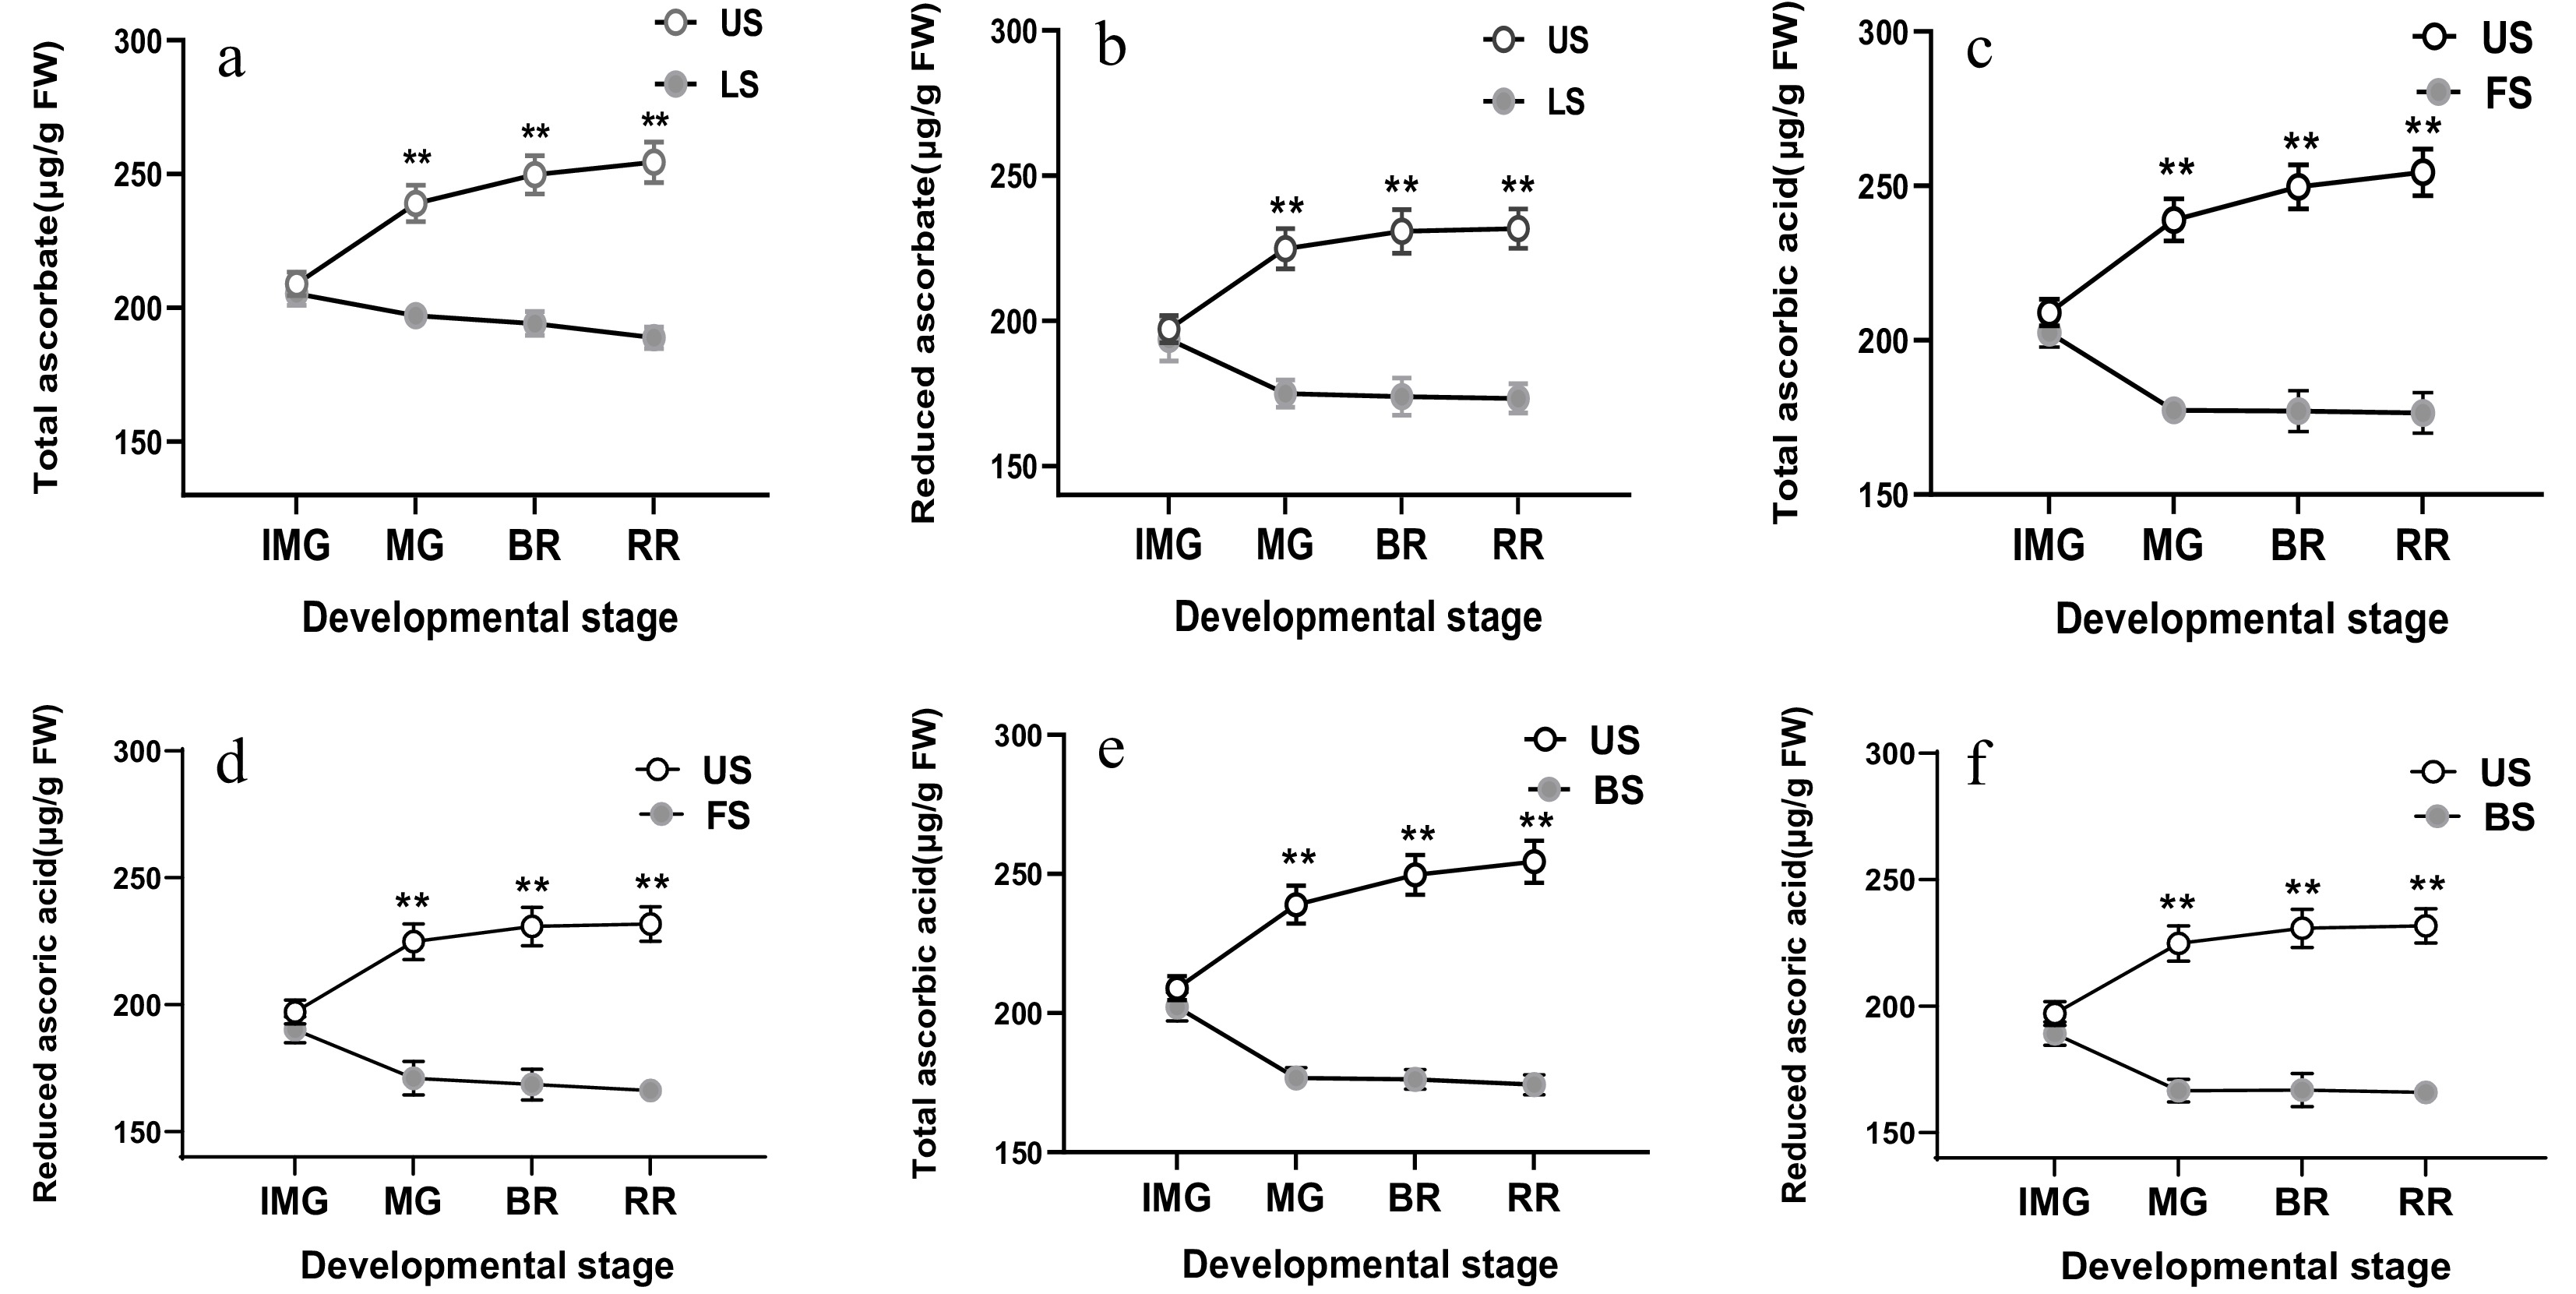
Figure 2.
Effect of leaf shading (a, b), fruit shading (c, d), and both types of shading (e, f) on total ascorbic acid (a, c, e) and reduced ascorbic acid content (b, d, f) in fruits which were harvested at immature green (IMG), mature (MG), breaker (BR) and red ripe (RR) stages of fruits in plants. LS, leaf shading; FS, fruit shading; BS, both shading. Data is presented as mean ± SD. Statistical analysis was enforced using Duncan's test. The indication of * and ** is a significant difference at P ≤ 0.05 and P ≤ 0.01, respectively.
-
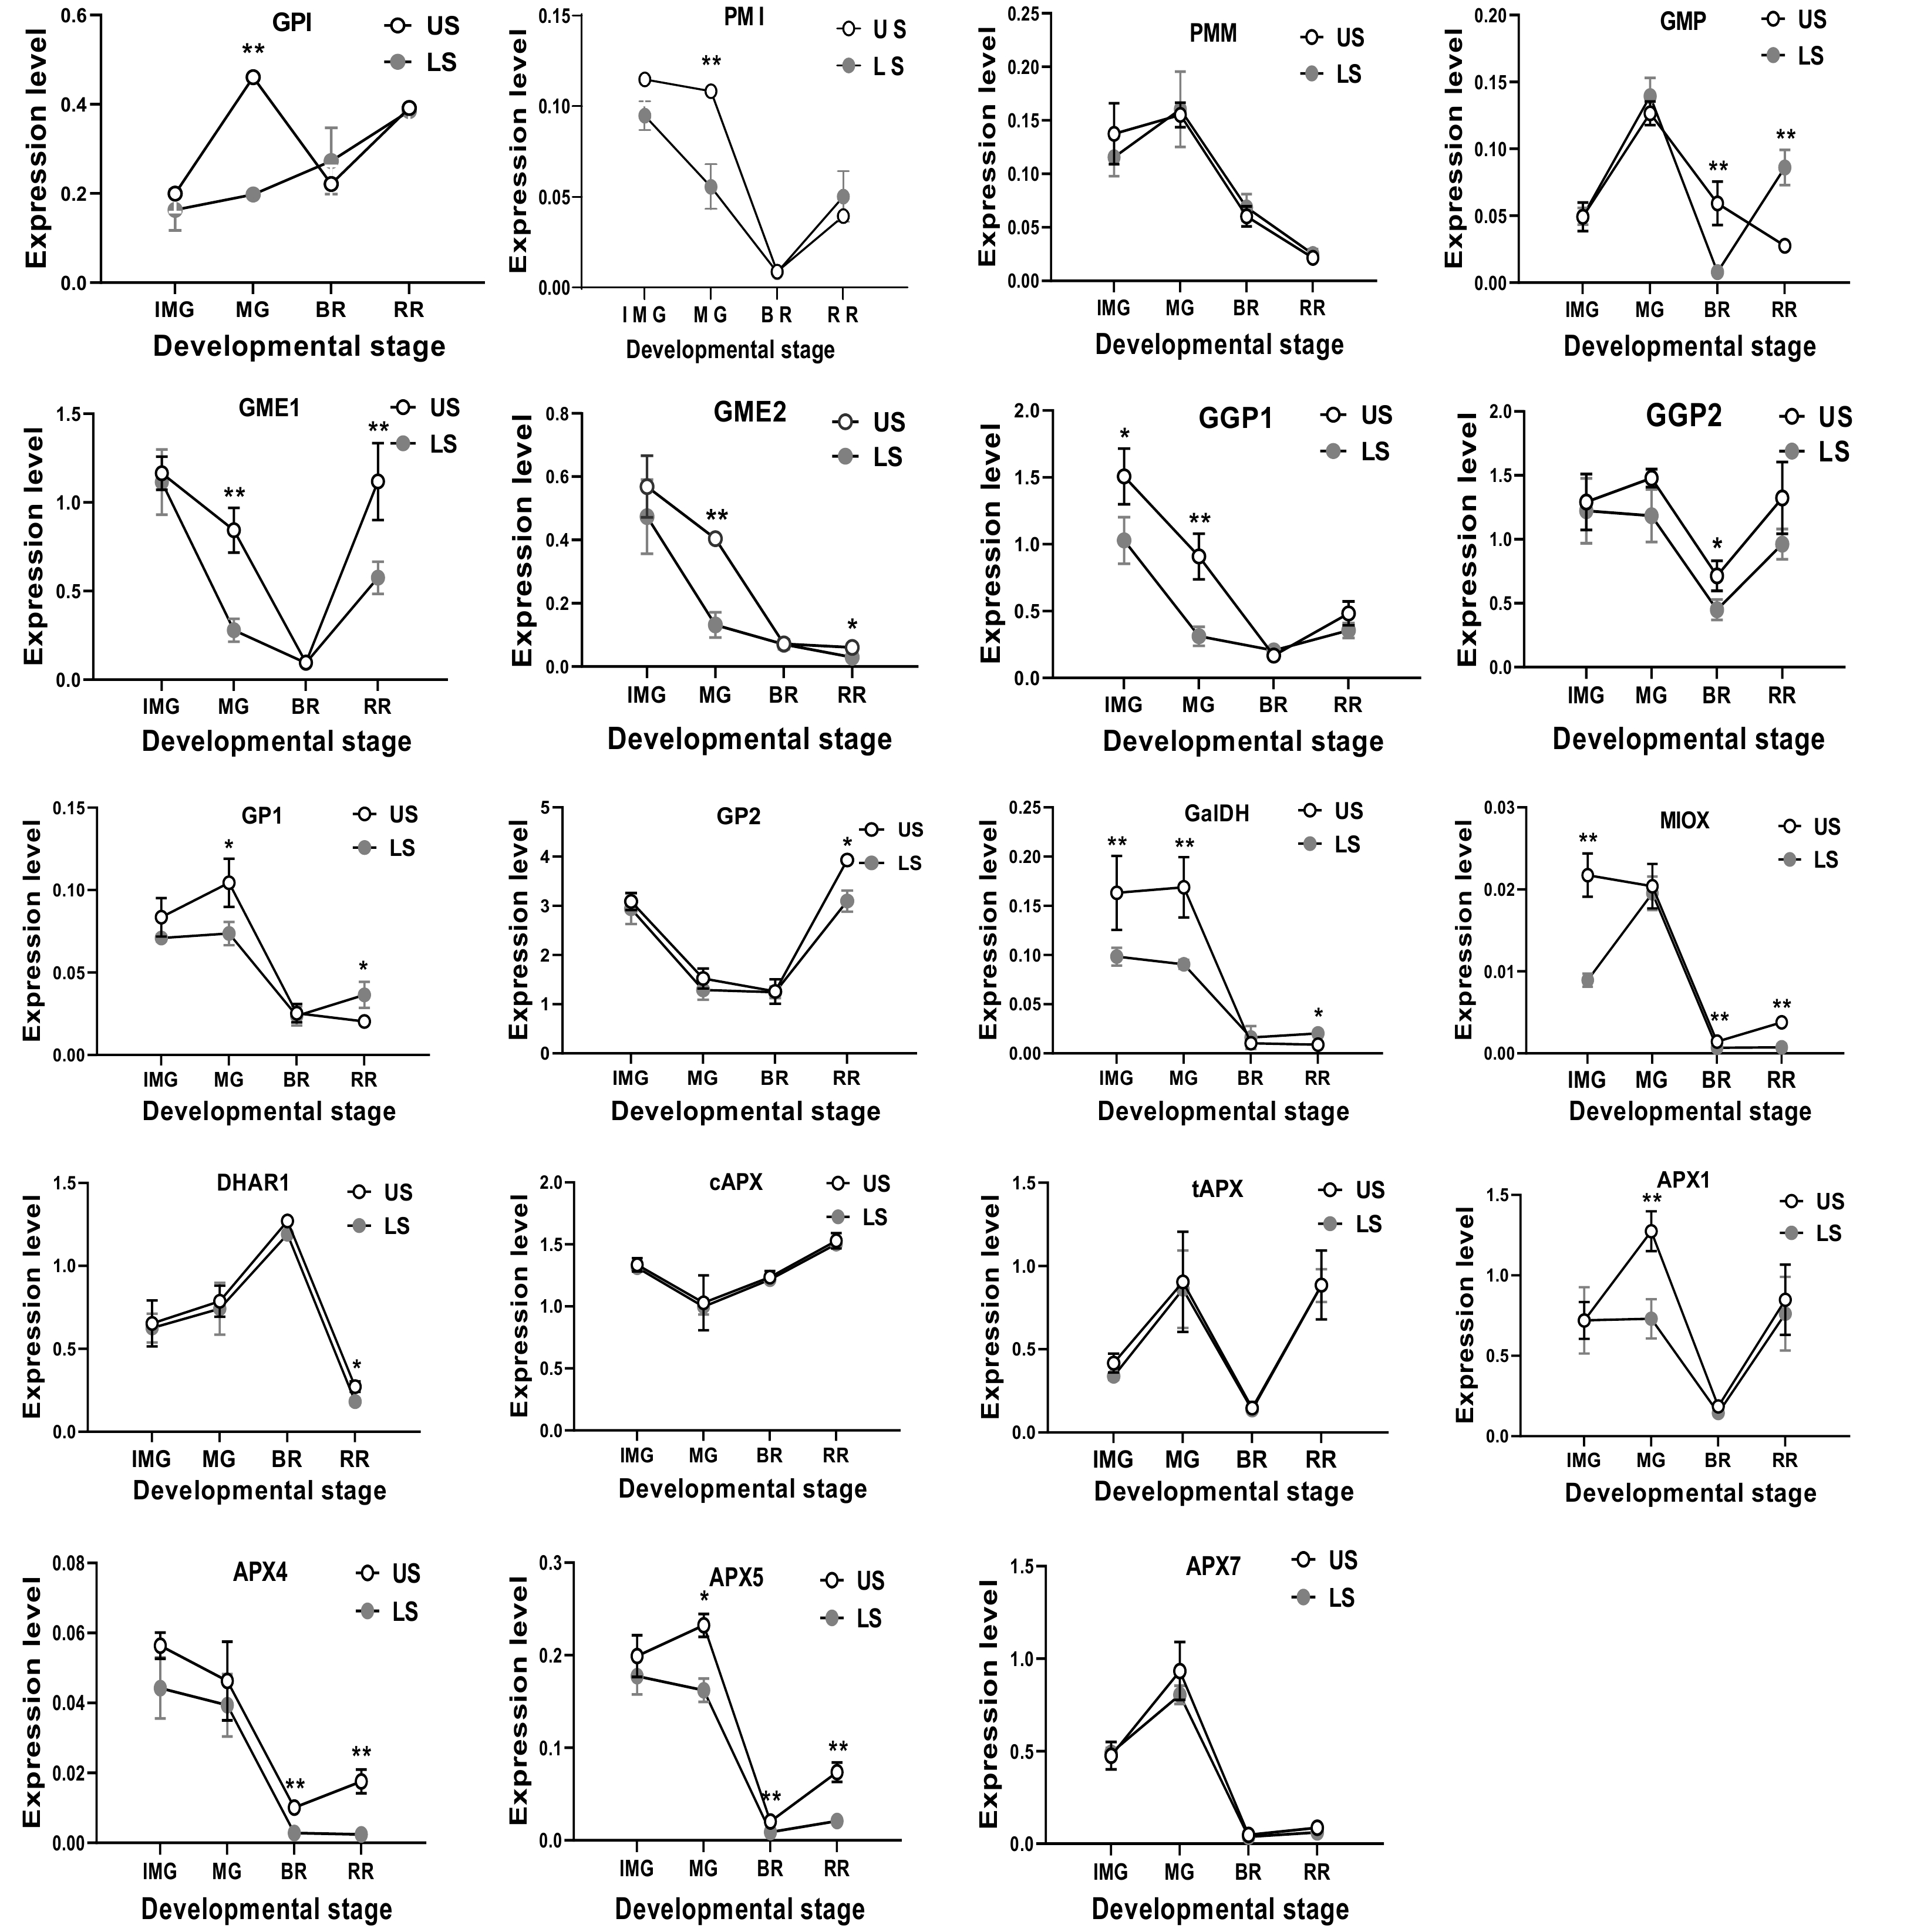
Figure 3.
The mRNA transcription level of AsA biosynthetic genes in S. lycopersicum 'Ailsa Craig' at immature green (IMG), mature green (MG), breaker (BR) and red ripe (RR) stages with or without leaf shading. US, un-shaded; LS, leaf shading. Data is presented as mean values ± SD (n = 3). * and ** illustrate a significant difference at P < 0.05 and P < 0.01 levels, respectively.
-
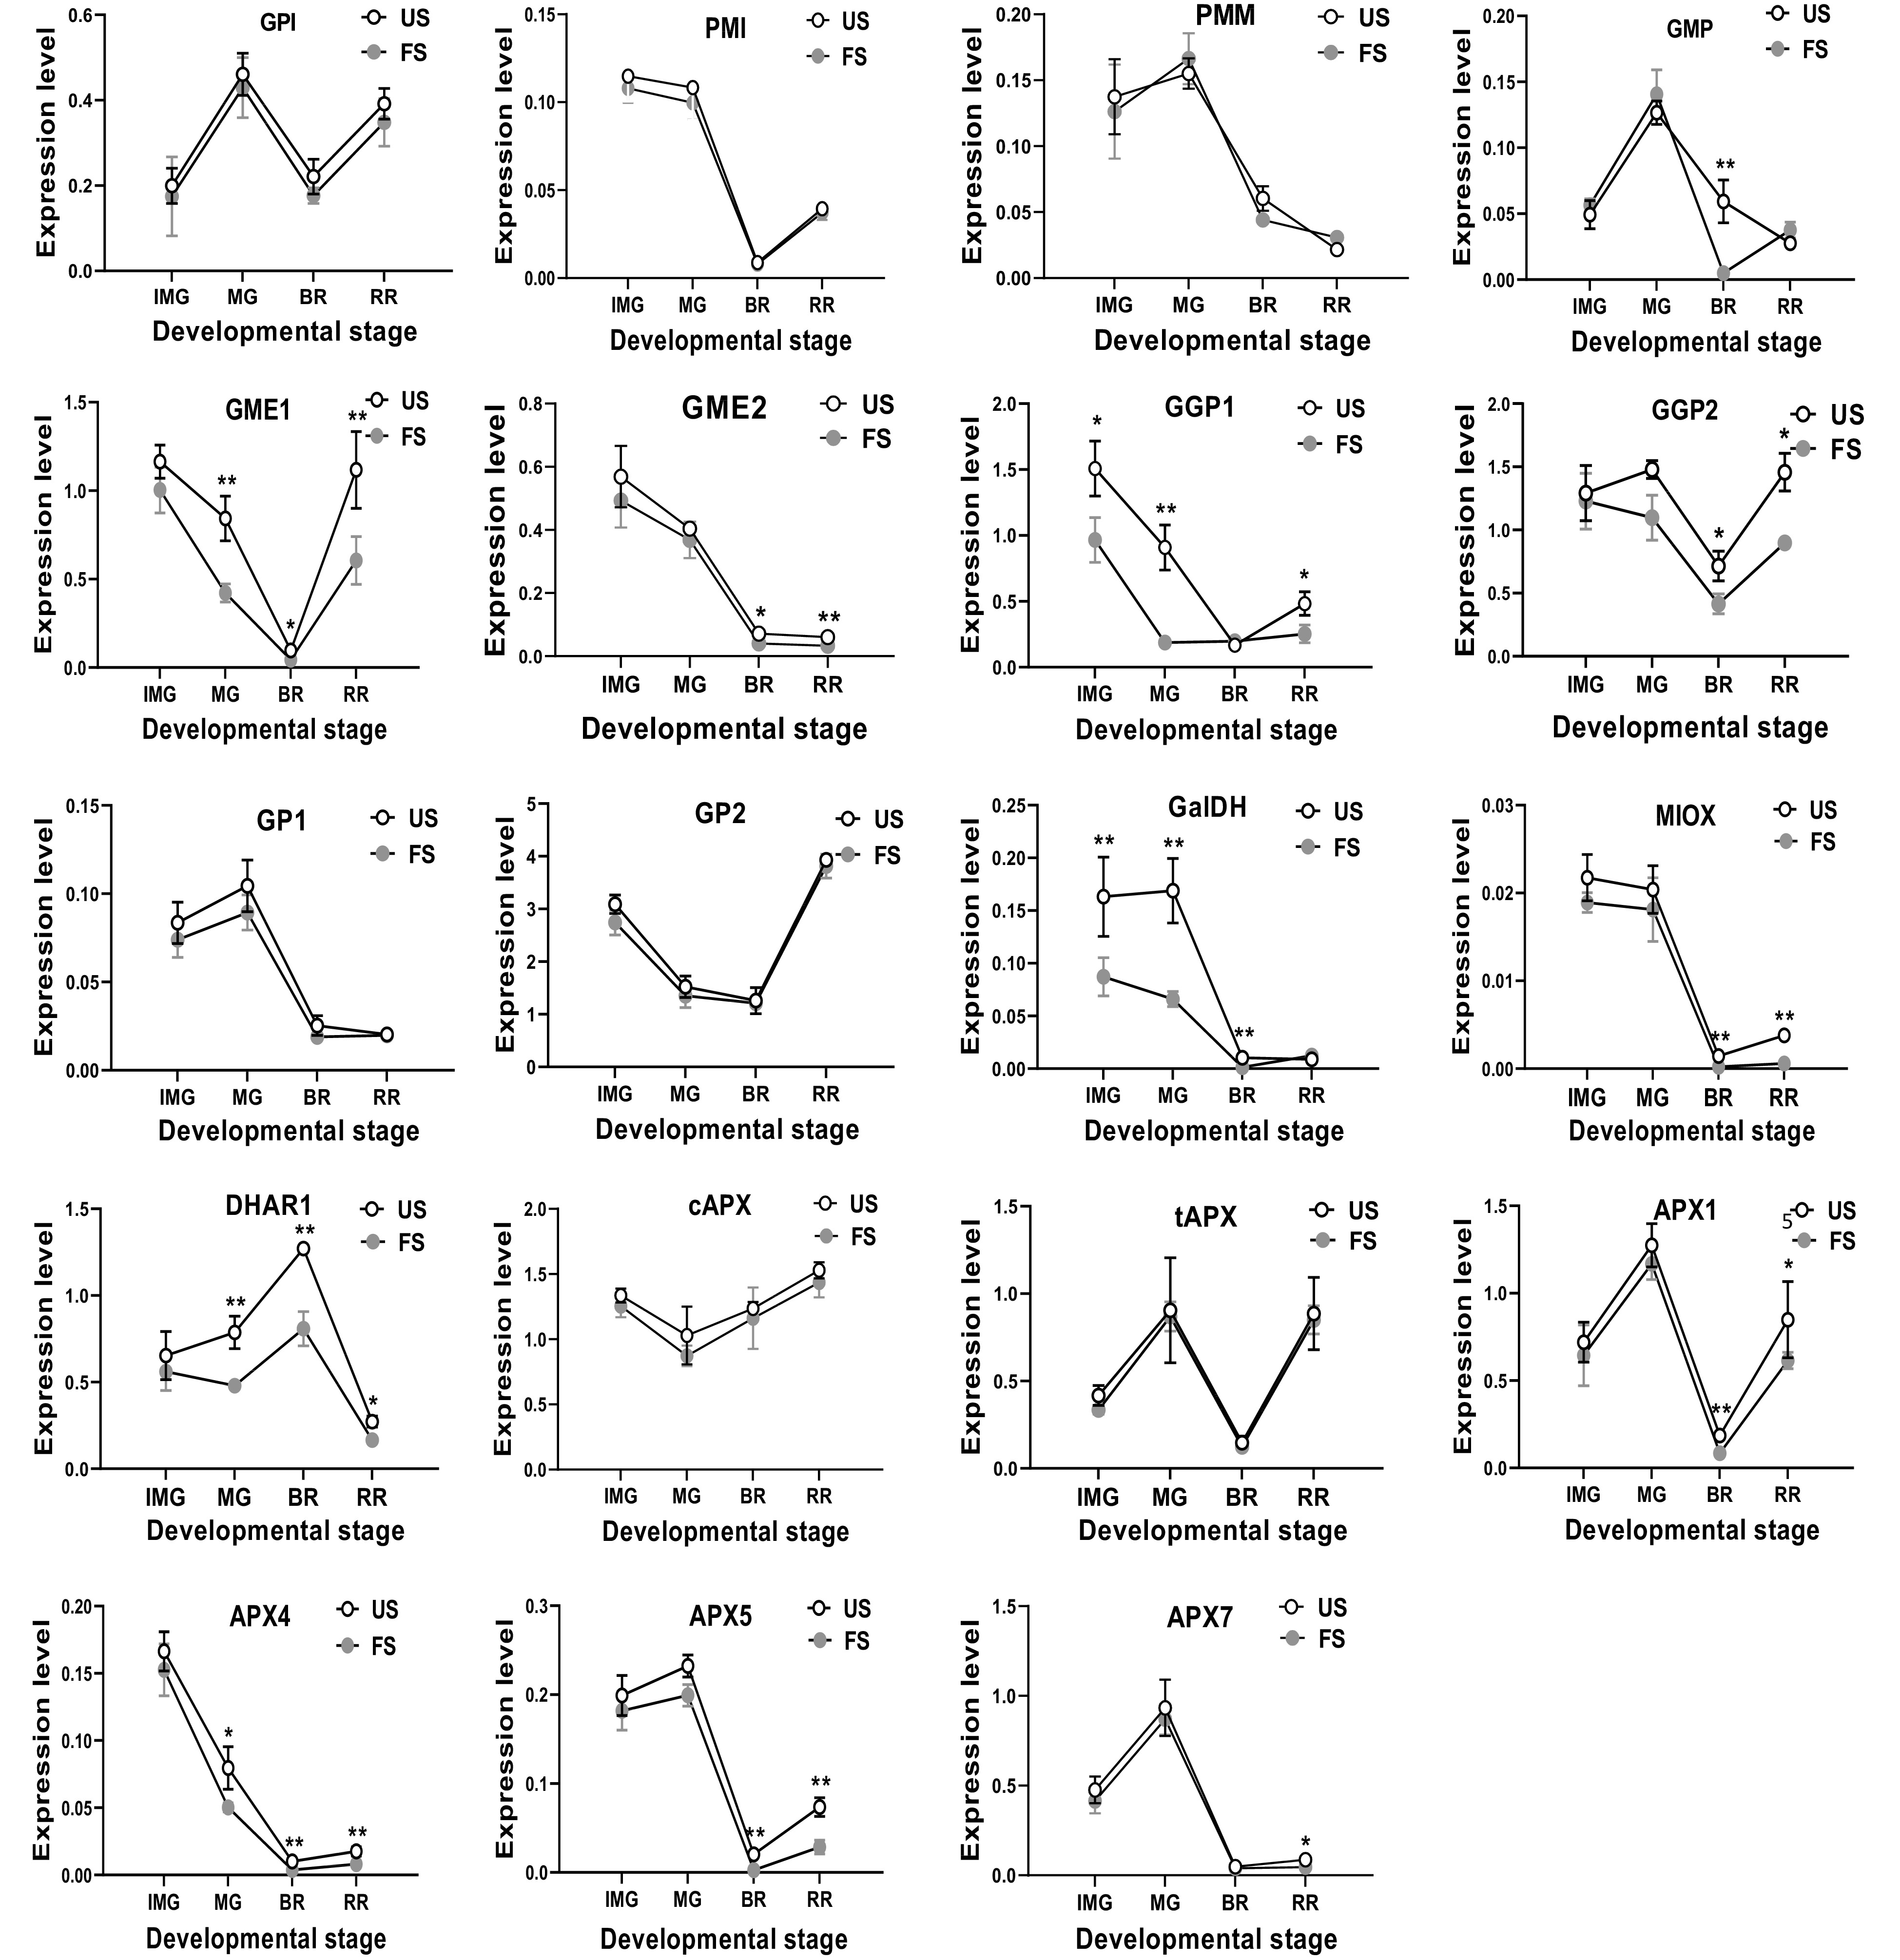
Figure 4.
The relative mRNA transcription of AsA biosynthetic genes in S. lycopersicum 'Ailsa Craig' at immature green (IMG), mature green (MG), breaker (BR) and red ripe (RR) fruits with or without fruit shading. US, un-shaded; FS, fruit shading. Data is presented as mean values ± SD (n = 3). * and ** indicate significant difference at P ≤ 0.05 and P ≤ 0.01 levels, respectively.
-
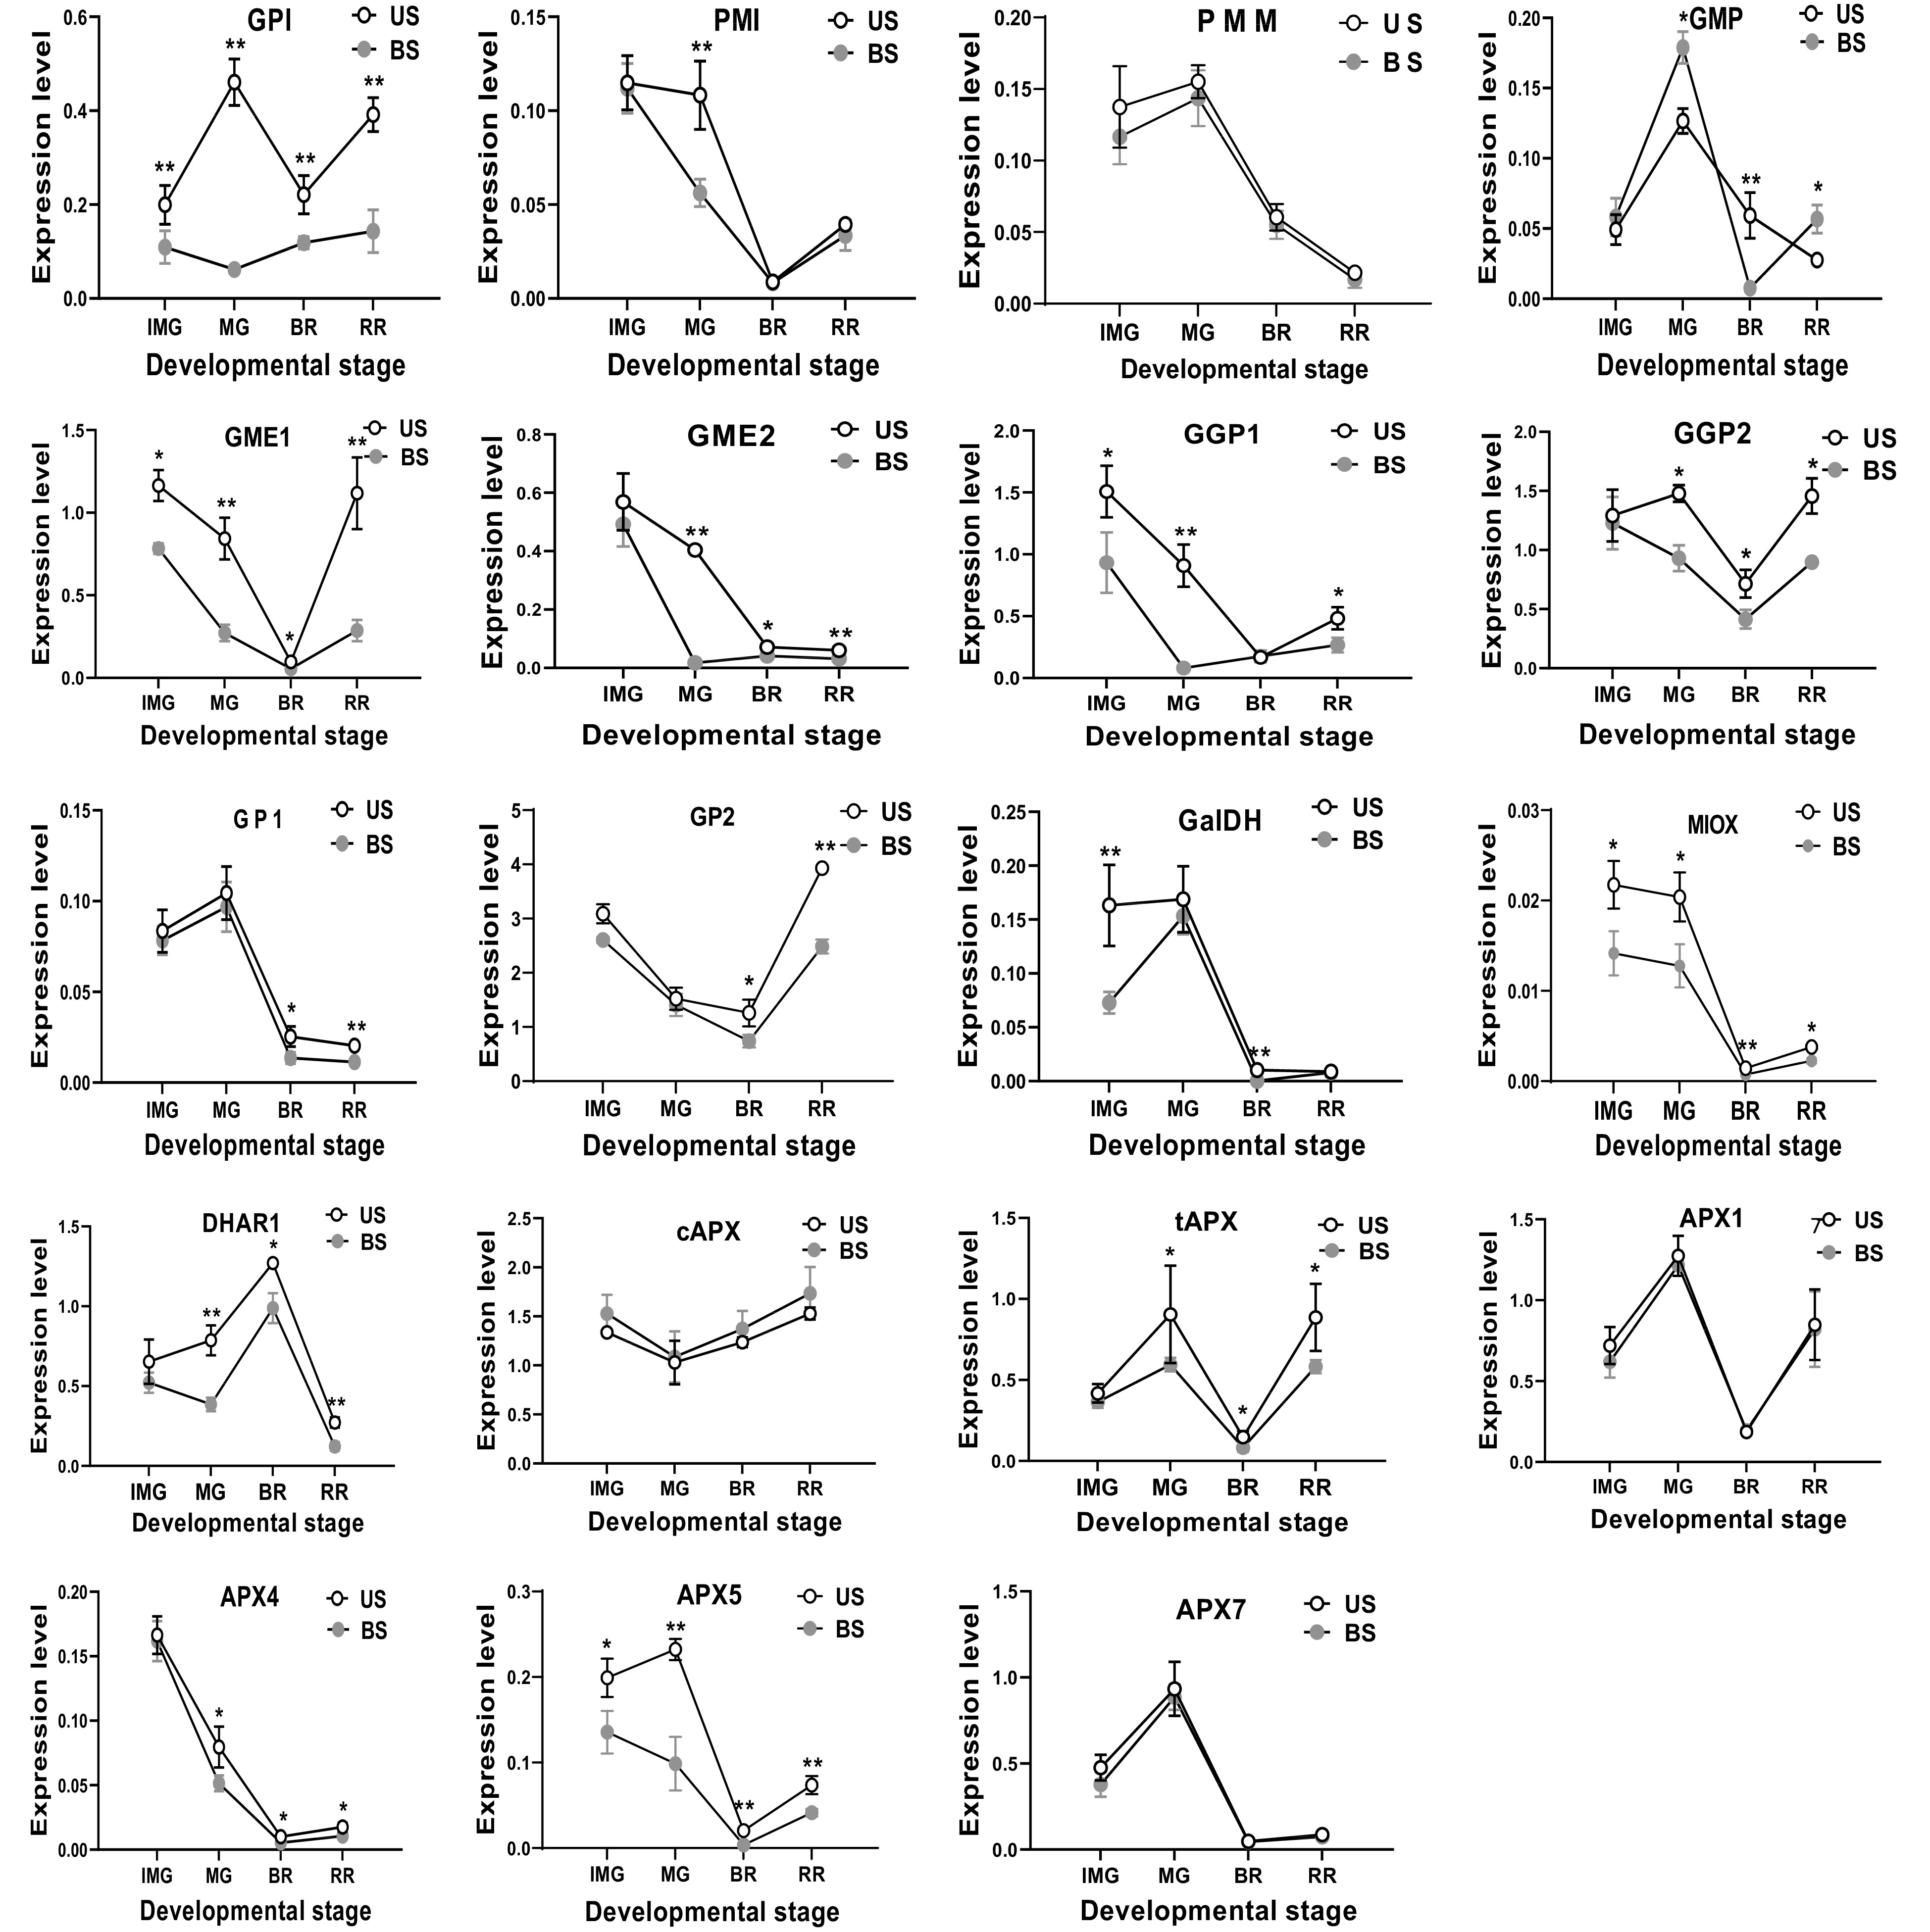
Figure 5.
The effect of leaf and fruit shading on the expression level of AsA biosynthetic genes in S. lycopersicum 'Ailsa Craig' at immature (IMG), mature (MG), breaker (BR) and red ripe (RR) fruits. US, un-shaded; BS, Both shading of leaf and fruits. Data is presented as mean values ± SD (n = 3). The * and ** illustration is a significant difference at P ≤ 0.05 and P ≤ 0.01, respectively.
-
Function Gene Full name Accession No. Forward primer (5'-3') Reverse primer (5'-3') synthesis GPI glucose-6-phosphate isomerase Solyc04g076090 TGCTCTTCAAAAGCGTGTCC CGGCAATAAGTGCTCTGTCA PMI phosphomannose isomerase Solyc02g086090 TACATTGTGGTGGAACGAGGA ACCCCATTTGGCAAGAACAG PMM phosphomannomutase Solyc05g048760 TTTACCCTCCATTACATTGCTGA TCTTCTTGACTACAGTTTCTCCCA GMP GDP-D-mannose pyrophosphorylase Solyc03g096730 AAACCTGAAATCGTGATGTGAGA TGAAGAAGAGGAGAACTGGAAAC GME1 GDP-Mannose 3′,5′-epimerase1 Solyc01g097340 AATCCGACTTCCGTGAGCC CTGAGTTGCGACCACGGAC GME2 GDP-Mannose 3′,5′-epimerase2 Solyc04g077020 CCATCACATTCCAGGACCAGA CGTAATCCTCAACCCATCCTT GGP1 GDP-L-galactose-1-phosphate phosphorylase1 Solyc06g073320 GAAATCTGGTCTGTTCCTCTGTGA TTCACACACCAACTCCACATTACA GGP2 GDP-L-galactose-1-phosphate phosphorylase2 Solyc02g091510 CTGTTGTCTTGGTTGGAGGTTGT AGCACAGTCAAAACACCAACAAA GP1 L-galactose-1-phosphate phosphatase1 Solyc04g014800 AGCCGCTACAAACCCTCATCT TGTCCGCTTTCCATCTCCTAT GP2 L-galactose-1-phosphate phosphatase2 Solyc11g012410 GGTTAGGTCCCTTCGTATGTG TTTCACAATCACAGCACCACC GalDH L-galactose dehydrogenase Solyc01g106450 CTTCTTACTGAGGCTGGTGGTC AACCTCTTTAACAGACTTCATCCC MIOX myo-inositol oxygenase Solyc12g008650 ACTACTCTTCCTTCTGCTGCTTTA AATGTTGAGCCACTTCATGTTCT recycling DHAR1 dehydroascorbate reductase 1 Solyc05g054760 CCTACCTTCGTCTCATTTCCG TGAACAAACATTCTGCCCATT oxidation cAPX Cytoplasm ascorbate peroxidase Solyc06g005150 TGGAGCCCATTAGGGAGCA GCCAGGGTGAAAGGGAACAT tAPX Thylakoidal ascorbate peroxidase Solyc11g018550 CTTTCTTCAATGGCTTCTCTCACCG CAACCTGGTAGCGAAACACATGGG APX1 ascorbate peroxidase 1 Solyc06g005160 TGGAGCCCATTAGGGAGCA GCCAGGGTGAAAGGGAACAT APX4 ascorbate peroxidase 4 Solyc01g111510 GGAACAGTTCCCAATCCTATCC CATAGGTTCCTGCATCATGCCACC APX5 ascorbate peroxidase 5 Solyc02g083620 AGTAGATGCAGAGTATCTGAAGGA CATAGGTTCCTGCATCATGCCACC APX7 Stromal ascorbate peroxidase 7 Solyc06g060260 CTTTCTTCAATGGCTTCTCTCACCG CAACCTGGTAGCGAAACACATGGG Actin Actin Solyc11g005330 GTCCTCTTCCAGCCATCCA ACCACTGAGCACAATGTTACCG Table 1.
Primers used for qPCR.
-
Genes GPI PMI PMM GMP GME1 GME2 GGP1 GGP2 GP1 GP2 GalDH MIOX DHAR1 cAPX tAPX APX1 APX4 APX5 APX7 rT-AsA US 0.5* −0.69* −0.63* −0.01 −0.36 −0.85* −0.82* −0.14 −0.57* −0.08 −0.69* −0.75* 0.08 0.2 0.26 −0.07 −0.75* −0.61* −0.37 rT-AsA LS −0.63* 0.83* 0.66* −0.03 0.58* 0.88* 0.76* 0.55* 0.67* 0.14 0.77* 0.45 0.27 −0.25 −0.25 0.29 0.81* 0.75** 0.53* rT-AsA FS −0.34 0.61* 0.54* 0.01 0.79* 0.73* 0.96** 0.6* 0.51* 0.25 0.71* 0.59* 0.22 0.31 −0.31 0.08 0.9** 0.51* 0.16 rT-AsA BS 0.1 0.90** 0.47 −0.09 0.91** 0.97** 0.94** 0.69* 0.49 0.54* 0.2 0.67* 0.11 0.26 −0.1 −0.08 0.95** 0.75* 0.13 rAsA US 0.55* -0.62* -0.52* 0.14 −0.38 −0.77* −0.78* −0.09 −0.46 −0.18 −0.59* −0.66* 0.16 0.11 0.29 0.32 −0.68* −0.52* −0.26 rAsA LS −0.4 0.83* 0.39 −0.13 0.81* 0.93** 0.91** 0.6* 0.57* 0.5* 0.65* 0.18 0.11 0.13 −0.24 0.4 0.67* 0.63* 0.3 rAsA FS −0.25 0.67* 0.52* 0.13 0.74* 0.8* 0.91** 0.64* 0.56* 0.14 0.78* 0.69* 0.28 0.21 −0.28 0.17 0.91** 0.6* 0.29 rAsA BS 0.17 0.86* 0.43 −0.11 0.88* 0.94** 0.92** 0.68* 0.44 0.56* 0.16 0.62* 0.11 0.34 −0.09 −0.09 0.91** 0.72* 0.09 * and ** indicate a significant correlation at P < 0.05 and P < 0.01, respectively. Table 2.
The correlation coefficient between AsA biosynthetic gene expression and AsA accumulation in fruits with shading or un-shaded treatment.
Figures
(5)
Tables
(2)