-
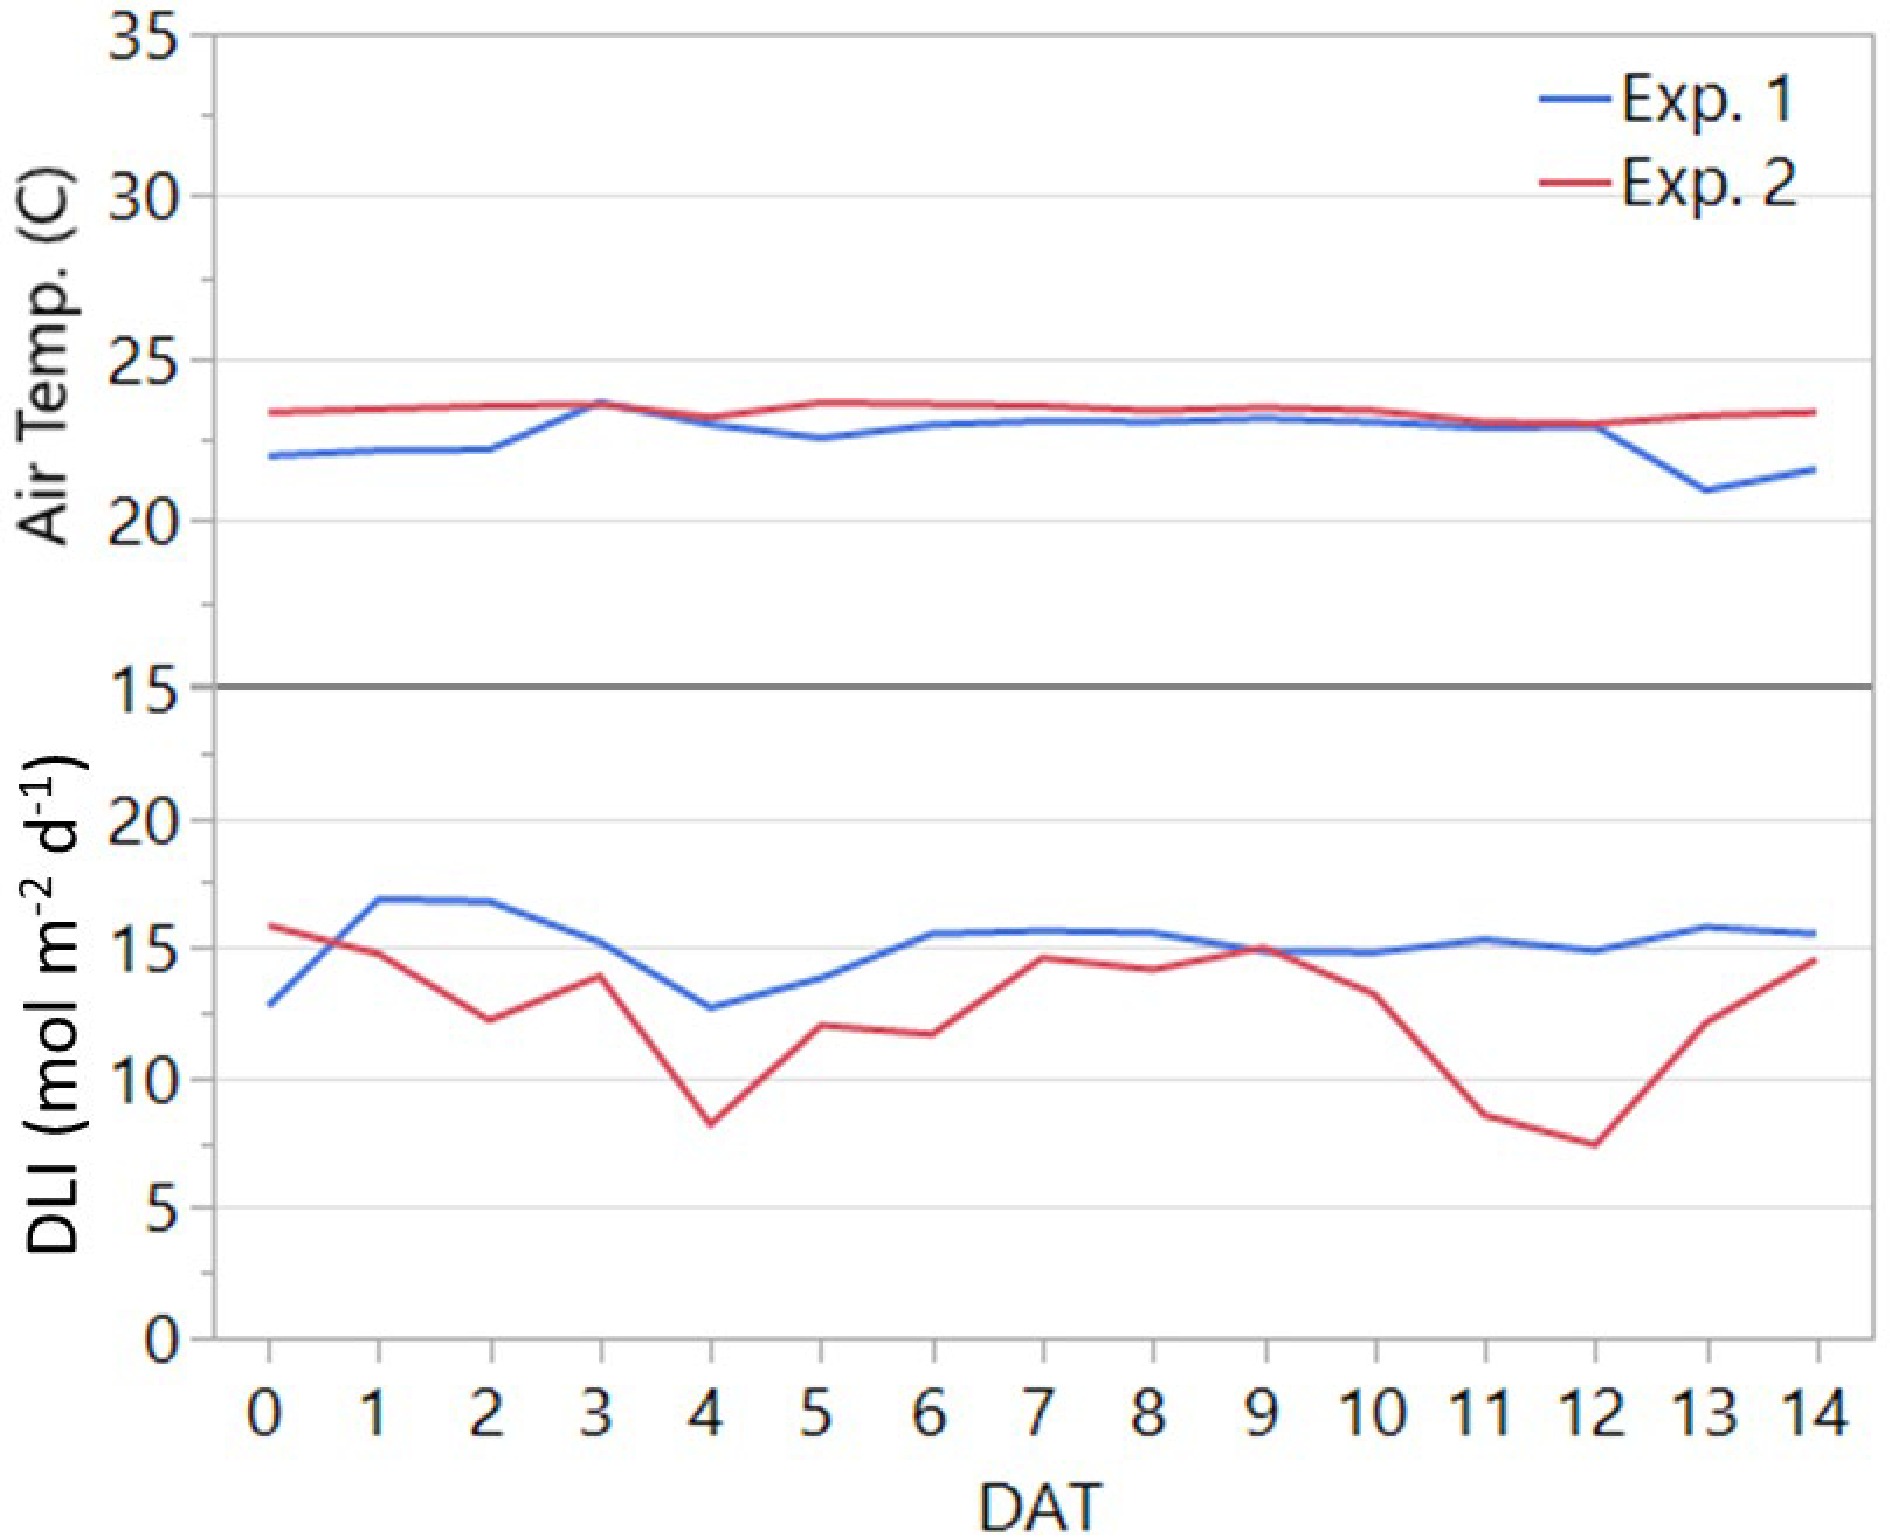
Figure 1.
Average daily air temperature and daily light integral (DLI) in the greenhouse throughout the two experiments. The duration of both experiments was 14 days after transplanting (DAT). Experiments 1 and 2 were conducted from 29 May to 12 June and from 24 June to 09 July 2020, respectively.
-
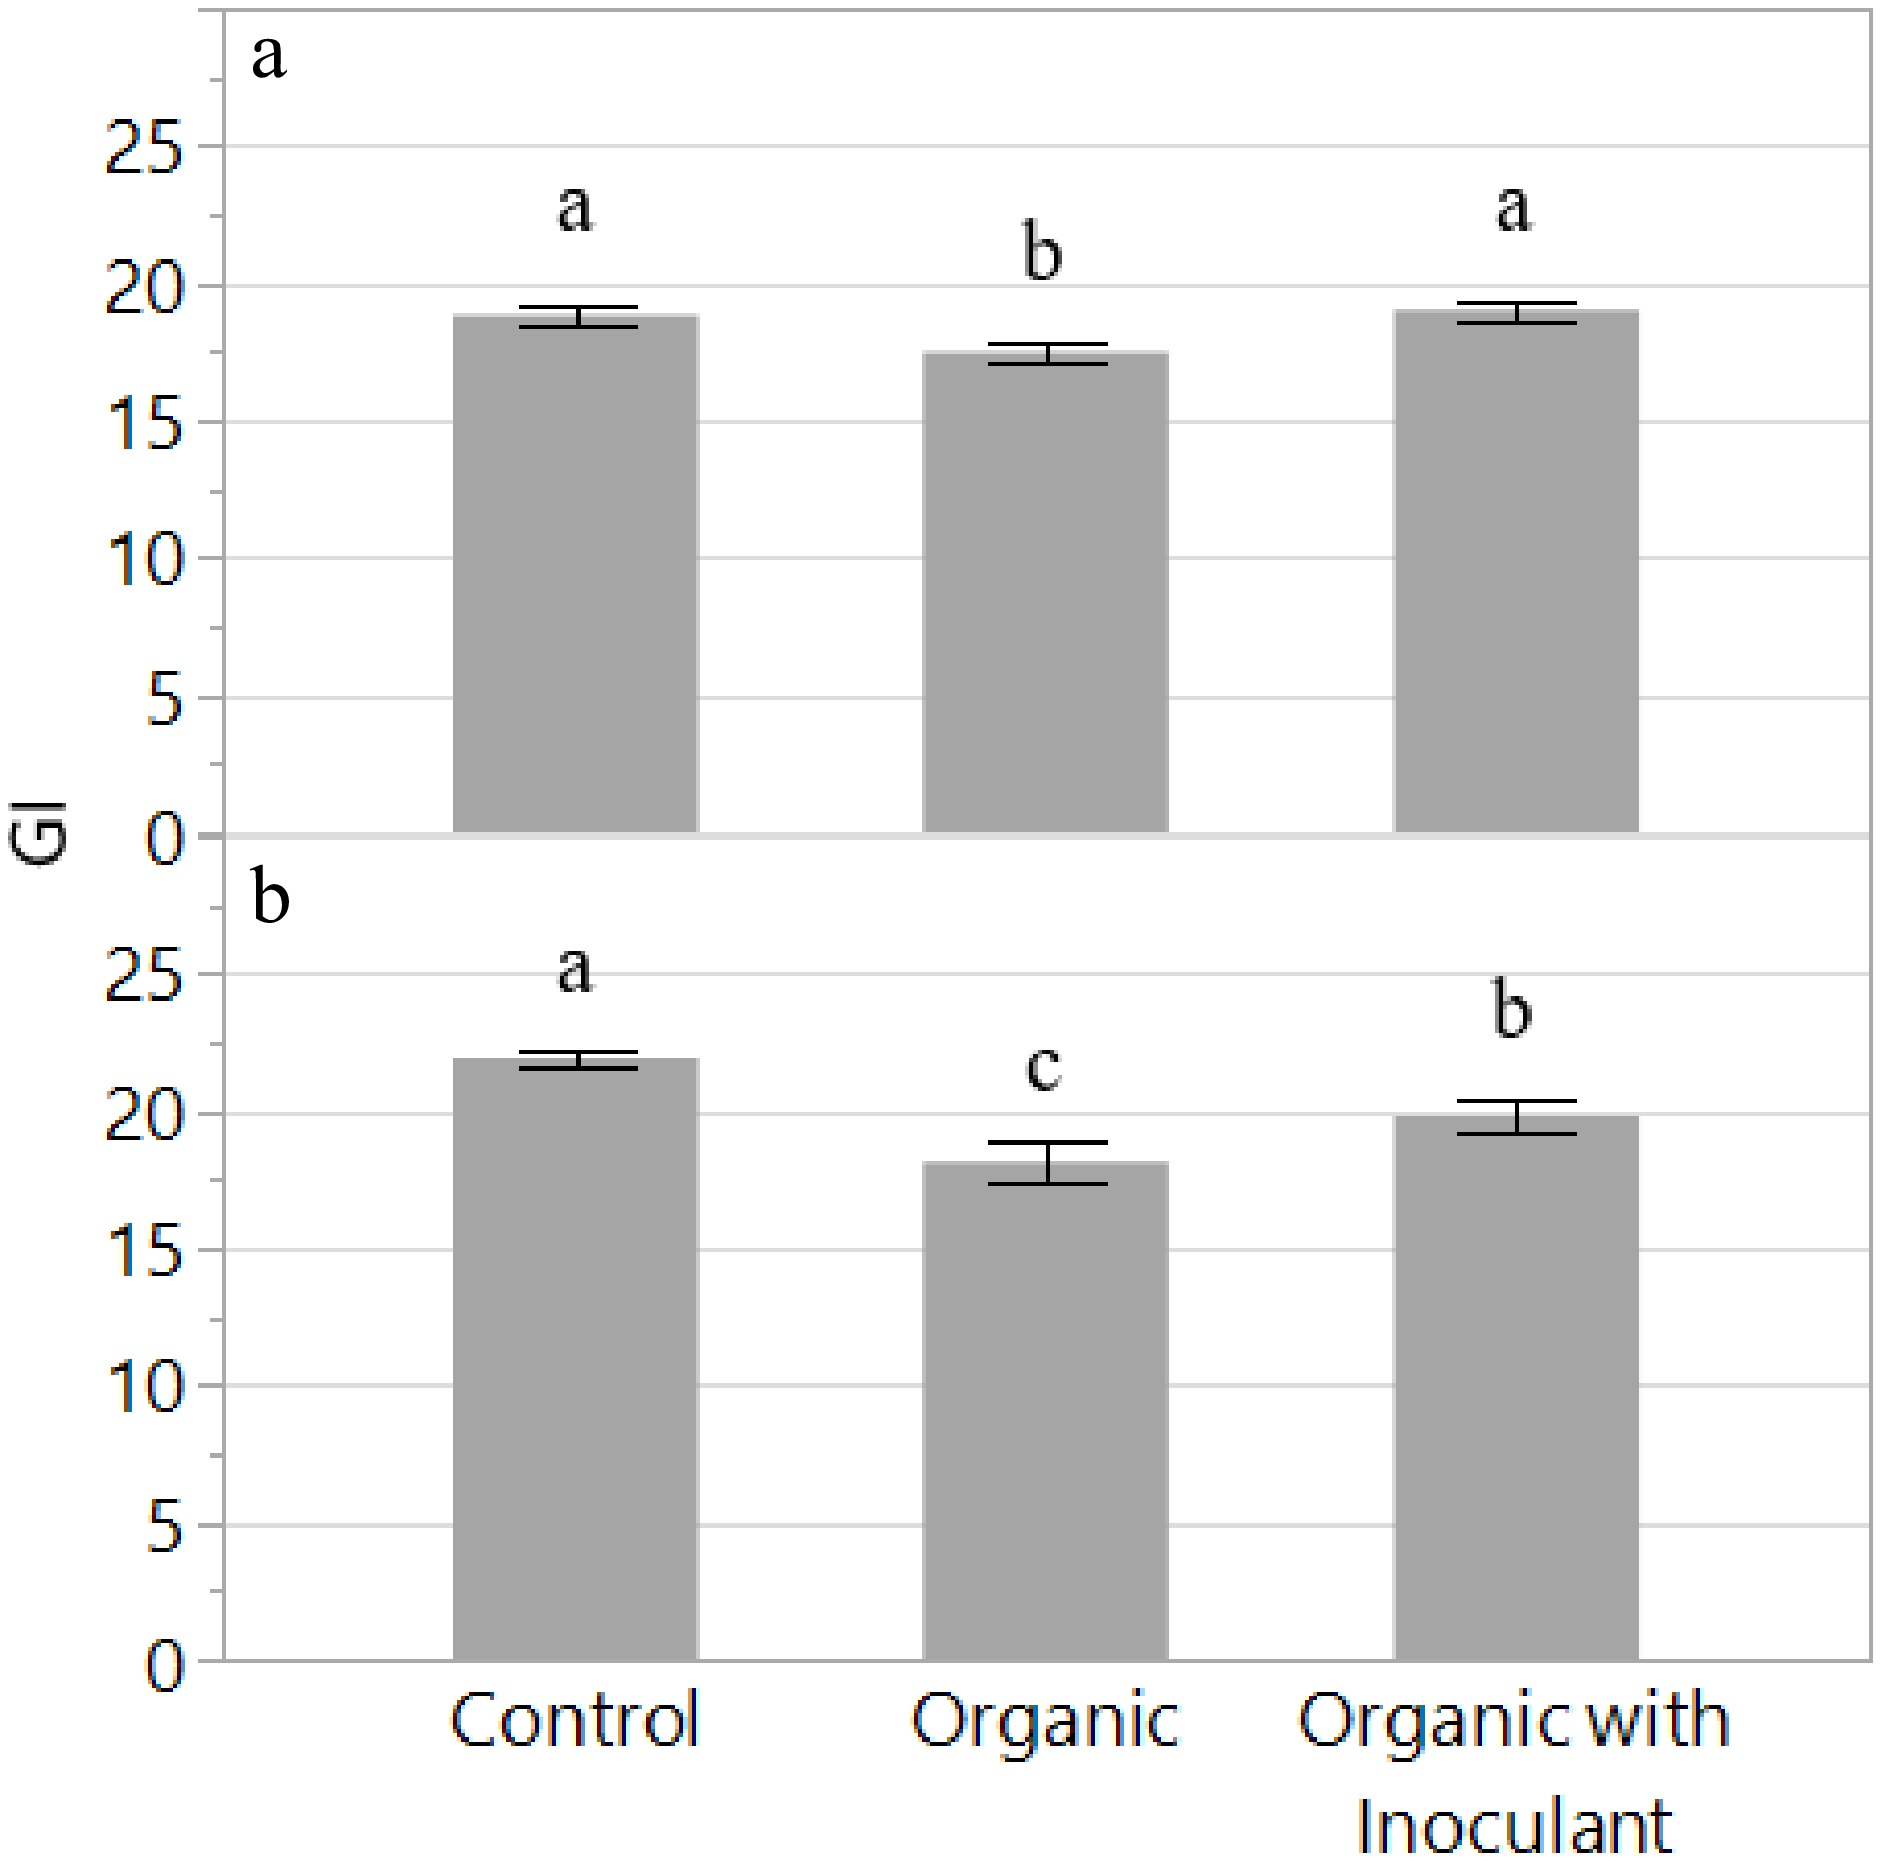
Figure 2.
Growth Index (GI) of the lettuce variety 'Red Mist' grown for two weeks in an NFT hydroponic system fertilized with a conventional (Control) or an organic fertilizer with or without a microbial inoculant. The experiment was replicated and presented separately: Experiment 1 (a) and Experiment 2 (b). Bars represent standard error. Means followed by different letters indicate significant differences among treatments according to Tukey's HSD test (P < 0.05).
-
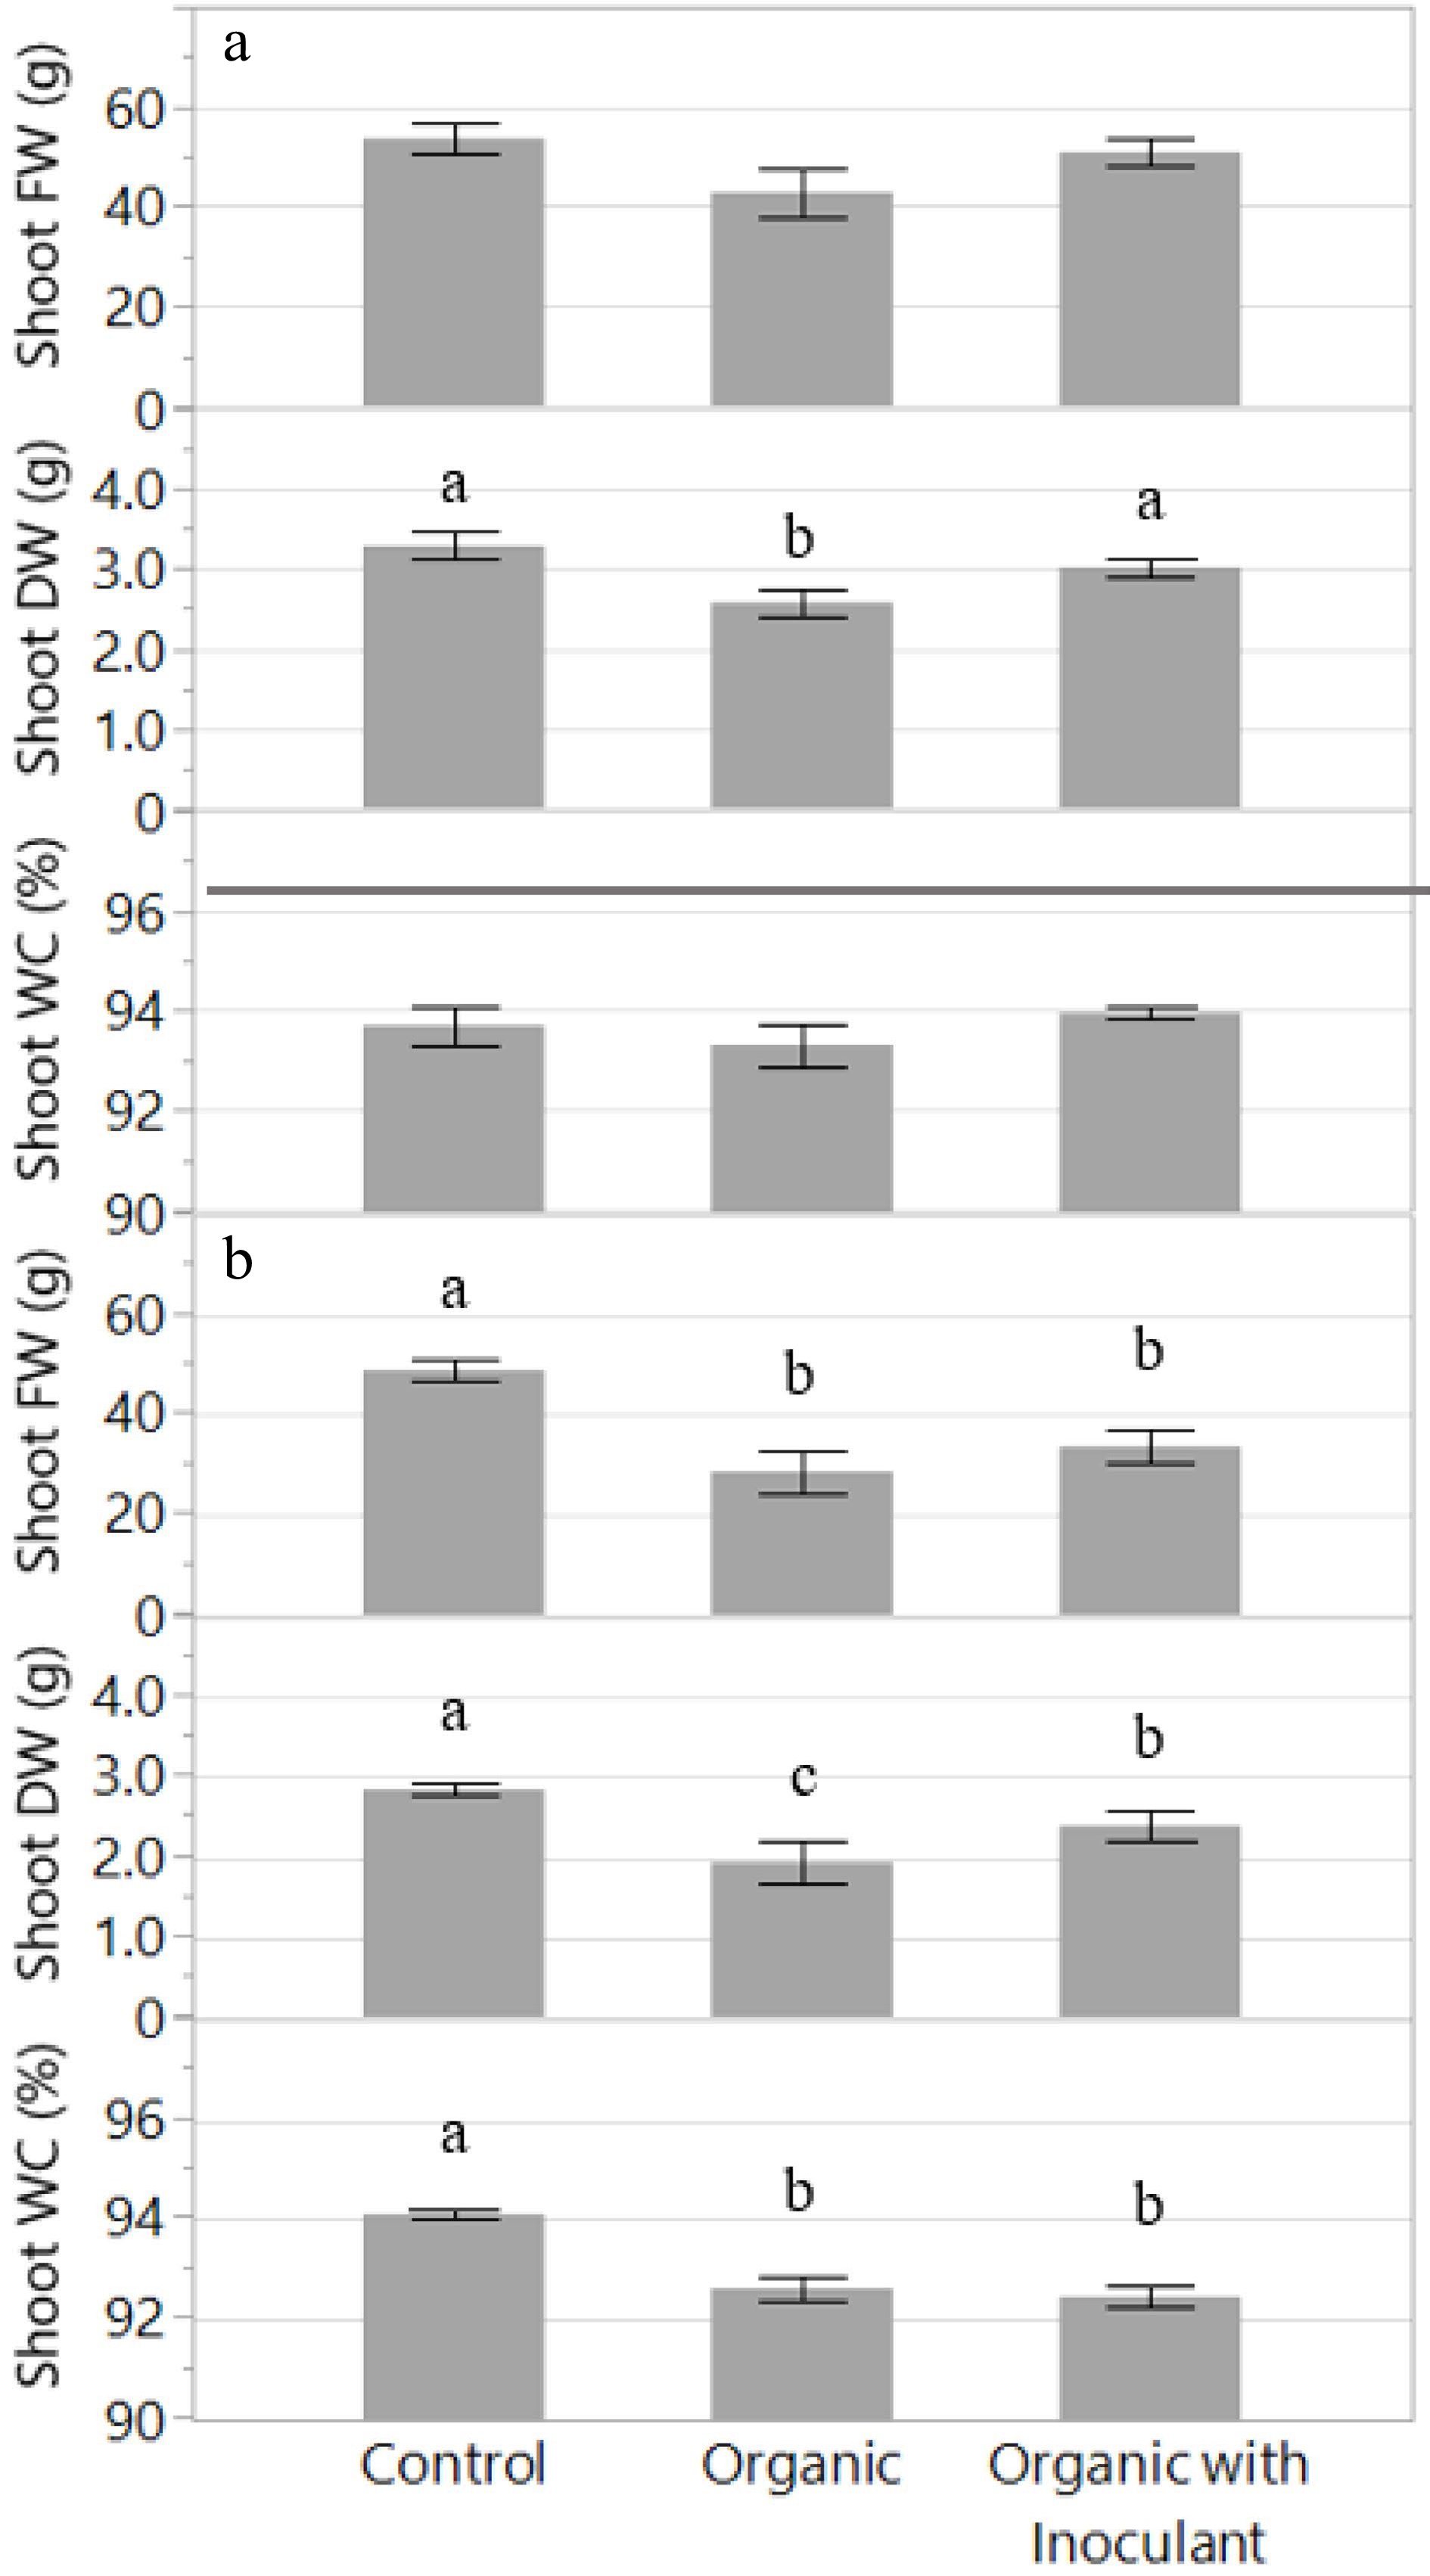
Figure 3.
Shoot fresh weight (FW), dry weight (DW), and water content (WC) of the lettuce variety 'Red Mist' (per plant) grown for two weeks in an NFT hydroponic system fertilized with a conventional (Control) or an organic fertilizer with or without a microbial inoculant. The experiment was replicated and presented separately: Experiment 1 (a) and Experiment 2 (b). Bars represent standard error. Means followed by different letters indicate significant differences among treatments according to Tukey's HSD test (P < 0.05).
-
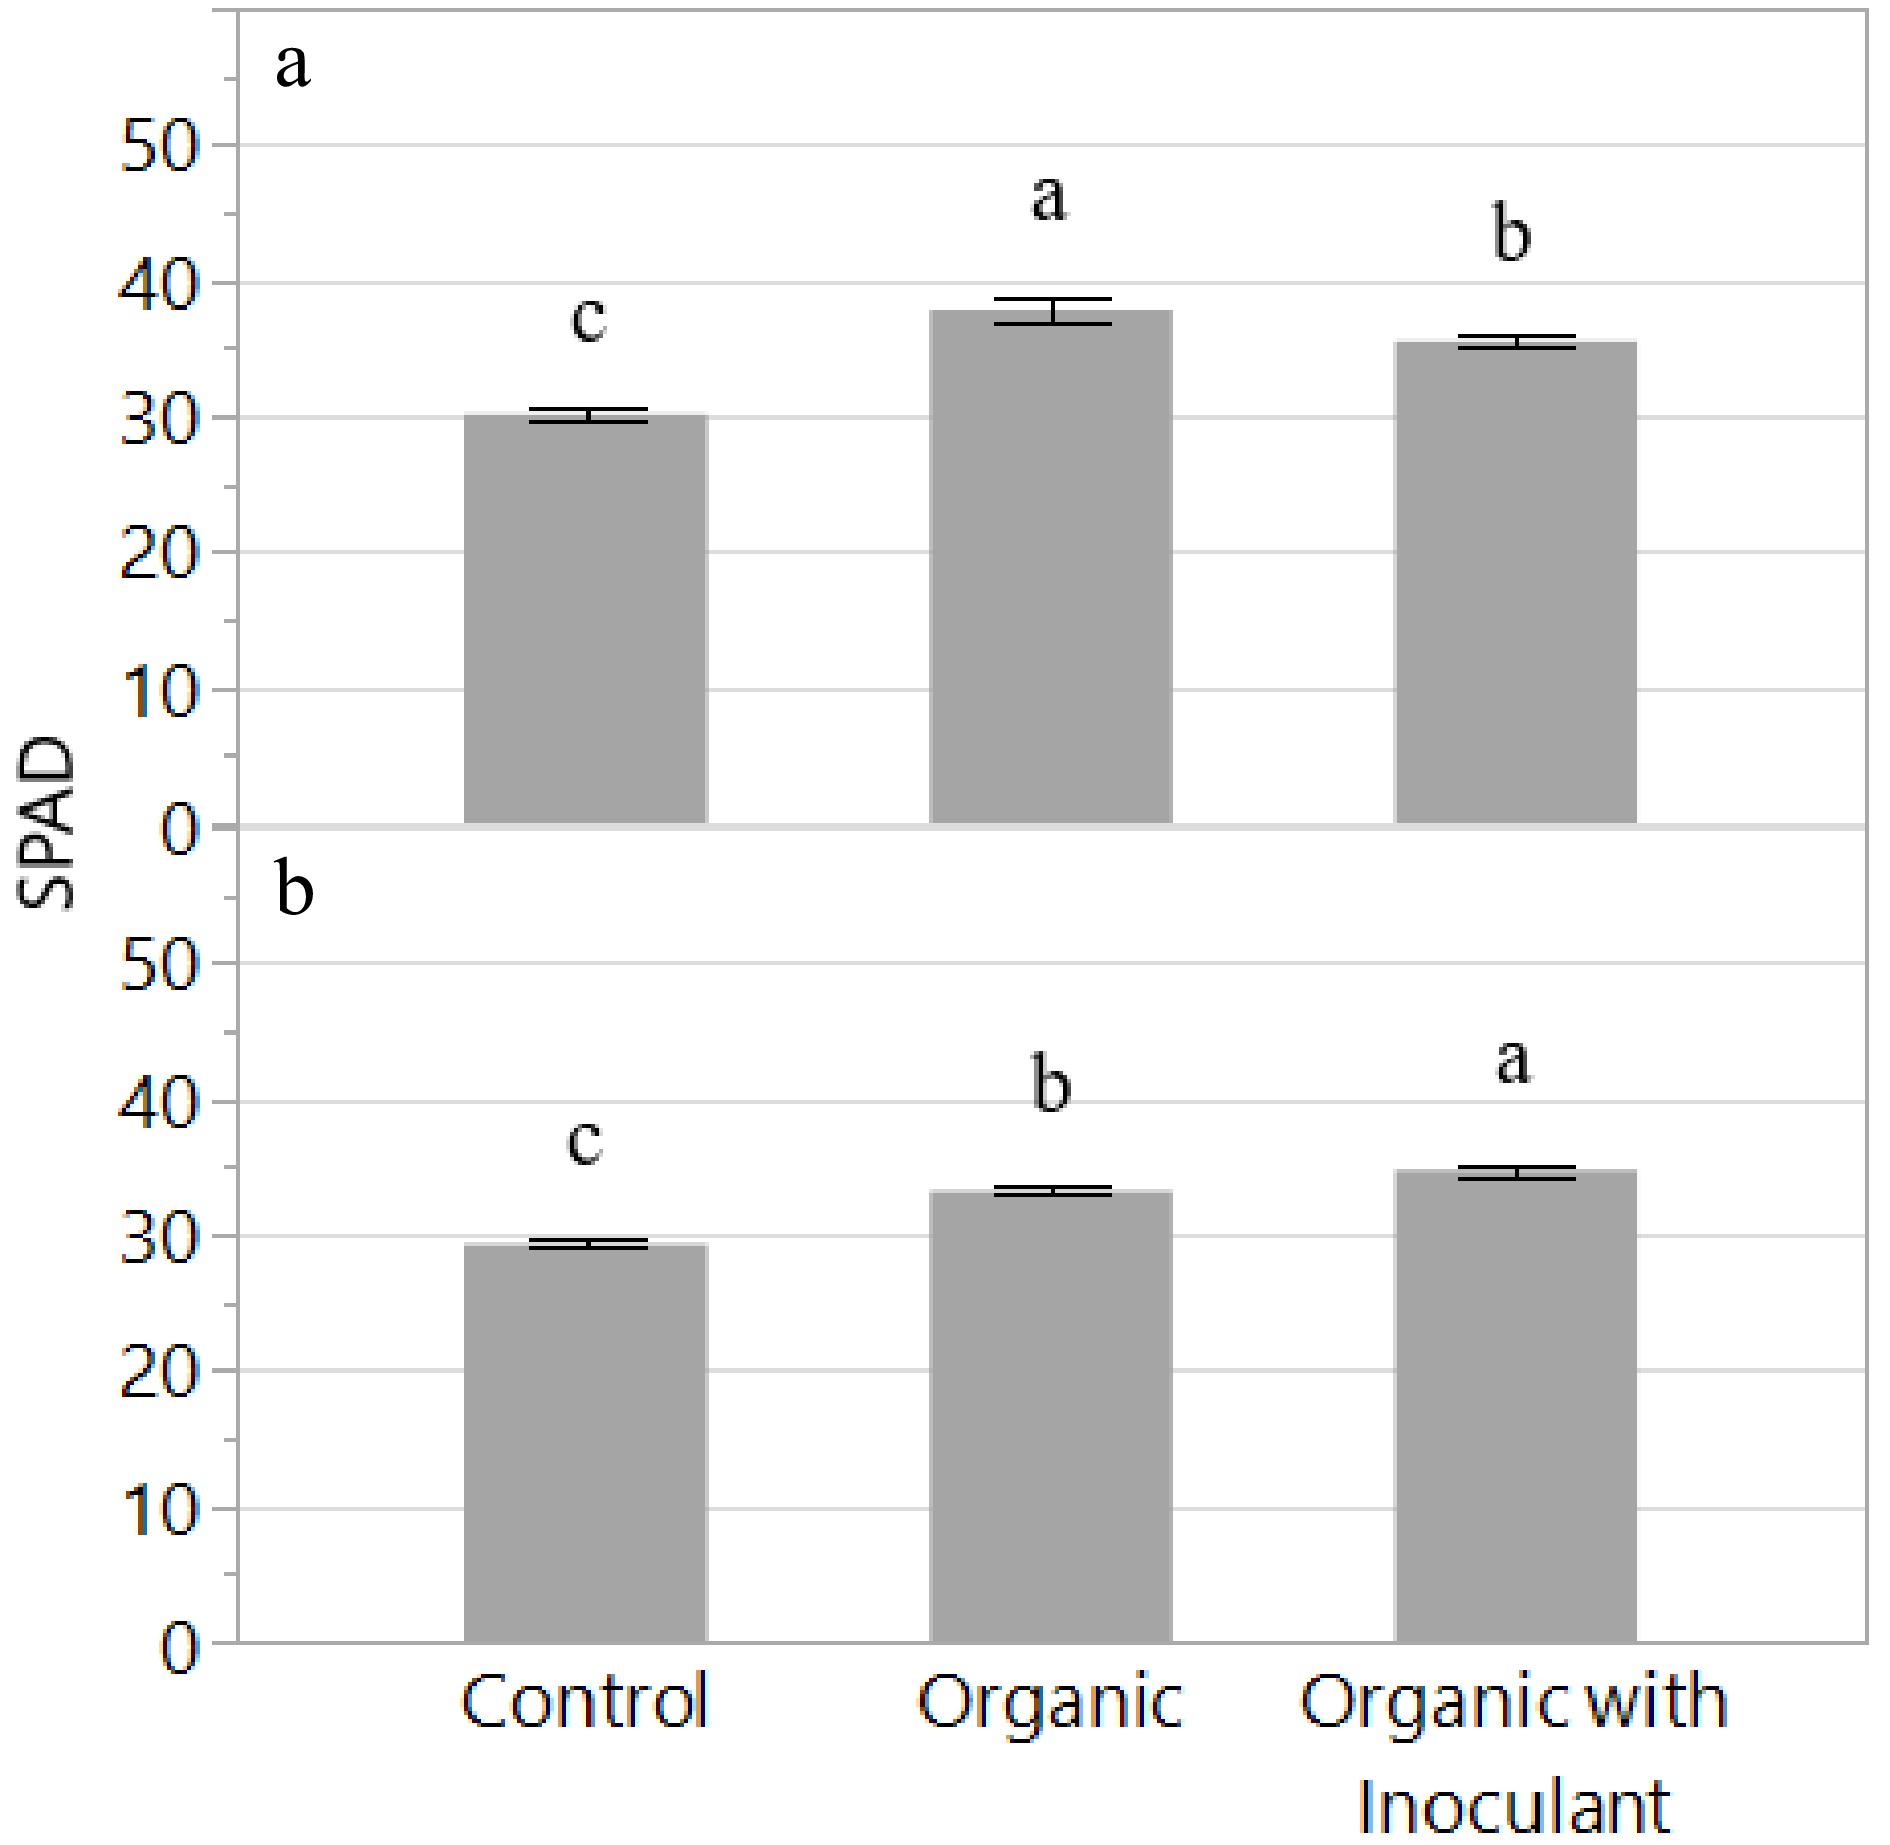
Figure 4.
Relative Chlorophyll Content (SPAD) of the lettuce variety 'Red Mist' grown for two weeks in an NFT hydroponic system fertilized with a conventional (Control) or an organic fertilizer with or without a microbial inoculant. The experiment was replicated and presented separately: Experiment 1 (a) and Experiment 2 (b). Bars represent standard error. Means followed by different letters indicate significant differences among treatments according to Tukey's HSD test (P < 0.05).
-
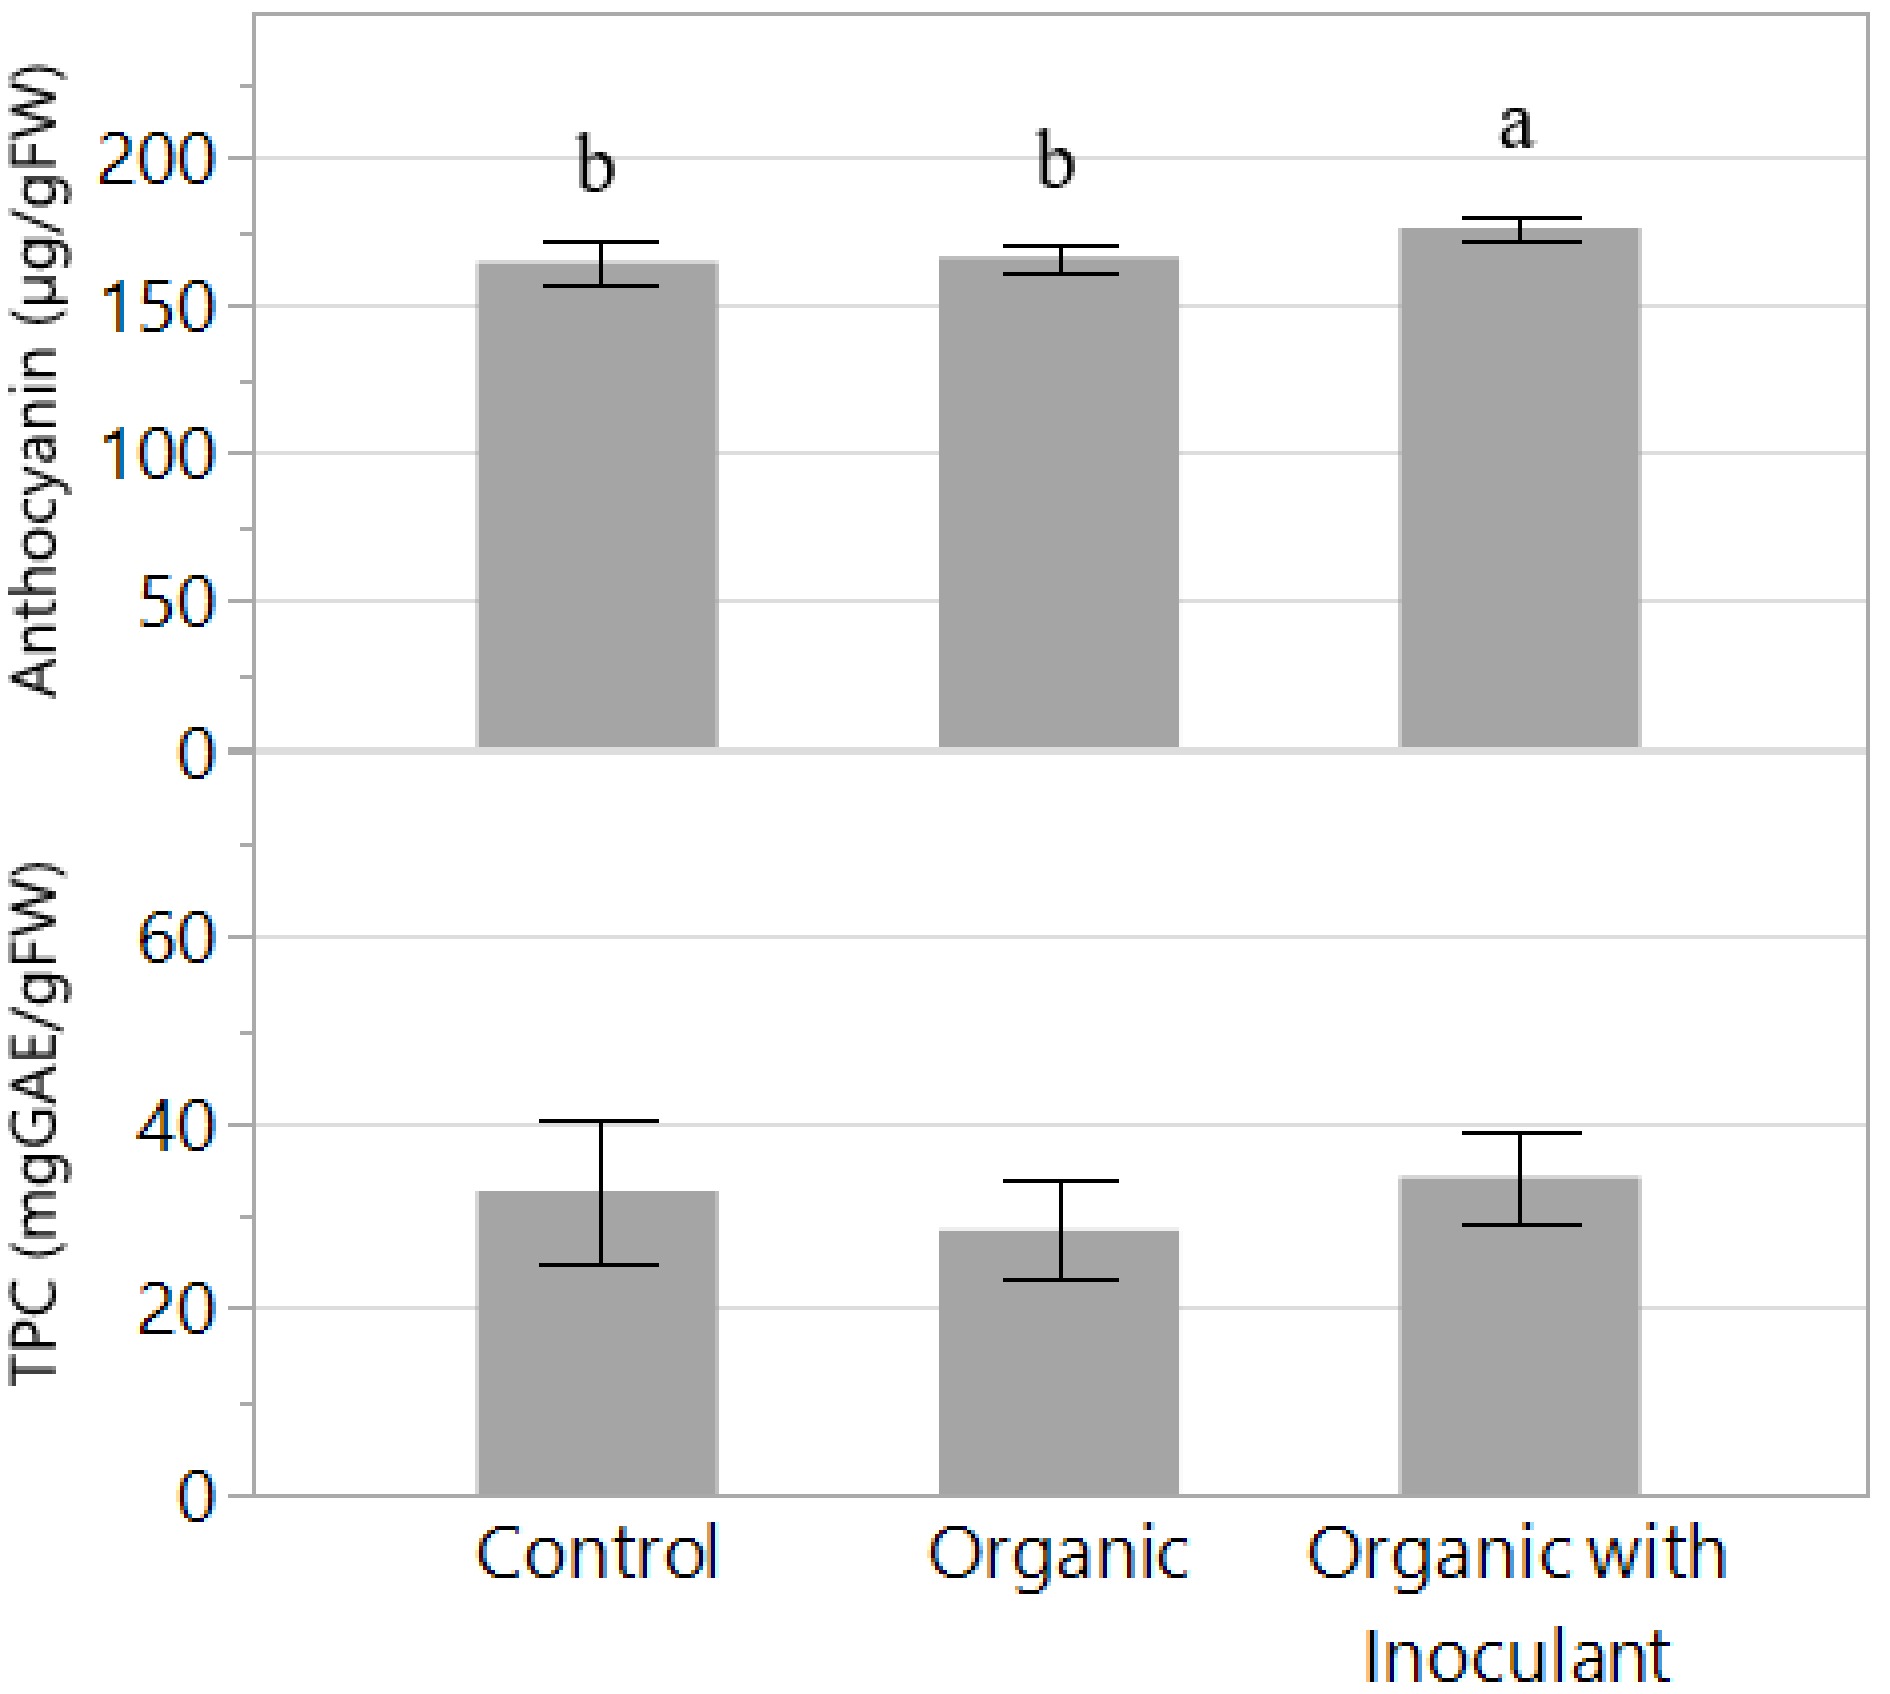
Figure 5.
Anthocyanin and total phenolic content (TPC) of the lettuce variety 'Red Mist' grown for two weeks in an NFT hydroponic system fertilized with a conventional (Control) or an organic fertilizer with or without a microbial inoculant. The experiment was replicated but only data from the second experiment is presented. Bars represent standard error. Means followed by different letters indicate significant differences among treatments according to Tukey's HSD test (P < 0.05).
-
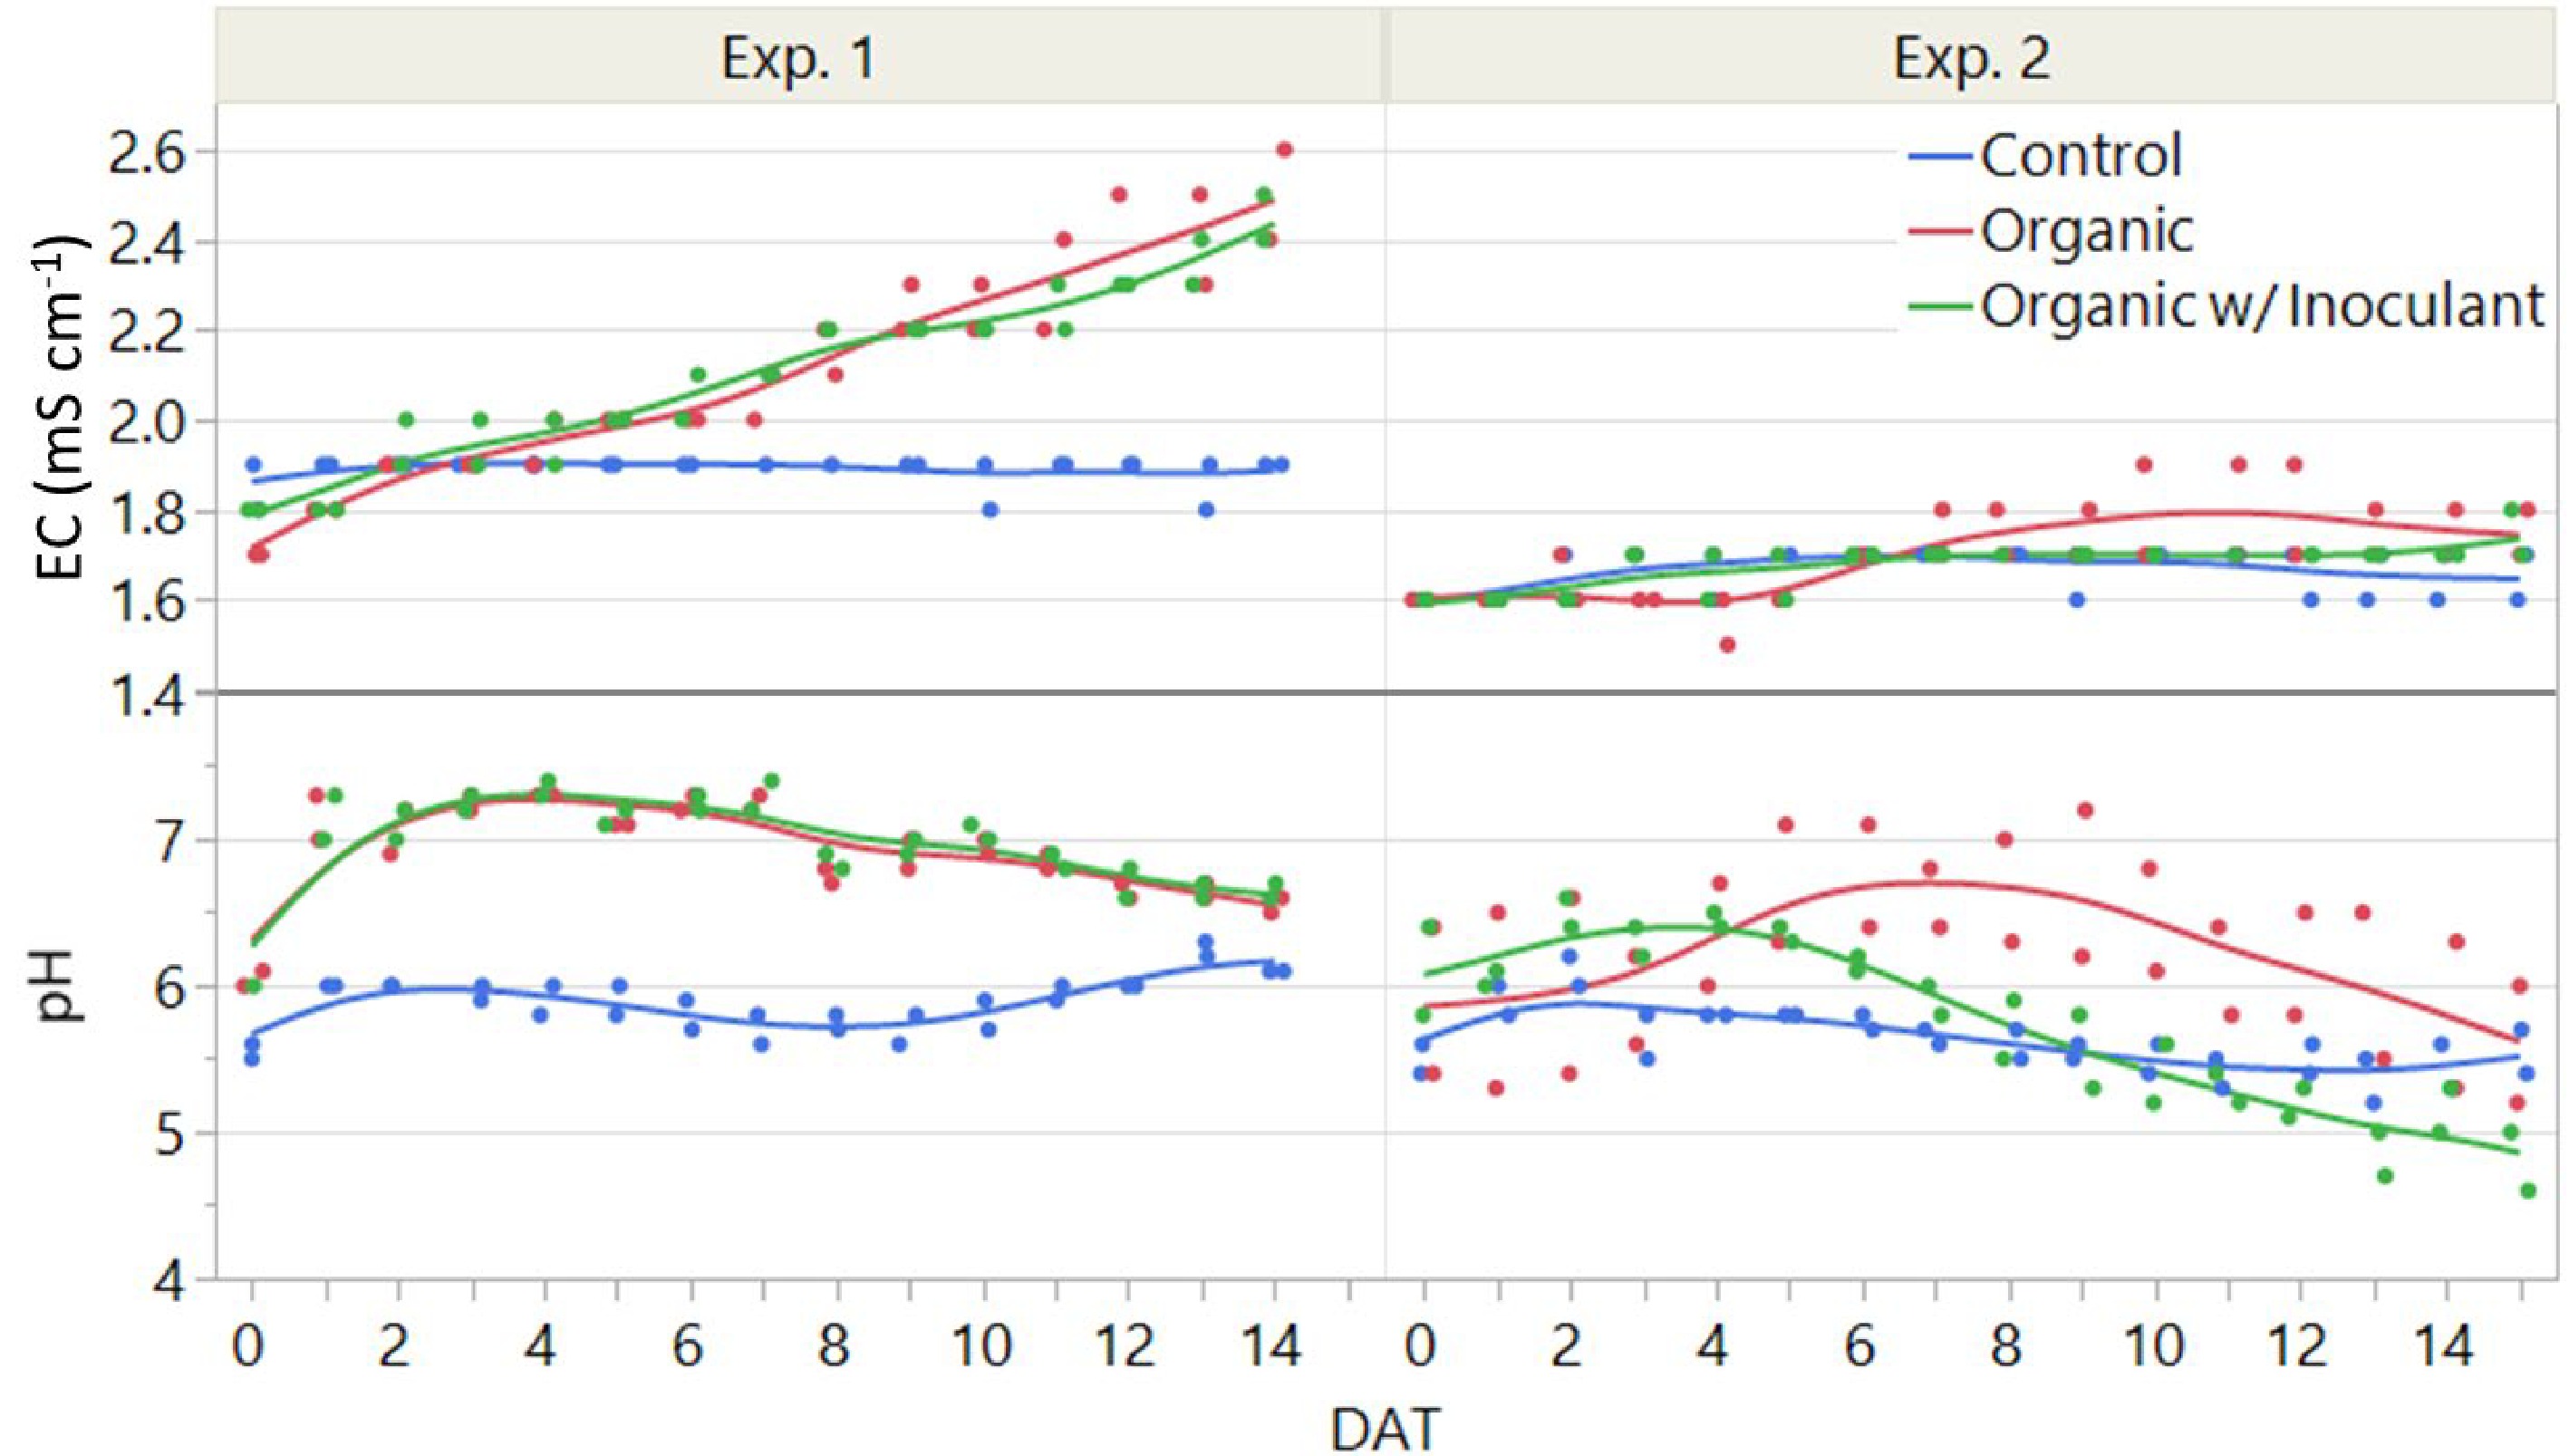
Figure 6.
Electrical conductivity (EC) and pH of the three nutrient solutions, including a conventional (Control) and an organic fertilizer with or without inoculant, used to grow lettuce in an NFT hydroponic system in a greenhouse for two weeks, or 14 days after transplant (DAT). The experiment was replicated twice. The control solution was prepared fresh for both experiments while the organic solutions were replenished and re-used in Experiment 2 to evaluate the effectiveness of the microbial inoculant.
-
Element Control Organic Organic with
inoculantExperiment 1 (mg/gDW) N 59.85 b 52.99 c 65.94 a P 9.04 b 7.83 c 10.09 a K 80.79 67.97 53.09 Ca 7.93 8.58 5.64 Mg 3.42 b 3.36 b 3.80 a S 4.04 b 3.41 b 4.80 a Fe 0.102 b 0.099 b 0.116 a B 0.047 0.038 0.063 Cu 0.016 0.015 0.025 Mn 0.131 ab 0.102 b 0.217 a Zn 0.064 ab 0.056 b 0.070 a Experiment 2 N 49.45 53.34 47.46 P 7.40 7.45 7.32 K 68.36 a 46.08 b 43.92 b Ca 9.65 a 6.40 b 4.87 c Mg 3.36 2.89 3.12 S 2.95 b 3.68 a 4.07 a Fe 0.079 b 0.099 a 0.086 b B 0.019 b 0.043 a 0.046 a Cu 0.008 b 0.017 a 0.020 a Mn 0.066 b 0.232 a 0.247 a Zn 0.047 ab 0.054 a 0.039 b The experiment was replicated, and data is presented from both experi-ments. Means followed by different letters indicate significant differences among treatments according to Tukey's HSD test (P <0.05). Table 1.
Leaf tissue mineral concentration of the lettuce variety 'Red Mist' grown for two weeks in an NFT hydroponic system fertilized with a conventional (Control) or an organic fertilizer with or without a microbial inoculant.
Figures
(6)
Tables
(1)