-
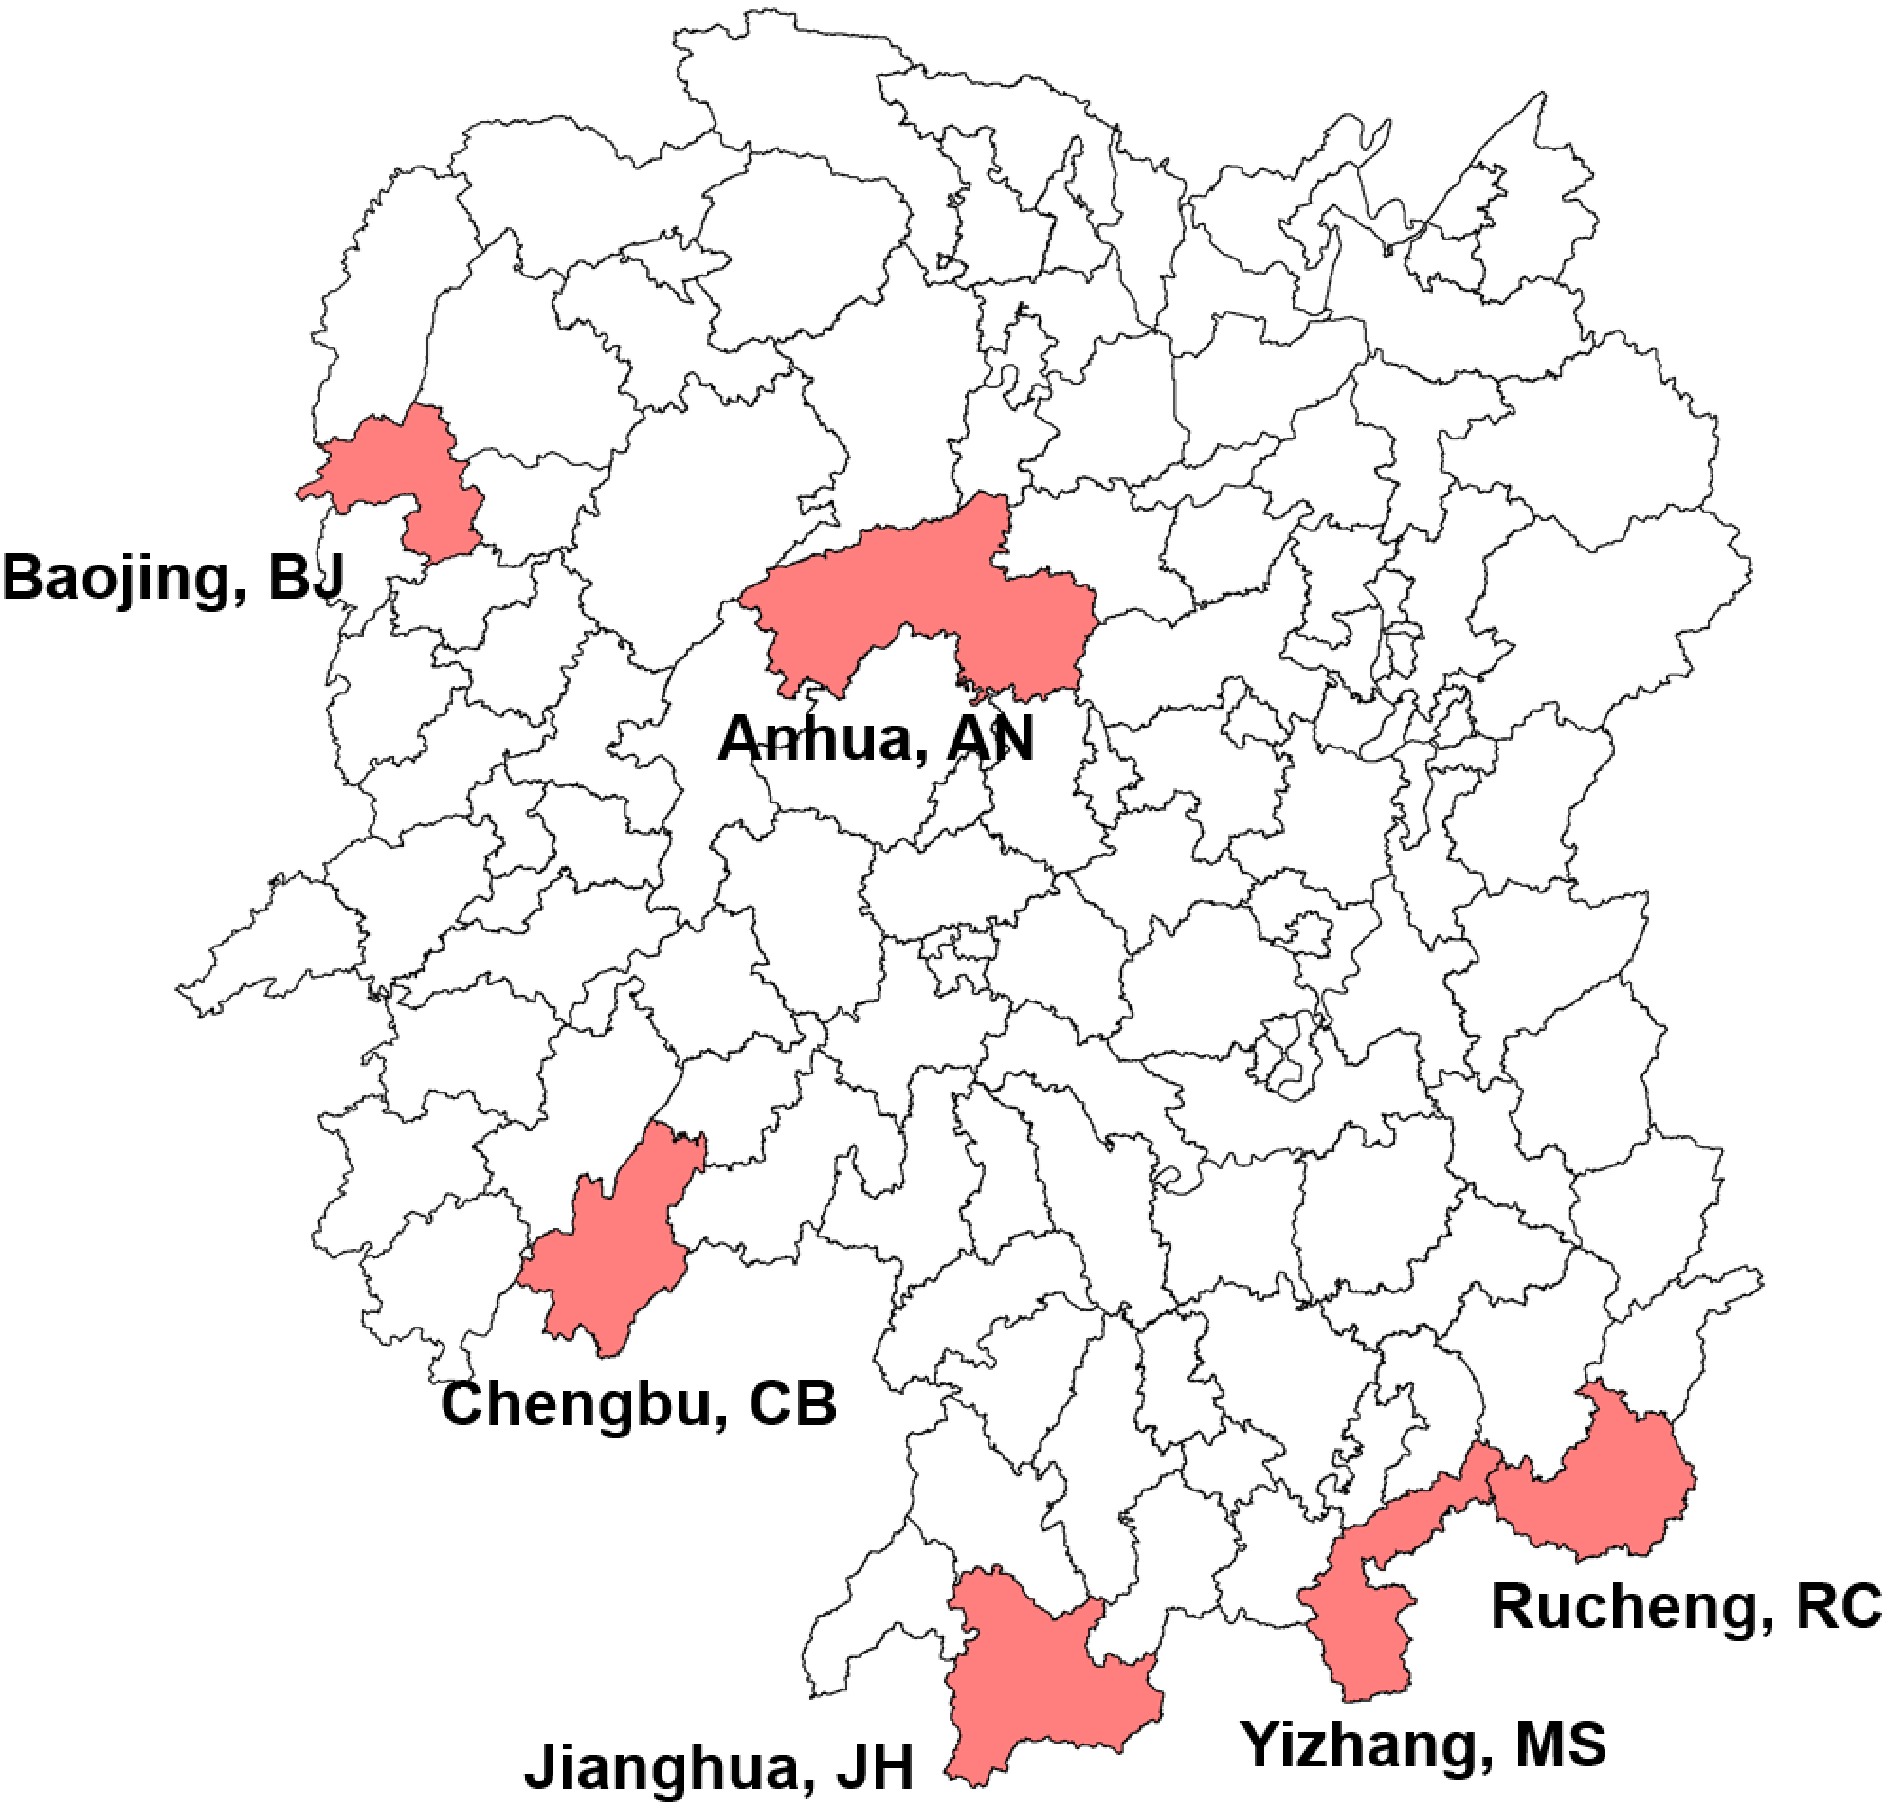
Figure 1.
Geographical distribution of Hunan tea plant accessions used in this study. The geographical locations were indicated under the corresponding regions, followed by the abbreviated population name.
-
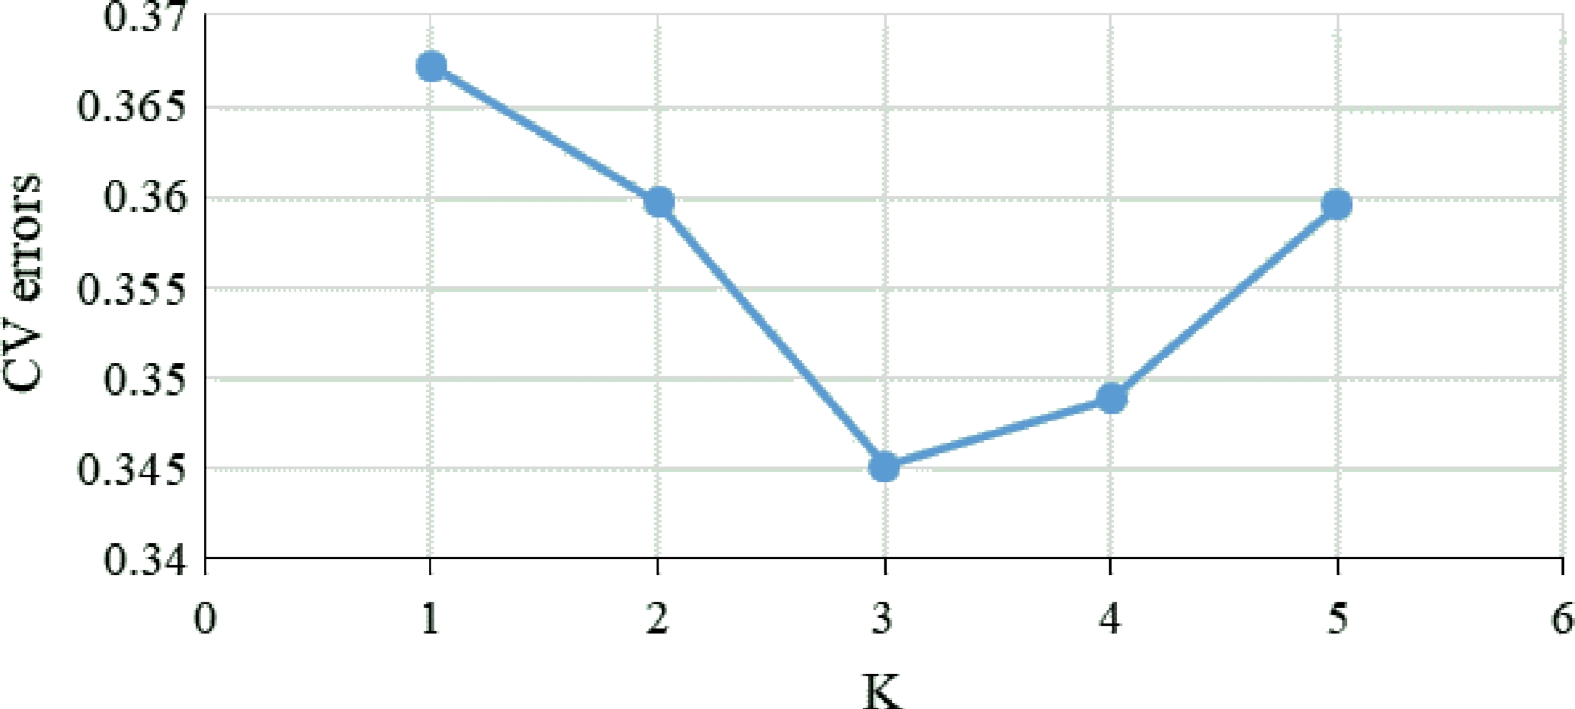
Figure 2.
Calculation of CV errors for K values from 1 to 5.
-
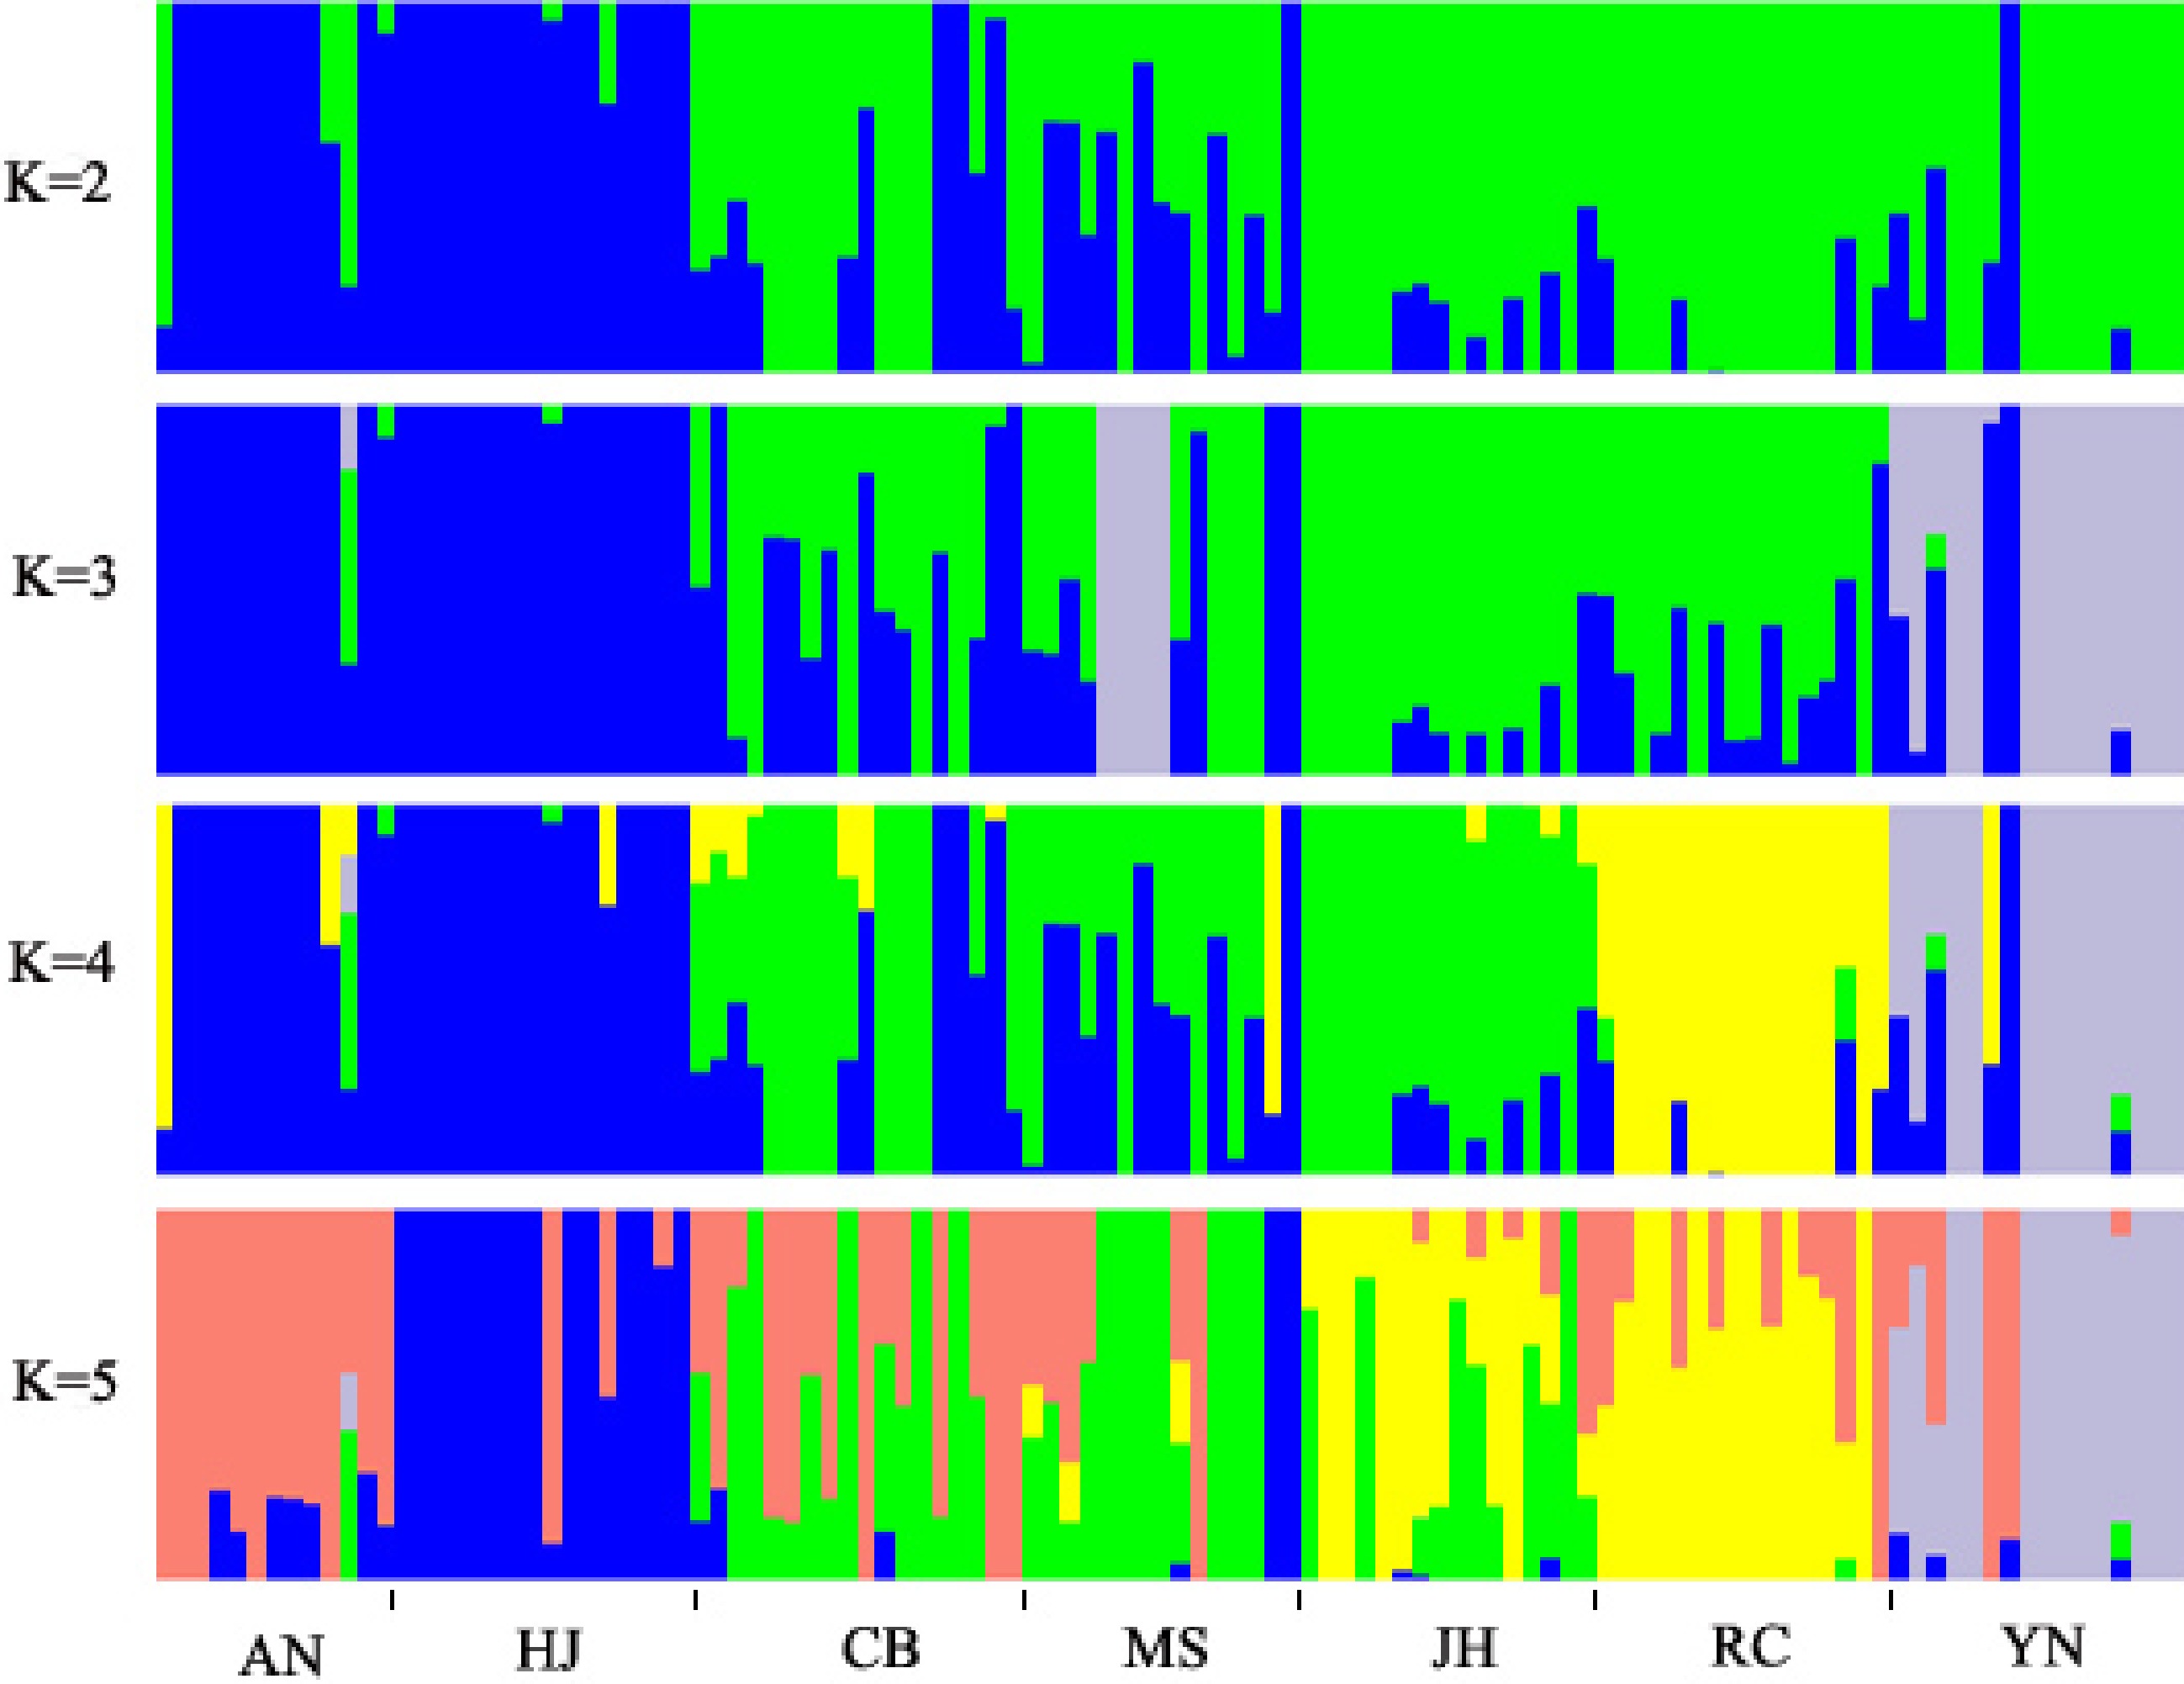
Figure 3.
Analysis of population structure by ADMIXTURE. The x-axis indicates different research materials and the y-axis shows membership probability belonging to different populations.
-
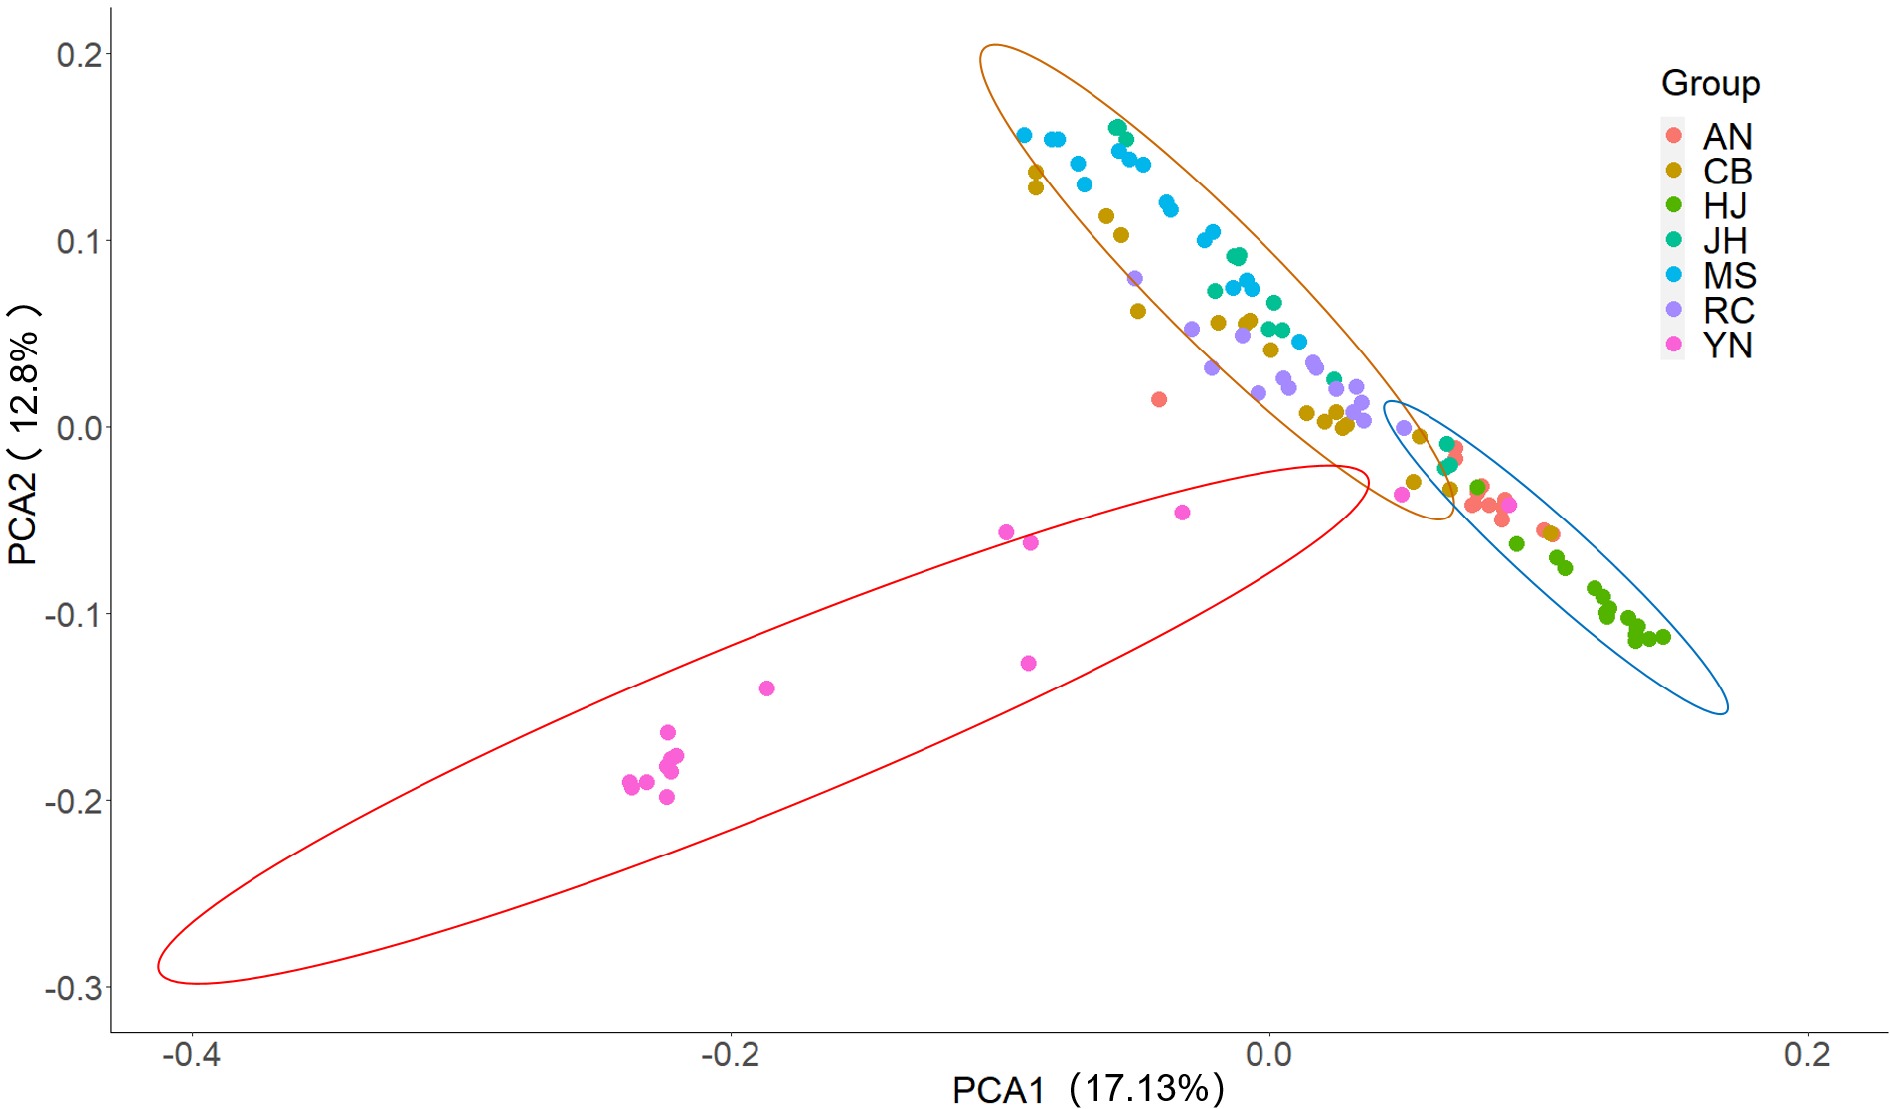
Figure 4.
PCA plot of the 110 samples based on the top three principal components with different colors representing the populations, which were divided into three groups by the range of circles with 95% confidence level.
-
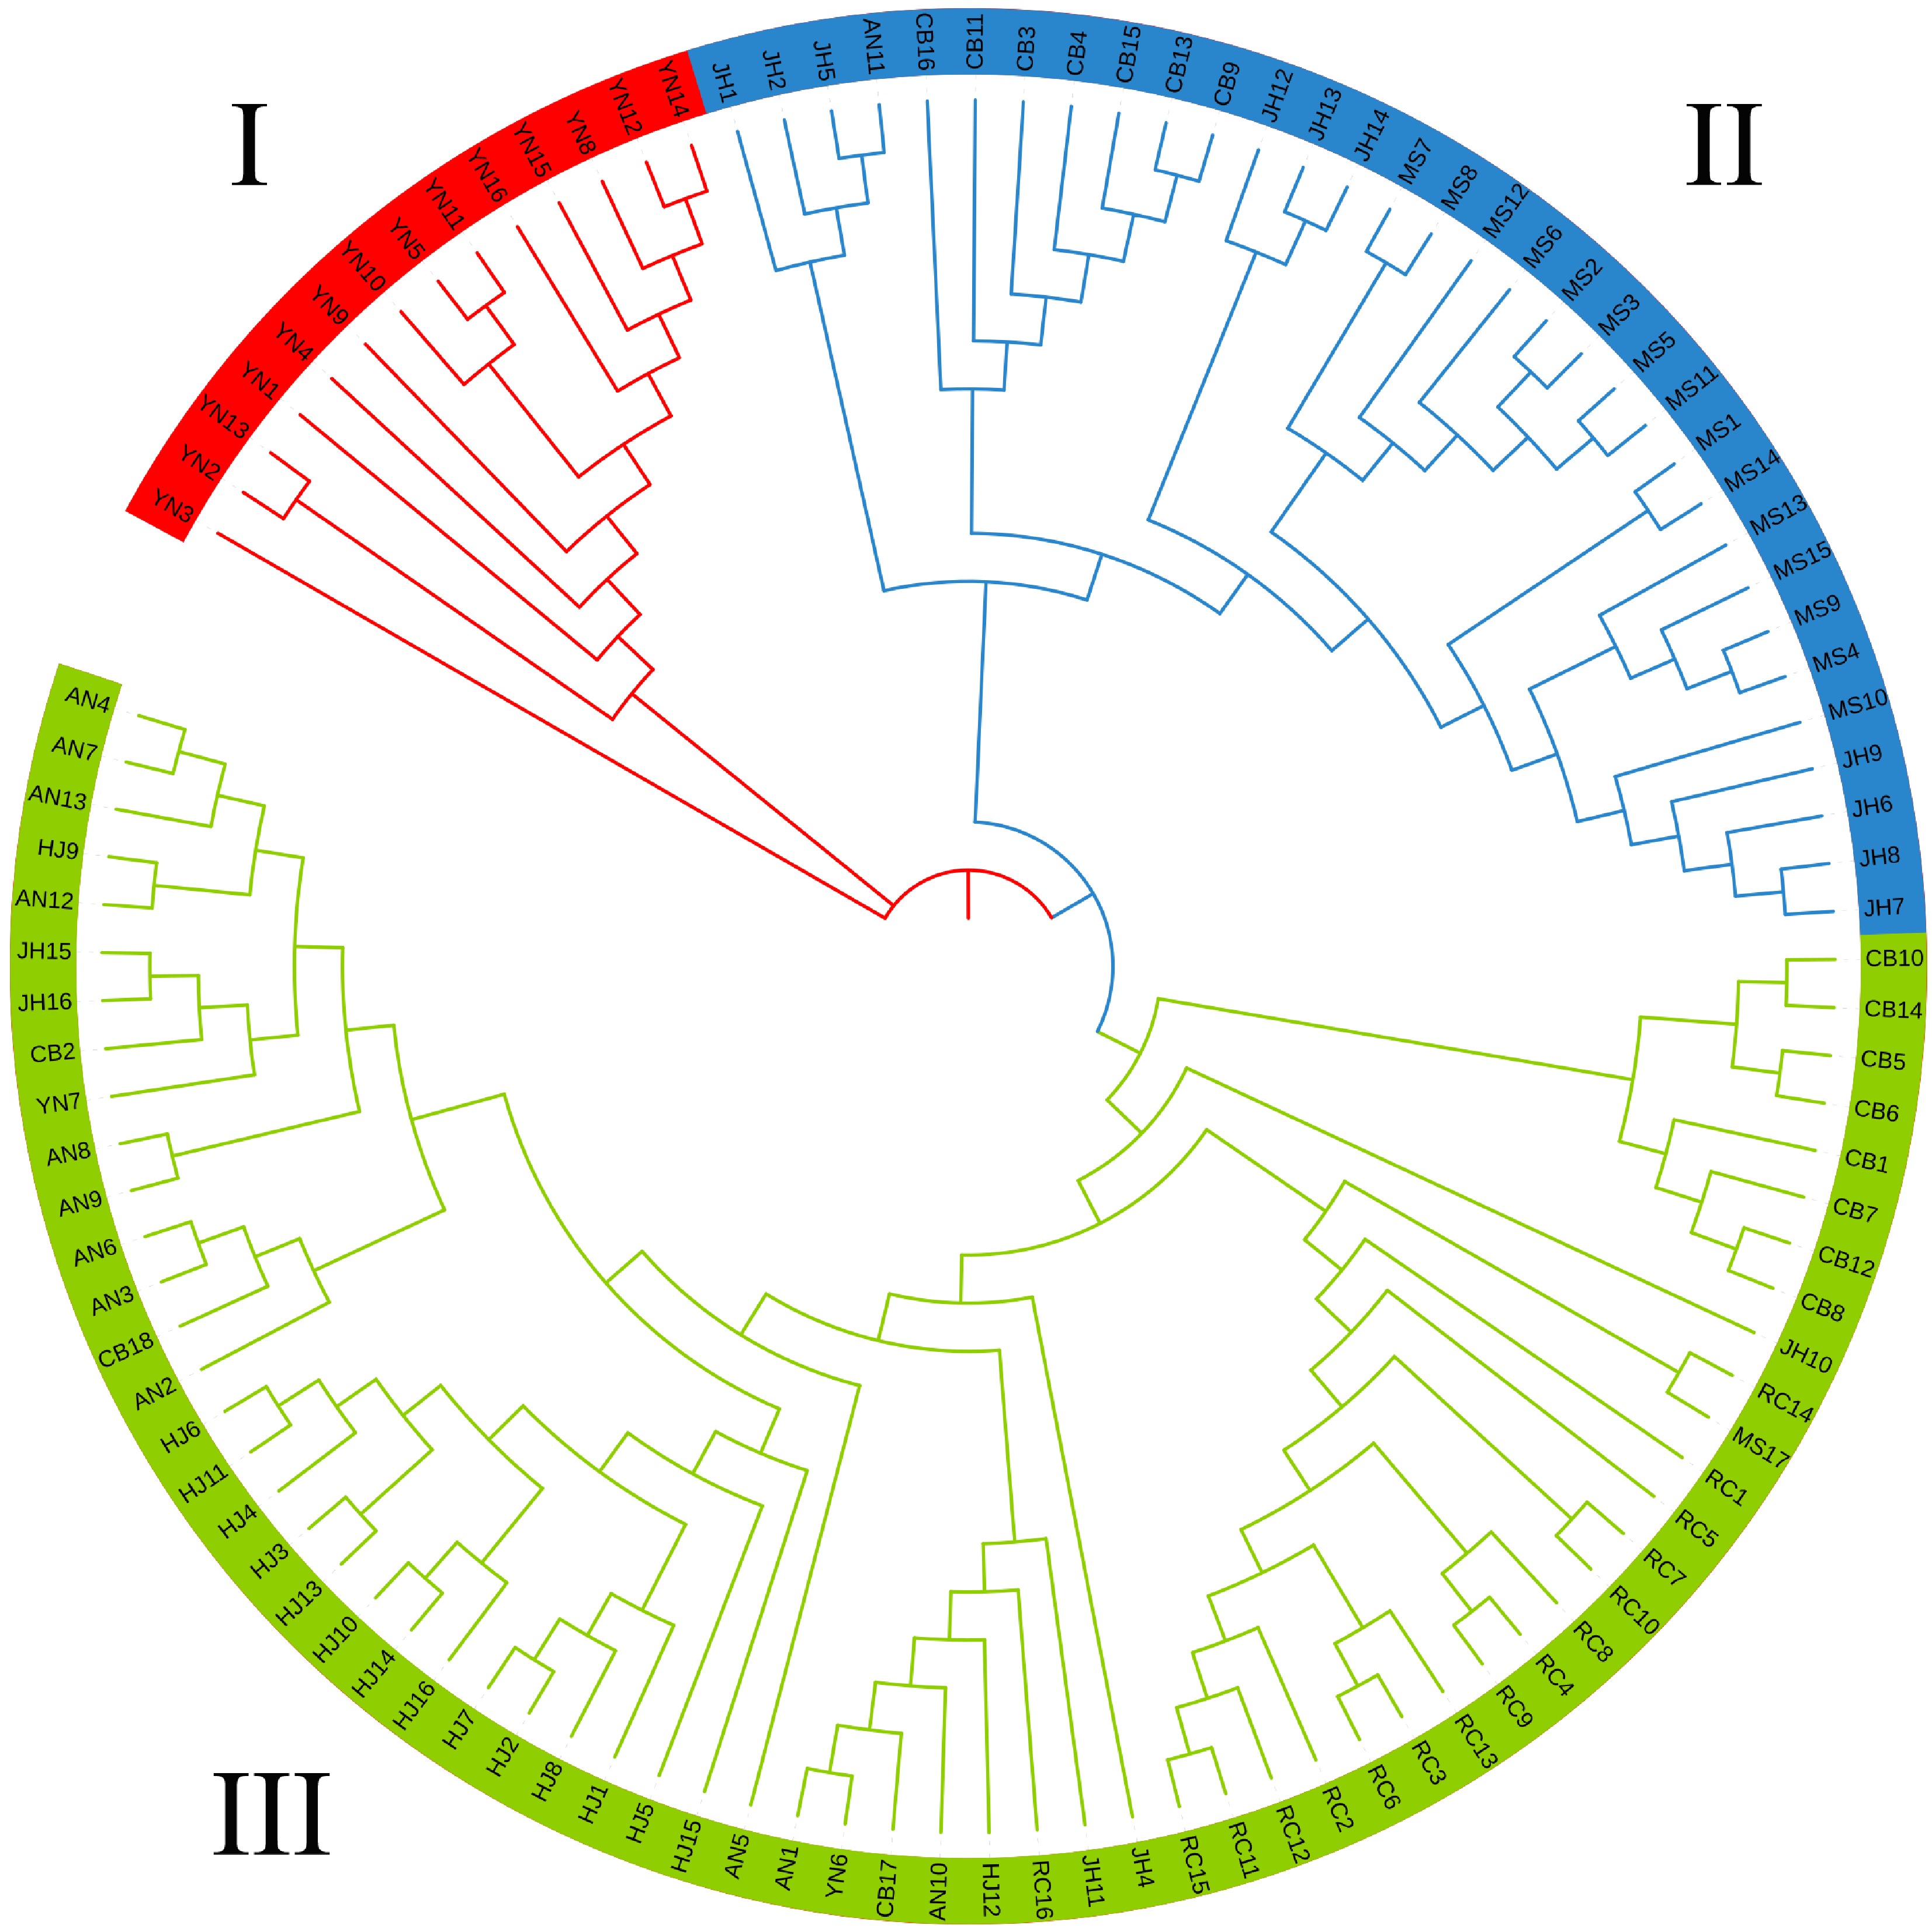
Figure 5.
Phylogenetic tree of the 110 samples with three different colors indicating three groups obtained from the ADMIXTURE analysis result.
-
Population H Ho PIC MAF Mean Range Mean Range Mean Range Mean Range Seven population accessions YN 0.16 0.08−0.50 0.16 0.11−0.25 0.14 0.11−0.38 0.11 0.08−0.50 RC 0.18 0.07−0.50 0.20 0.15−0.22 0.15 0.09−0.38 0.12 0.09−0.50 CB 0.20 0.10−0.50 0.21 0.18−0.24 0.17 0.12−0.38 0.12 0.08−0.50 MS 0.20 0.10−0.52 0.22 0.17−0.25 0.16 0.07−0.38 0.13 0.10−0.50 JH 0.20 0.11−0.53 0.22 0.18−0.25 0.17 0.09−0.38 0.13 0.10−0.50 AN 0.20 0.10−0.50 0.23 0.17−0.28 0.17 0.12−0.38 0.13 0.11−0.50 HJ 0.22 0.12−0.54 0.24 0.20−0.31 0.16 0.10−0.38 0.14 0.12−0.50 Three groups based on Mega and ADMIXTURE I 0.15 0.10−0.50 0.15 0.11−0.25 0.12 0.05−0.38 0.10 0.07−0.50 II 0.21 0.17−0.50 0.21 0.15−0.28 0.18 0.10−0.38 0.13 0.08−0.50 III 0.21 0.16−0.50 0.22 0.17−0.31 0.17 0.09−0.38 0.14 0.09−0.50 Table 1.
H, Ho, PIC and MAF values among seven tea plant populations and three inferred groups.
-
Population YN RC CB MS JH AN HJ YN 0.162 0.133 0.165 0.154 0.170 0.221 RC 0.035 0.076 0.102 0.083 0.088 0.145 CB 0.043 0.042 0.076 0.058 0.052 0.114 MS 0.051 0.043 0.031 0.070 0.128 0.185 JH 0.046 0.037 0.038 0.038 0.077 0.136 AN 0.046 0.038 0.035 0.044 0.038 0.078 HJ 0.046 0.052 0.044 0.059 0.053 0.035 Notes: Above diagonal Fst; below diagonal: Nei's genetic distance. Table 2.
Matrix of pairwise Nei's genetic distance and Fst among the seven populations.
-
Source of variation Degree of freedom Sum of square Mean of square Components of covariance Sigma % Seven populationsaccessions Between population 6 17,773.89 2,962.31 147.64 18.62 Within population 103 66,455.06 645.19 645.19 81.38 Total 219 84,228.95 772.74 792.84 100.00 Three groups based on Mega and ADMIXTURE Between groups 2 11,758.90 5,879.45 161.28 19.23 Within groups 107 72,470.05 677.29 677.29 80.77 Total 109 84,228.95 772.74 838.57 100.00 Table 3.
AMOVA of the whole population.
-
Population Core collection YN YN2, YN9 RC RC11, RC14, RC16 CB CB1, CB6, CB8, CB9, CB11 MS MS4, MS5, MS14, MS17 JH JH9, JH16 AN AN1, AN2, AN5, AN11, AN12 HJ HJ1 Table 4.
The core collection.
-
Germplasm H Ho PIC MAF Mean Range Mean Range Mean Range Mean Range Entire germplasm 0.22 0.06−0.50 0.21 0.13−0.31 0.19 0.05−0.38 0.14 0.03−0.50 Core germplasm set 0.21 0.00−0.50 0.20 0.11−0.28 0.18 0.00−0.38 0.13 0.00−0.50 Table 5.
Genetic parameters of the core collection and the whole germplasm.
-
Source of variation Degree of freedom Sum of square Mean of square Components of covariance P-value Sigma % Between germplasm 1 660.86 660.86 −3.21 −0.42 0.85 Within germplasm 108 83,568.10 773.78 773.78 100.41 Total 110 84,228.95 772.74 770.57 100.00 Table 6.
The AMOVA results among the core germplasm and non-core germplasm.
Figures
(5)
Tables
(6)