-
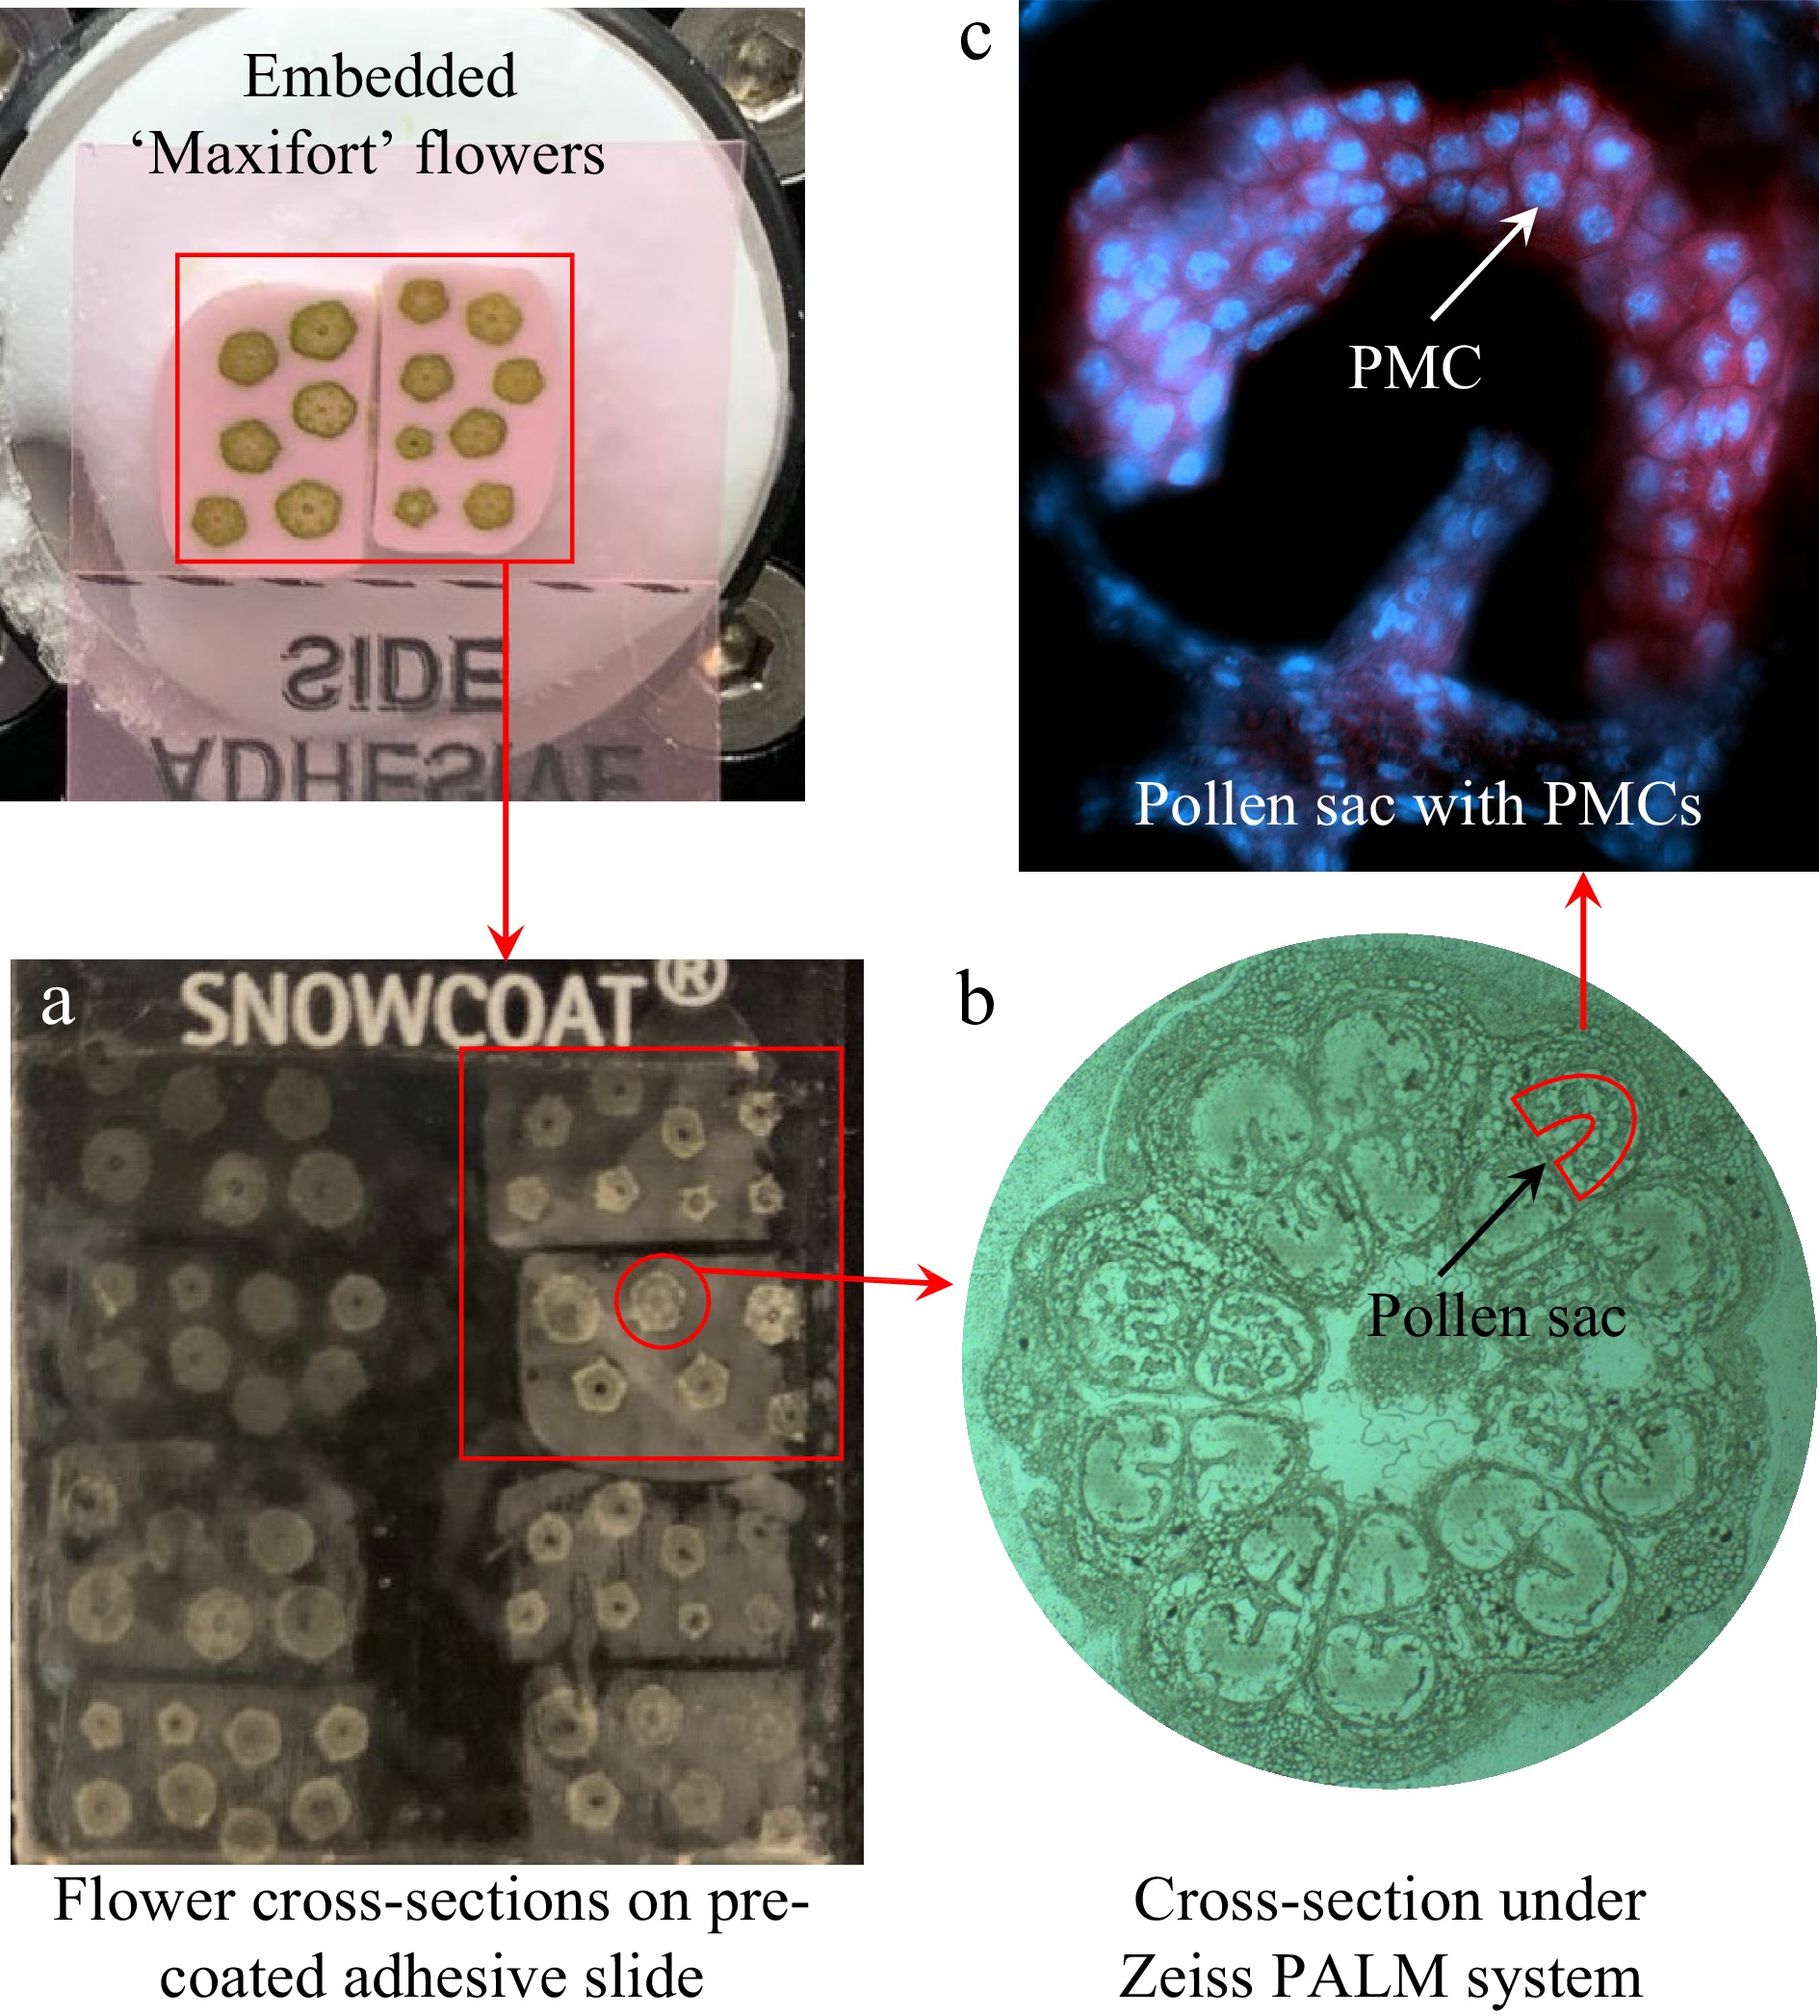
Figure 1.
Collection of pollen mother cells using laser-capture microdissection from cross-sections of frozen flower buds of tomato 'Maxifort'. (a) Transference of sectioned tissues onto a pre-coated adhesive slide; (b) flower bud cross-sections visualized under Zeiss PALM system; (c) images of DAPI stained PMCs showing the blue florescent nuclei.
-
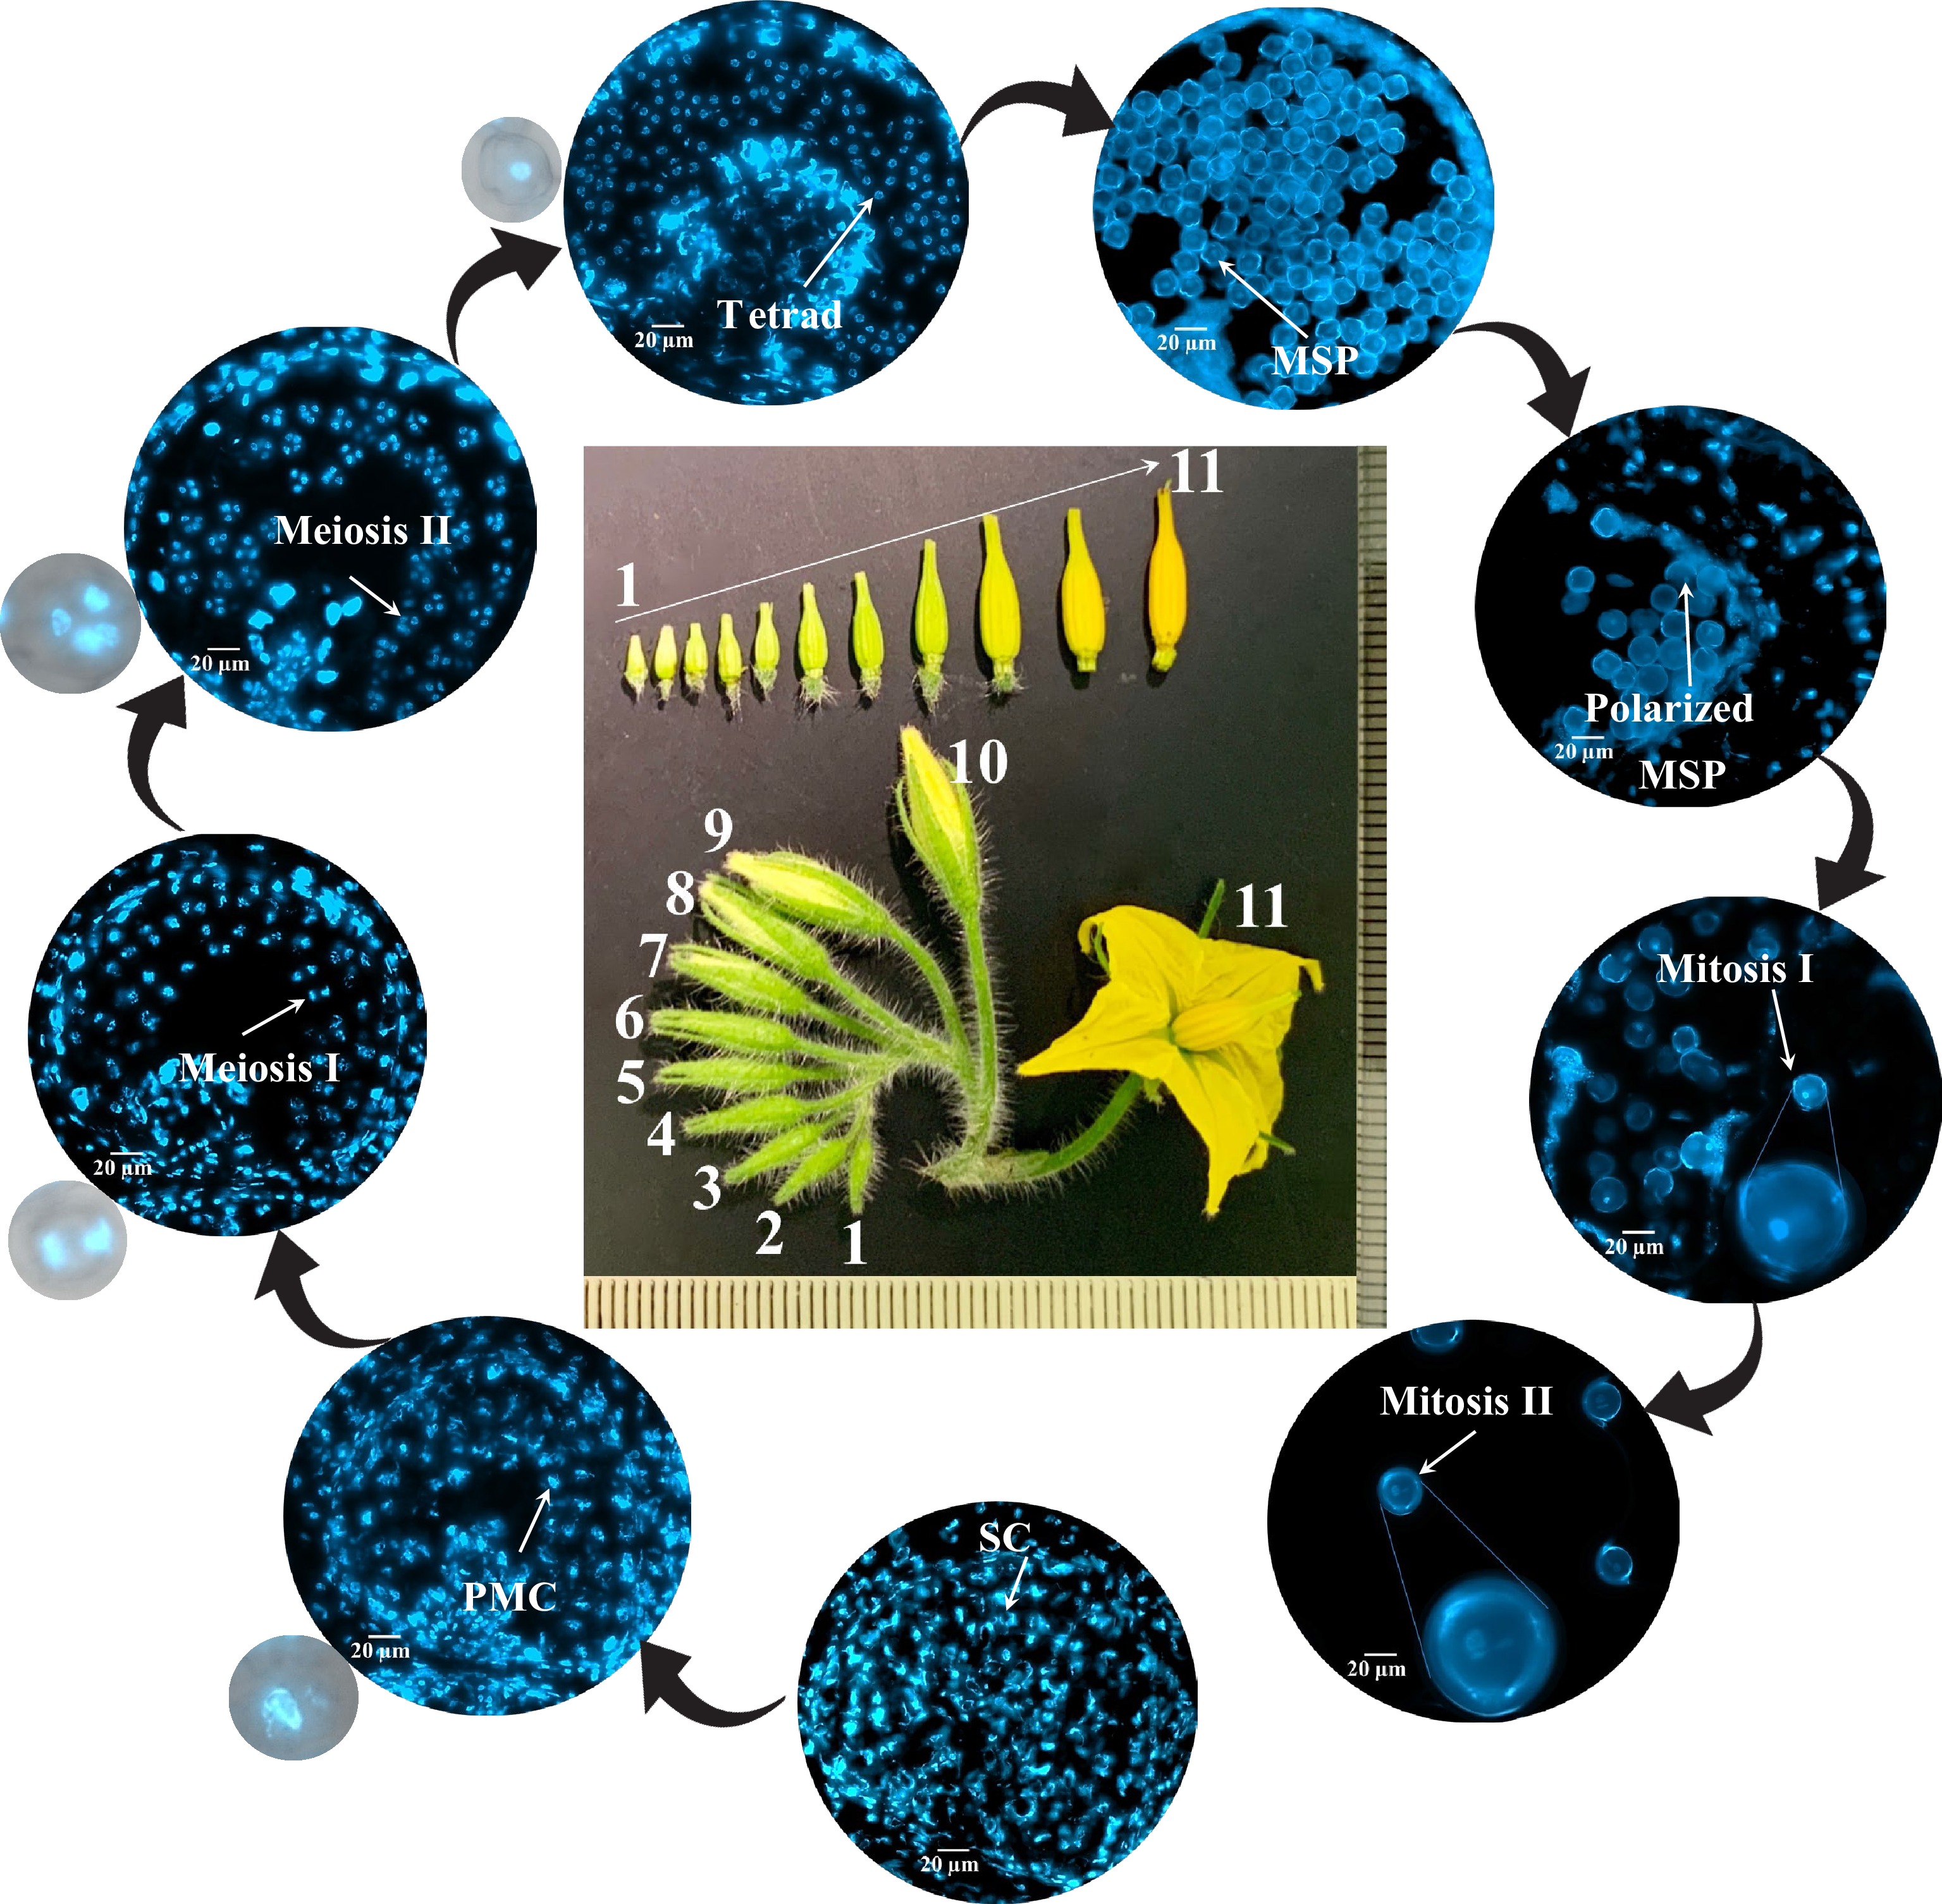
Figure 2.
Correlation between flower size and male gametophyte development stages in tomato 'Maxifort'. Frozen cross section of tomato 'Maxifort' flower buds were stained with 4',6-diamidino-2-phenylindole (DAPI). Images were taken under an upright Zeiss imager M2 with EC PlnN 40X objective and a BP335-383 excitation DAPI filter. The inflorescence of 'Maxifort' flower were labeled 1−11. Nine distinct developmental stages were identified including: 1) sporogenous cells (SC); 2) pollen mother cells (PMCs); 3) meiosis I to dyads; 4) meiosis II to tetrads; 5) tetrads to early microspore; 6) microspore (MSP); 7) polarized MSPs; 8) mitosis I; 9) mitosis II. Zoom-in image of PMCs, meiosis I, meiosis II and tetrads with merged bright field and DAPI channel are displayed to show pollen cell structure.
-
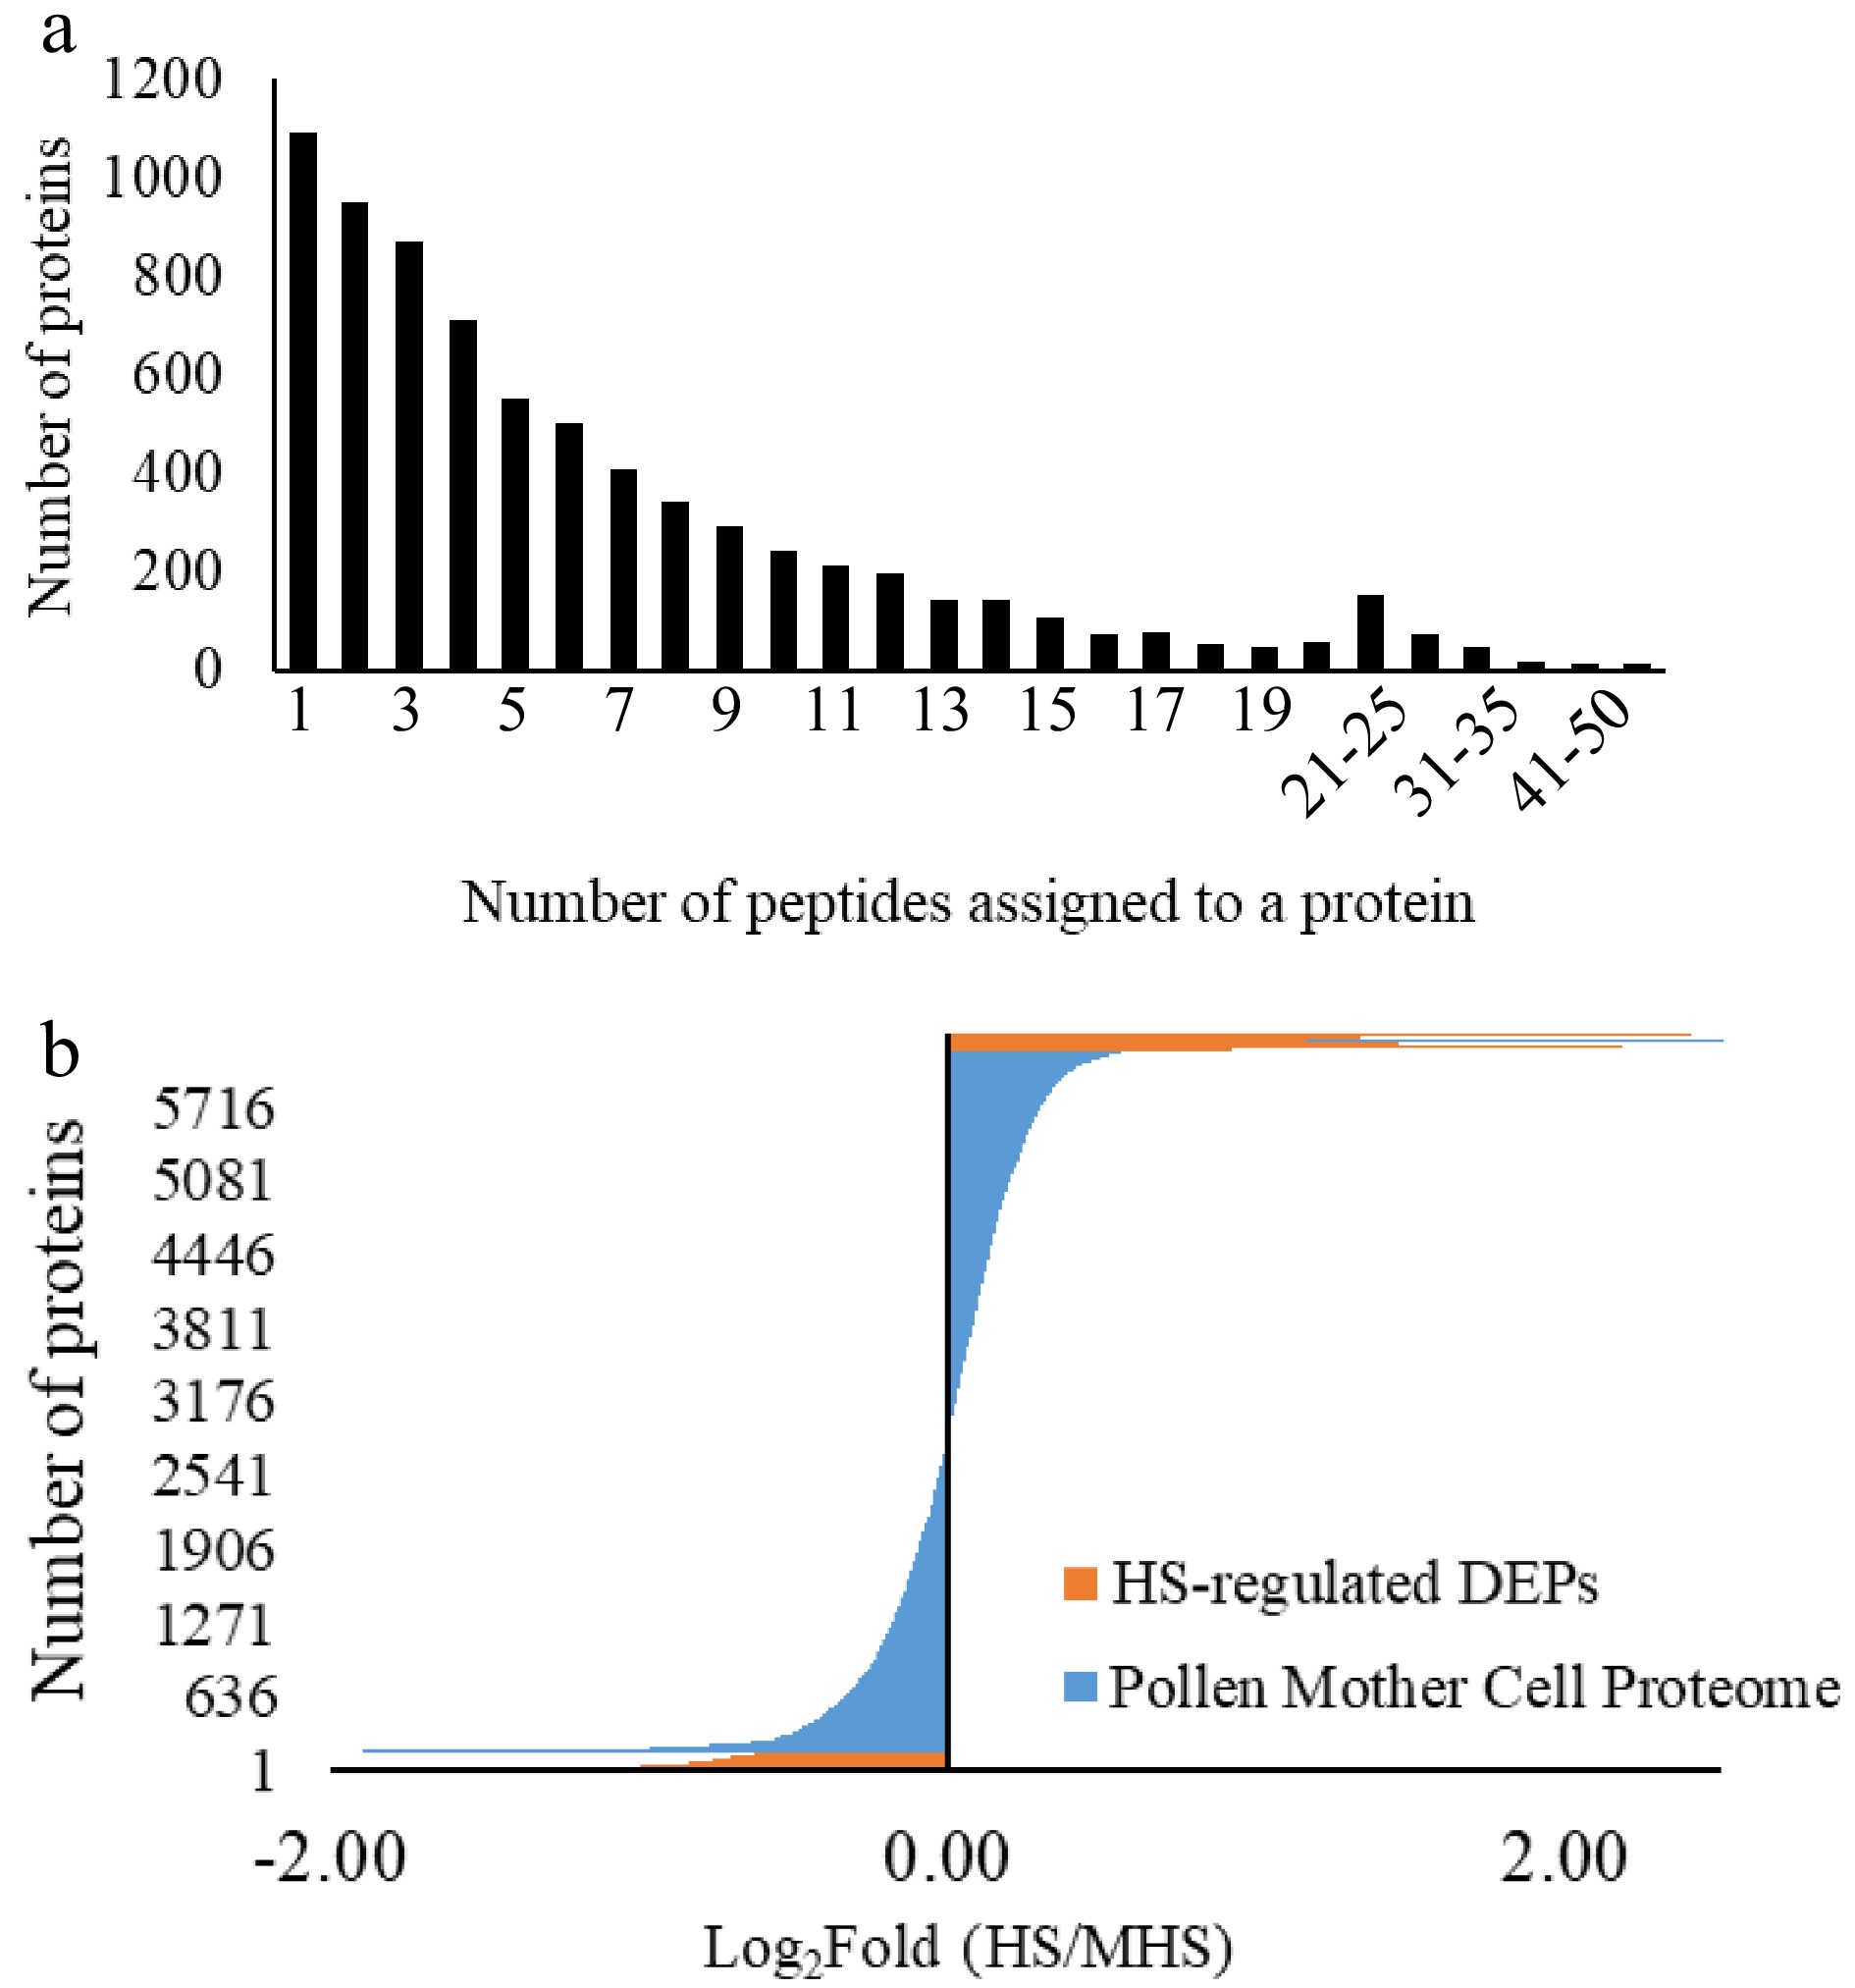
Figure 3.
Protein distribution in the quantified proteomes from pollen mother cells of tomato 'Maxifort'. (a) Protein distribution based on the number of unique peptides assigned to each protein; (b) protein distribution based on the fold change from HS to N-HS conditions. HS-regulated proteins: the number and fold distribution of proteins showing significant differences in abundance level from HS-treated to non-HS-treated conditions; Pollen mother cell proteome: the quantified proteome with two or more peptides assigned to the identified protein from the HS-treated and non-HS-treated groups.
-
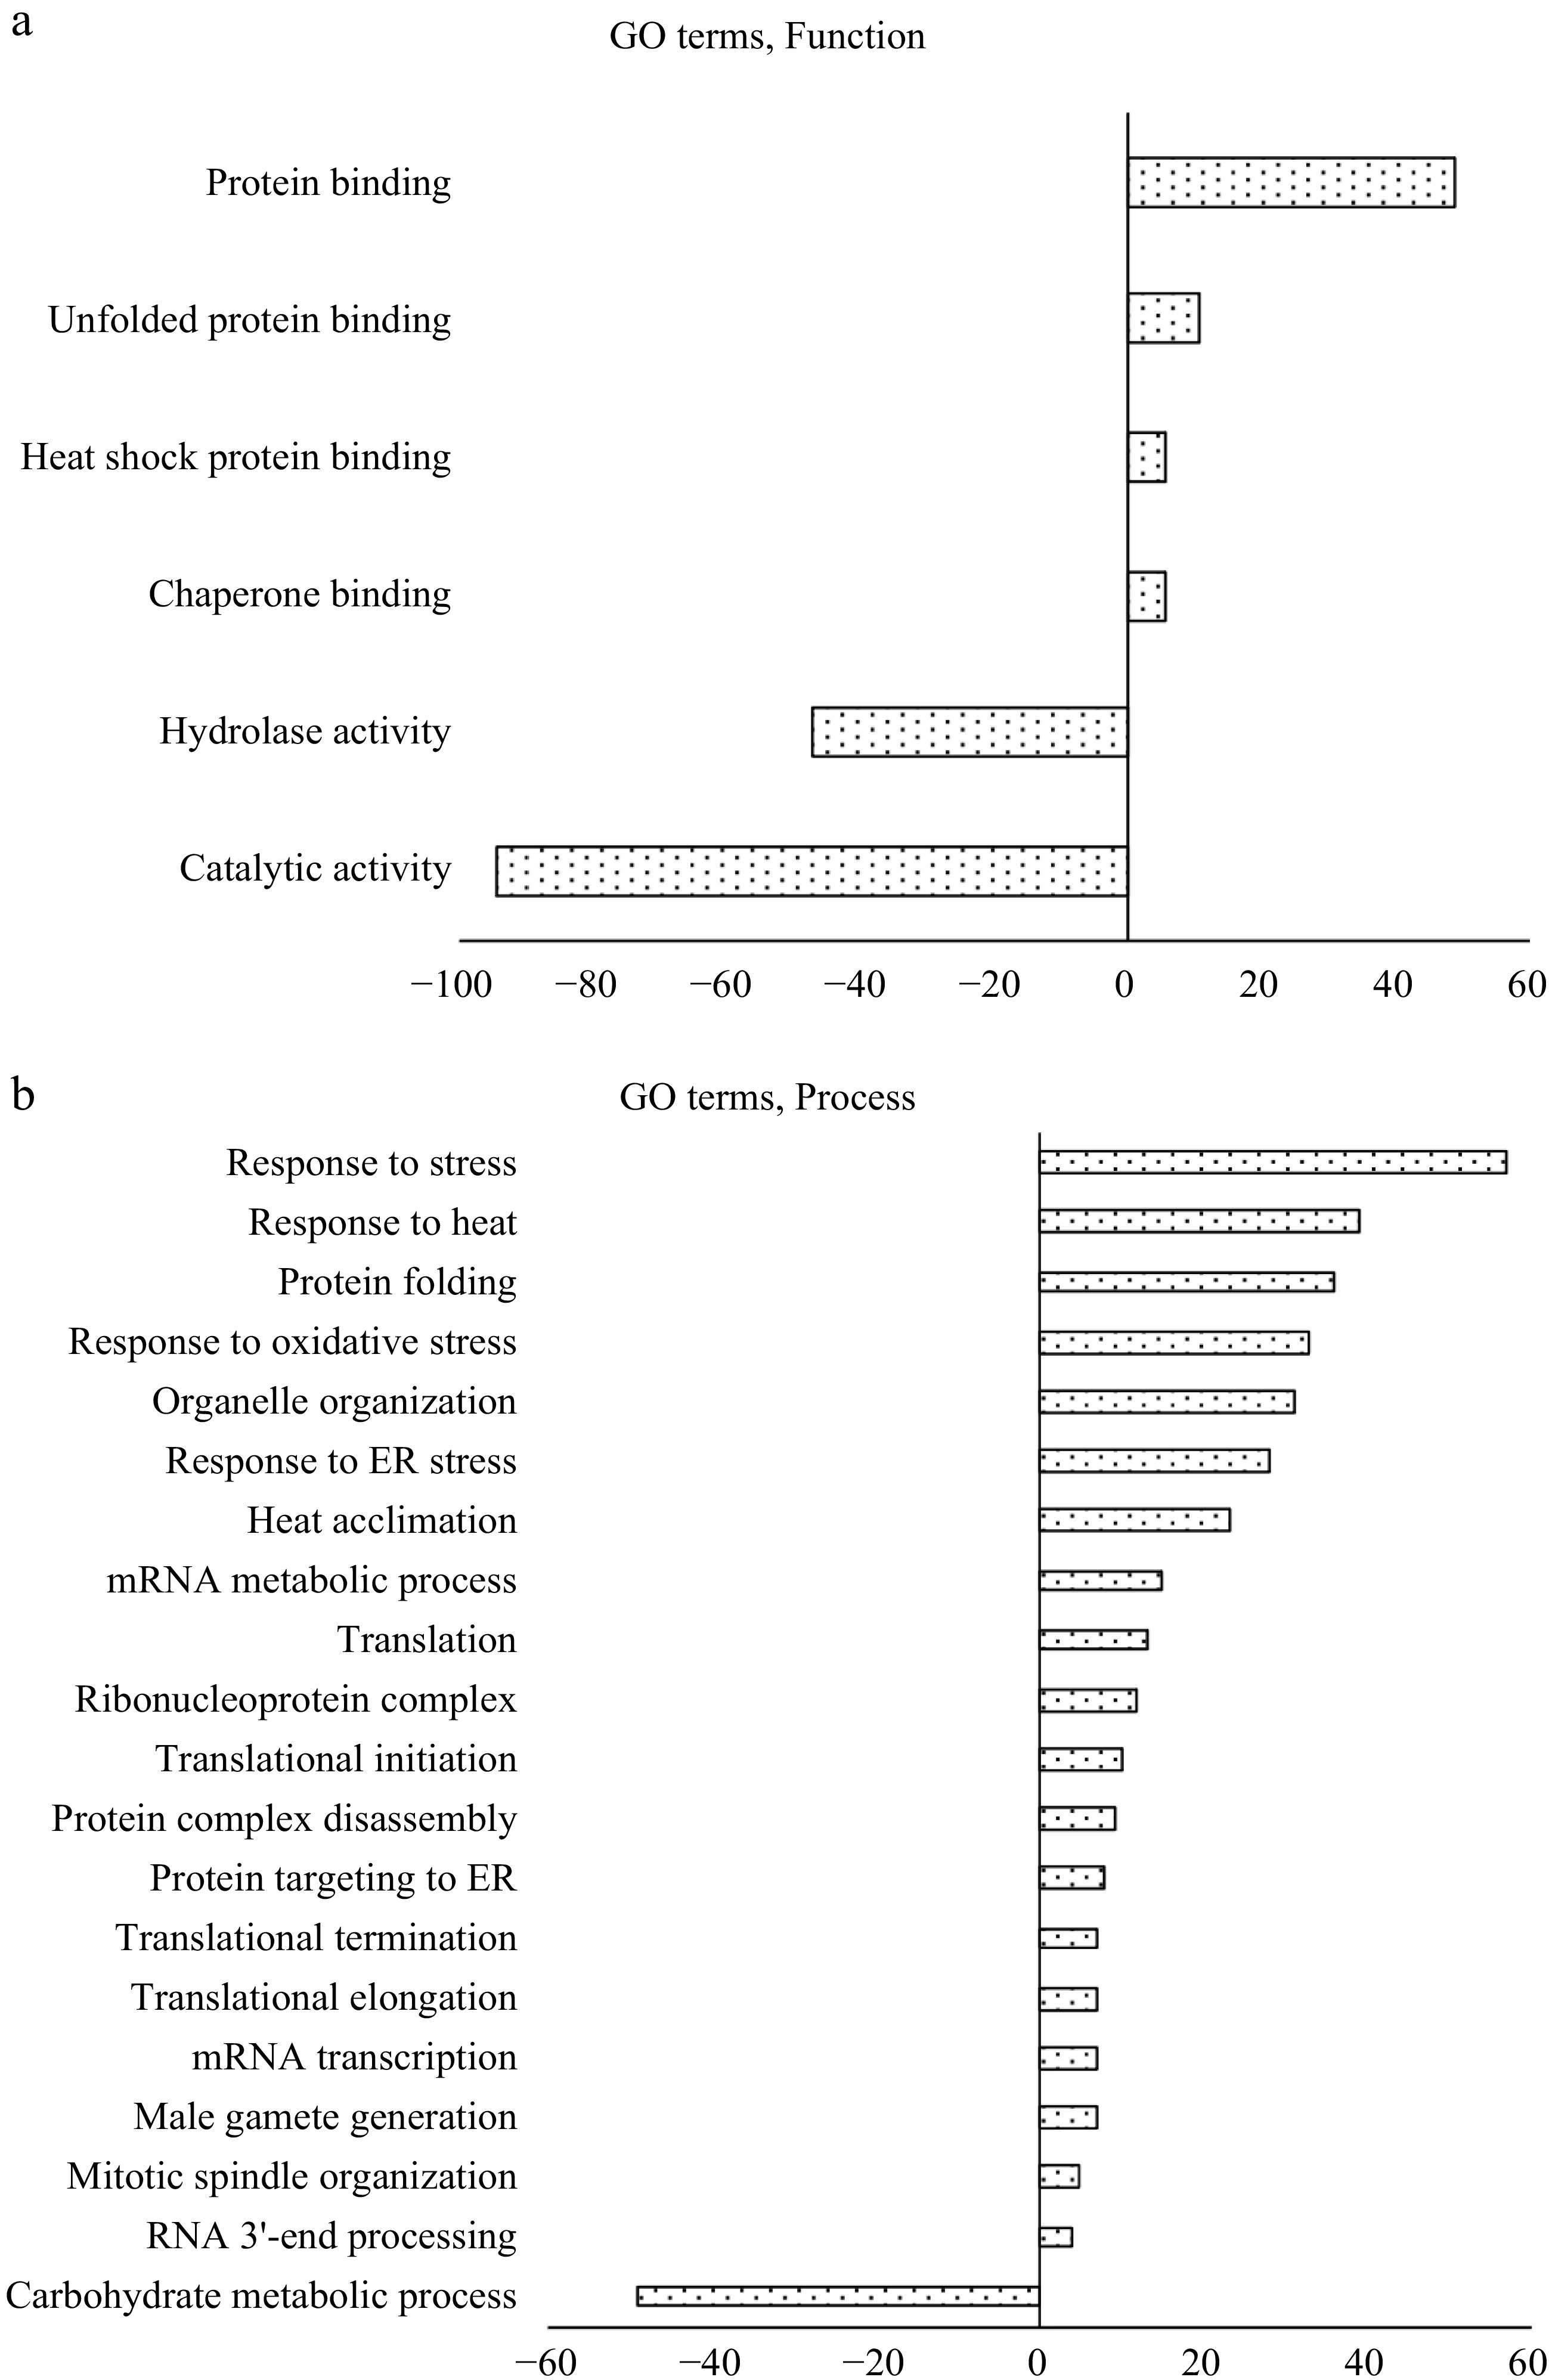
Figure 4.
Enrichment gene ontology (GO) analysis of heat stress regulated DEPs (HS-DEPs) in pollen mother cells (PMCs), which include 158 DEPs-down-regulated protein and 96 DEPs-up-regulated proteins. (a) GO terms of molecular functions; (b) GO terms of biological processes. Positive value indicates HS-up-regulated DEPs and negative value indicates HS-down-regulated DEPs. The classification analysis was conducted using multivariant test at FDR adjusted P ≤ 0.05 in Plant MetGenMap (
http://bioinfo.bti.cornell.edu/cgi-bin/MetGenMAP/home.cgi ). -

Figure 5.
Pie chart of functional groups enriched with DEPs using Plant MetGenMap. Some proteins were placed in more than one functional group. GO terms are: Nuclease activity (GO:0004518); Protein binding (GO:0005515); Translation factor activity (GO:0008135); Enzyme regulator activity (GO:0030234); Transcription regulator activity (GO:0030528); Hydrolase activity (GO:0016787); Receptor binding (GO:0005102); Transferase activity (GO:0016740); Transcription factor activity (GO:0003700); Signal transducer activity (GO:0004871); Kinase activity (GO:0016301).
-
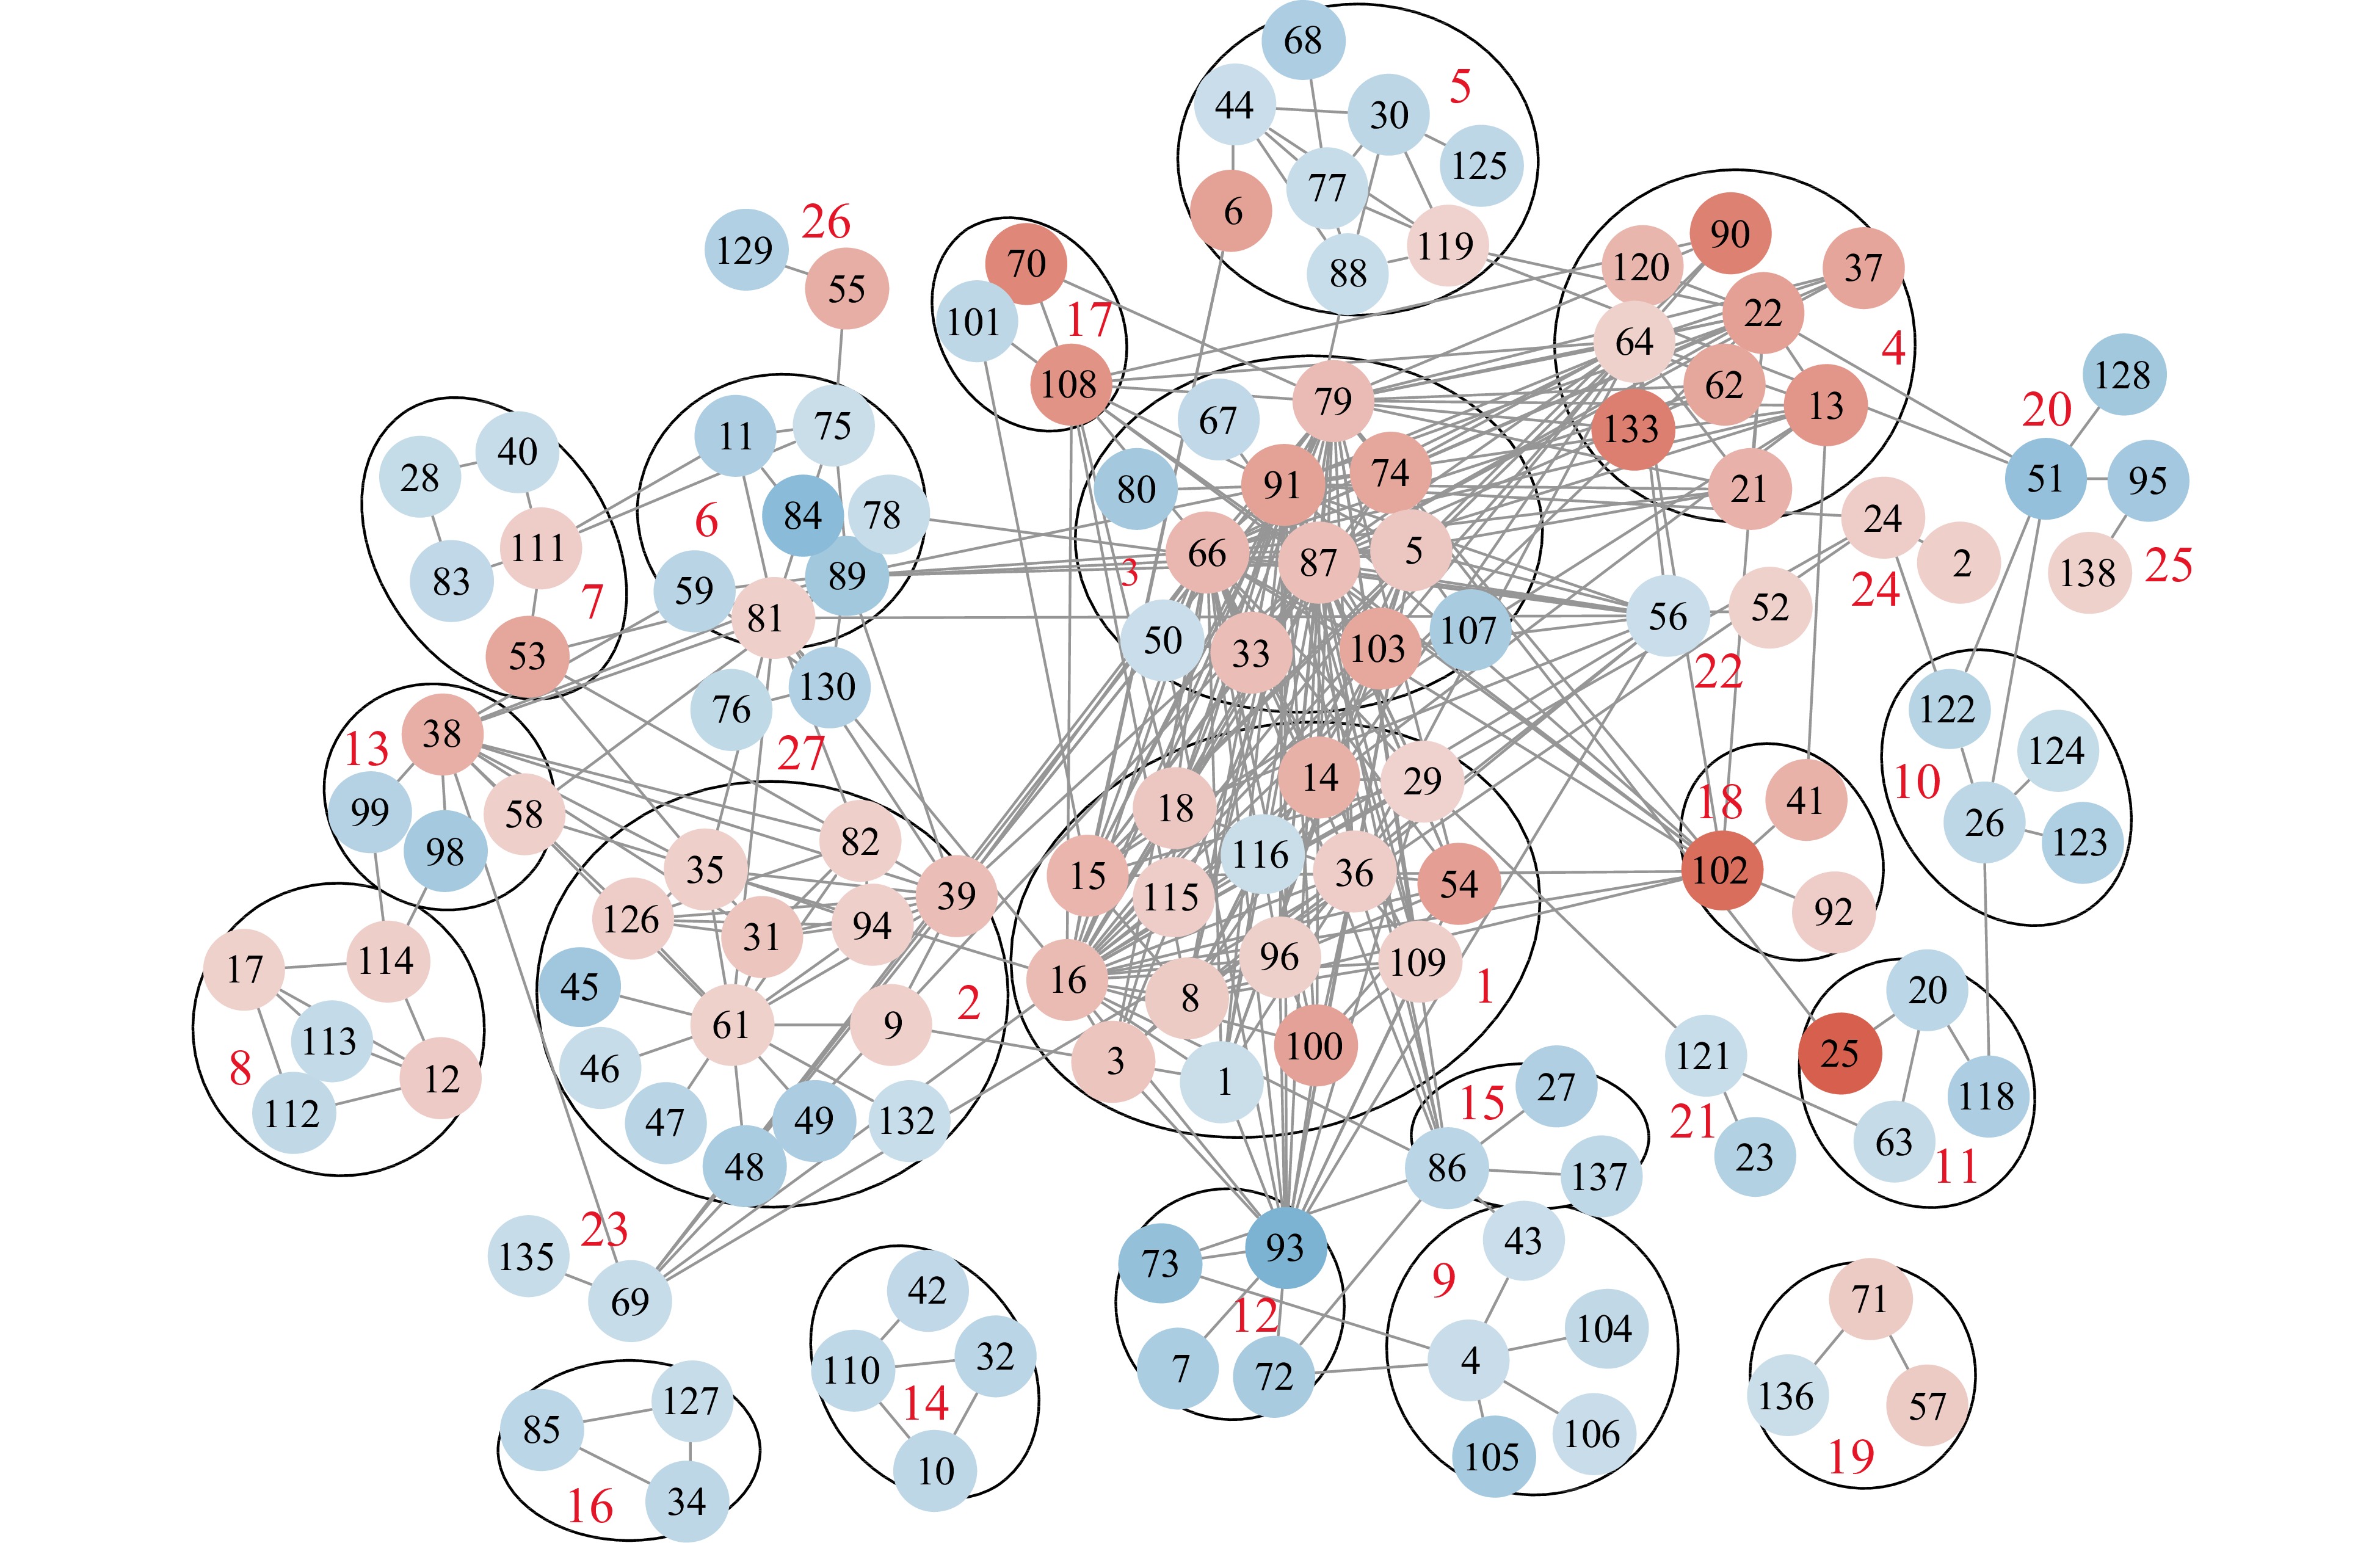
Figure 6.
Protein interaction networks of proteins showing significant change from heat stress (HS) to non-heat stress (N-HS) conditions in pollen mother cells from tomato 'Maxifort'. The network was constructed based on functional and physical interactions at medium confidence (0.400) level in STRING (
https://string-db.org ). String clusters, protein accession, and fold change are listed in Table 2. The image was generated using Cystoscope associated with the STRING database. The red color nodes are HS-up-regulated proteins, and the blue color nodes are HS-down-regulated proteins. The color depth corresponds to the protein Fold (HS/N-HS) values. -
Flower size (stamen length mm) Pollen developmental stage Note Flower size 1−6 (3−6 mm) Sporogenous cells (SCs), Pollen mother cells (PMCs), Meiosis I to dyads, Meiosis II to tetrads, Tetrads to early microspores Microsporogenesis: PMCs undergo meiosis I and II to produce haploid tetrad. Flower size 7−8 (7−9 mm) Microspores (MSPs), Polarized MSPs Unicellular microspores release, and polarization. Flower size 9−11 (9−12 mm) Mitosis I, Mitosis II Microgametogenesis: Microspores undergo mitosis I and II to produce pollen grain. Table 1.
The correlation between flower size and pollen developmental stages
-
Cluster numbery Protein #x Protein accessionv Protein descriptionu Fold changew Cluster 1: Protein folding/ unfolding/ targeting 1 Solyc06g051650.2.1 Peptidyl-prolyl cis-trans isomerase –0.60 3 Solyc05g056230.2.1 Calreticulin 0.8 8 Solyc01g104740.2.1 Ethylene-responsive transcriptional coactivator 0.7 14 Solyc06g076520.1.1 HSP20 1.11 15 Solyc03g082420.2.1 Small heat shock protein 1.05 16 Solyc11g020040.1.1 HSP 70 0.96 18 Solyc02g088610.2.1 ClpA/Clp HSP 0.78 29 Solyc01g086740.2.1 Chaperone DnaJ 0.6 36 Solyc01g099660.2.1 HSP 70 0.67 54 Solyc02g077670.2.1 Chaperone protein dnaJ 2 1.41 96 Solyc11g006170.1.1 DnaJ 0.62 100 Solyc11g071830.1.1 Chaperone protein dnaj 1.36 109 Solyc07g053620.2.1 Chaperone protein dnaJ 0.63 115 Solyc03g005700.1.1 Mitochondrial import receptor subunit TOM22 0.67 116 Solyc10g083970.1.1 S-adenosylmethionine synthase –0.60 Cluster 2: Protein translation 9 Solyc06g048410.2.1 Superoxide dismutase 0.64 31 Solyc01g094560.2.1 Eukaryotic ribosomal protein eL36 family 0.79 35 Solyc01g097760.2.1 Ribosomal protein L7a 0.63 39 Solyc01g103510.2.1 Ribosomal protein L3 family 0.91 45 Solyc02g038650.1.1 Tetratricopeptide repeat protein 5 –1.15 46 Solyc02g038660.1.1 Tetratricopeptide-like helical –0.64 47 Solyc02g038670.1.1 Tetratricopeptide-like helical –0.83 48 Solyc02g038680.1.1 Tetratricopeptide-like helical –1.04 49 Solyc02g038700.1.1 Tetratricopeptide repeat protein 5 –1.00 61 Solyc03g112360.1.1 Ribosomal protein 0.61 82 Solyc06g064460.2.1 Ribosomal protein L7a 0.64 94 Solyc10g061970.1.1 60S ribosomal protein L37a 0.63 126 Solyc10g085480.1.1 60S ribosomal protein L24 0.66 132 Solyc05g008420.2.1 Tetratricopeptide repeat protein 5 –0.62 Cluster 3: Defense against cell wall stress factors 5 Solyc04g072160.2.1 Prostaglandin E synthase 3 0.78 33 Solyc01g095320.2.1 BCL-2-associated athanogene 6 0.91 50 Solyc02g065170.2.1 Laccase-22 –0.61 66 Solyc03g117630.1.1 HSP70 1.02 67 Solyc03g118430.2.1 Peptidase family M16 –0.74 74 Solyc04g014480.2.1 HSP20-like chaperones 1.29 79 Solyc05g056560.2.1 C11orf73 homolog 0.95 80 Solyc06g053380.2.1 Chitinase –1.11 87 Solyc07g005820.2.1 Heat shock protein 0.89 91 Solyc09g075950.1.1 Heat shock protein 70 family. 1.35 103 Solyc09g092690.2.1 Peptidyl-prolyl cis-trans isomerase 1.27 107 Solyc10g007220.1.1 Hsp40, DnaJ –1.05 Cluster 4: Cytosolic heat stress response/ programmed cell death 13 Solyc08g062340.2.1 Cytosolic class II small heat shock protein HCT2 1.56 21 Solyc08g062450.1.1 Class II small heat shock protein Le-HSP17.6 1.09 22 Solyc08g078700.2.1 HSP20 1.38 37 Solyc01g102960.2.1 HSP20 1.3 62 Solyc03g113930.1.1 HSP20 1.29 90 Solyc09g015000.2.1 HSP20 1.86 64 Solyc03g115230.2.1 ClpA/ClpB HSP 0.61 120 Solyc10g084170.1.1 Bcl-2-associated athanogene 1.04 133 Solyc09g015020.1.1 Small heat shock protein (HSP20) 1.91 Cluster 5: Rerouting the carbohydrate flux 6 Solyc04g082200.2.1 Bcl-2-associated athanogene 1.37 30 Solyc01g091200.2.1 NAD dependent epimerase/ dehydratase –0.79 44 Solyc01g112210.2.1 Hexosyltransferase –0.61 68 Solyc03g120310.2.1 Glycosyl transferase –0.99 77 Solyc05g054060.2.1 UTP-glucose 1 phosphate uridylyltransferase –0.65 125 Solyc06g074670.2.1 NAD-dependent epimerase/ dehydratase –0.76 88 Solyc07g055300.2.1 Alpha alpha-trehalose-phosphate synthase –0.62 119 Solyc07g007790.2.1 Sucrose phosphate synthase 0.6 Cluster 6: Transcription/ translation 11 Solyc10g051390.1.1 RNA-binding glycine-rich protein-1b –0.99 59 Solyc03g059010.2.1 Glucose-repressible alcohol dehydrogenase transcriptional effector CCR4 –0.83 75 Solyc04g074750.2.1 RNA-binding (RRM/RBD/RNP motifs) –0.60 78 Solyc05g054240.2.1 Protein arginine N-methyltransferase –0.64 81 Solyc06g062800.2.1 DEAD box helicase family 0.63 84 Solyc06g071560.2.1 Phosphatase 2A regulatory subunit B –1.45 89 Solyc09g008620.1.1 Polyadenylate-binding protein –1.14 Cluster 7: Cytosolic protein degradation and secretion 28 Solyc01g079450.2.1 Prolyl oligopeptidase family protein –0.68 40 Solyc01g105990.2.1 Os01g0107900 protein –0.64 53 Solyc02g069160.2.1 Synaptobrevin family 1.28 83 Solyc06g071430.2.1 T17H3.1 protein –0.74 111 Solyc11g066830.1.1 Splicing factor U2af subunit 0.66 Cluster 8: Chromatin status/ gene transcriptional activity 12 Solyc06g074790.1.1 Histone H2B.1 0.71 17 Solyc01g099410.2.1 Histone H2A.1 0.61 112 Solyc03g116770.2.1 DNA-binding protein –1.44 113 Solyc06g062690.2.1 Nucleosome assembly protein – 0.69 114 Solyc11g066160.1.1 Histone H4 0.65 Cluster 9: Ubiquitin-mediated degradation of intracellular proteins 4 Solyc09g074680.2.1 Cullin family –0.63 43 Solyc01g111680.2.1 Ubiquitin-conjugating enzyme –0.61 104 Solyc05g052960.2.1 BTB/POZ domain containing protein –0.72 105 Solyc06g073820.1.1 Ubiquitin carboxyl-terminal hydrolase –1.10 106 Solyc11g072070.1.1 BTB/POZ domain containing protein –0.63 Cluster 10: Synthesis of secondary metabolites 26 Solyc01g010900.2.1 Cytochrome P450 –0.78 123 Solyc03g053130.2.1 Calcium-dependent phosphotriesterase –0.96 122 Solyc07g065770.2.1 ABC transporter-like –0.85 124 Solyc11g071800.1.1 Strictosidine synthase –0.68 Cluster 11: Stress-response 20 Solyc09g065180.2.1 mRNA binding protein –0.80 25 Solyc06g076570.1.1 HSP20 2.4 63 Solyc03g114930.2.1 PsbP-like protein 1 –0.67 118 Solyc08g080190.2.1 Glucose-methanol-choline (GMC) oxidoreductase –0.99 Cluster 12: Protecting cells against oxidative damage 7 Solyc03g111720.2.1 Peptide methionine sulfoxide reductase –1.02 72 Solyc04g010010.1.1 Thioredoxin-like protein 1 –1.05 73 Solyc04g010030.1.1 Thioredoxin-like protein 1 –1.32 93 Solyc10g007230.1.1 Tetratricopeptide repeat protein 2-like –1.64 Cluster 13: Programmed cell death/ protein targeting 38 Solyc01g103080.2.1 RNA helicase, ATP-dependent 1.15 58 Solyc03g025740.2.1 VASCULAR-RELATED NAC-DOMAIN 6 0.64 98 Solyc11g011790.1.1 Importin beta-3 –1.09 99 Solyc11g011800.1.1 Importin beta –0.90 Cluster 14: Lipidome 10 Solyc08g076470.2.1 Glycerol-3-phosphate acyltransferase –0.76 32 Solyc01g094700.2.1 Glycerol-3-phosphate acyltransferase –0.81 42 Solyc01g109580.2.1 Adenylyl cyclase-associated protein –0.74 110 Solyc07g005580.2.1 Phospholipid/glycerol acyltransferase –0.75 Cluster 15: TFs and signaling pathways 27 Solyc01g057270.2.1 Calmodulin-binding transcription factor SR4 –0.95 86 Solyc06g083150.2.1 U-box domain-containing protein –0.82 137 Solyc07g055130.2.1 Kinase family protein –0.75 Cluster 16: Cell Wall degradation/ PMC separation 34 Solyc01g097000.2.1 Glycosyl hydrolase family protein –0.77 85 Solyc06g073750.2.1 Beta-D-glucosidase –0.80 127 Solyc11g071640.1.1 Beta-D-glucosidase –0.65 Cluster 17: Elasticity of cell surface structures 70 Solyc03g123540.2.1 HSP20-like chaperones 1.78 101 Solyc09g092160.2.1 Beta-galactosidase –0.76 108 Solyc05g014280.2.1 Small heat shock protein 1.59 Cluster 18: Attenuating the apoptotic effects and mitochondrial damages 102 Solyc11g020330.1.1 Small heat shock protein 2.18 41 Solyc01g106820.2.1 Peptidase M50 family 1.1 92 Solyc09g091470.2.1 3-ketoacyl CoA thiolase 2 0.68 Cluster 19: Meiotic process 57 Solyc03g007800.2.1 Topoisomerase 1-associated factor 1/Timeless family protein 0.7 71 Solyc04g008600.2.1 Chromosome segregation in meiosis protein 3 0.7 136 Solyc11g020780.1.1 DCK/dGK-like deoxyribonucleoside kinase –0.60 Cluster 20: Cell surface activities on premeiotic PMCs affecting fate of the cells 51 Solyc02g068400.2.1 Pectin lyase-like superfamily protein –1.31 128 Solyc08g077860.2.1 Meiotic serine proteinase –1.14 Cluster 21: N/A 23 Solyc07g054210.2.1 Protochlorophyllide reductase like protein –0.92 121 Solyc10g008740.2.1 Mg-protoporphyrin IX chelatase-like –0.62 Cluster 22: Folding and targeting of nascent proteins 52 Solyc02g069120.2.1 Zinc-finger protein ZPR1 0.61 56 Solyc02g090480.2.1 Peptidyl-prolyl cis-trans isomerase D –0.61 Cluster 23: Pre-meiotic chromosome 69 Solyc03g120900.1.1 Belongs to the WD repeat SEC13 family –0.64 135 Solyc10g007680.2.1 Regulator of chromosome condensation –0.64 Cluster 24: Maintenance of acquired thermos-tolerance 2 Solyc08g077980.2.1 Bax inhibitor; Belongs to the BI1 family 0.64 24 Solyc02g079930.2.1 Phosphosulfolactate synthase-related protein 0.66 Cluster 25: Cell wall 95 Solyc11g005490.1.1 Fasciclin-like arabinogalactan family protein –1.12 138 Solyc12g013900.1.1 CT099 0.61 z Proteins clustered on the STRING networks in Fig. 6. These proteins were identified as differentially expressed proteins (DEPs) in the heat stress (HS)-treated pollen mother cells which were significantly up-regulated or down-regulated compared to to the non-HS-treated control condition. The relative difference in abundance of each protein, measured by the intensity of its constituent peptides, was compared between the two treatment conditions. The protein has passed the t test with false discovery rate (FDR) corrections (P ≤ 0.05) and with a fold change greater than 0.60-fold (±). Statistical analyses were performed using SAS (Version 9.3; SAS Institute, Cary, NC)
y Cluster number in Fig. 6, which were constructed in STRING protein−protein interaction networks using Markov cluster (MCL) algorithm
x Protein # in Fig. 6
w Protein accession number in the ITAG Protein database (version 2.40; Sol Genomics Network, Boyce Thompson Institute, Ithaca, NY).
v Protein description in the ITAG Protein database (version 2.40; Sol Genomics Network, Boyce Thompson Institute, Ithaca, NY)
u The fold (HS/N-HS) for each protein is the log2 ratio of the protein abundance level between heat stress (HS) and non-HS-treated (N-HS) conditionsTable 2.
Proteins clustered on STRING association networksz
Figures
(6)
Tables
(2)