-
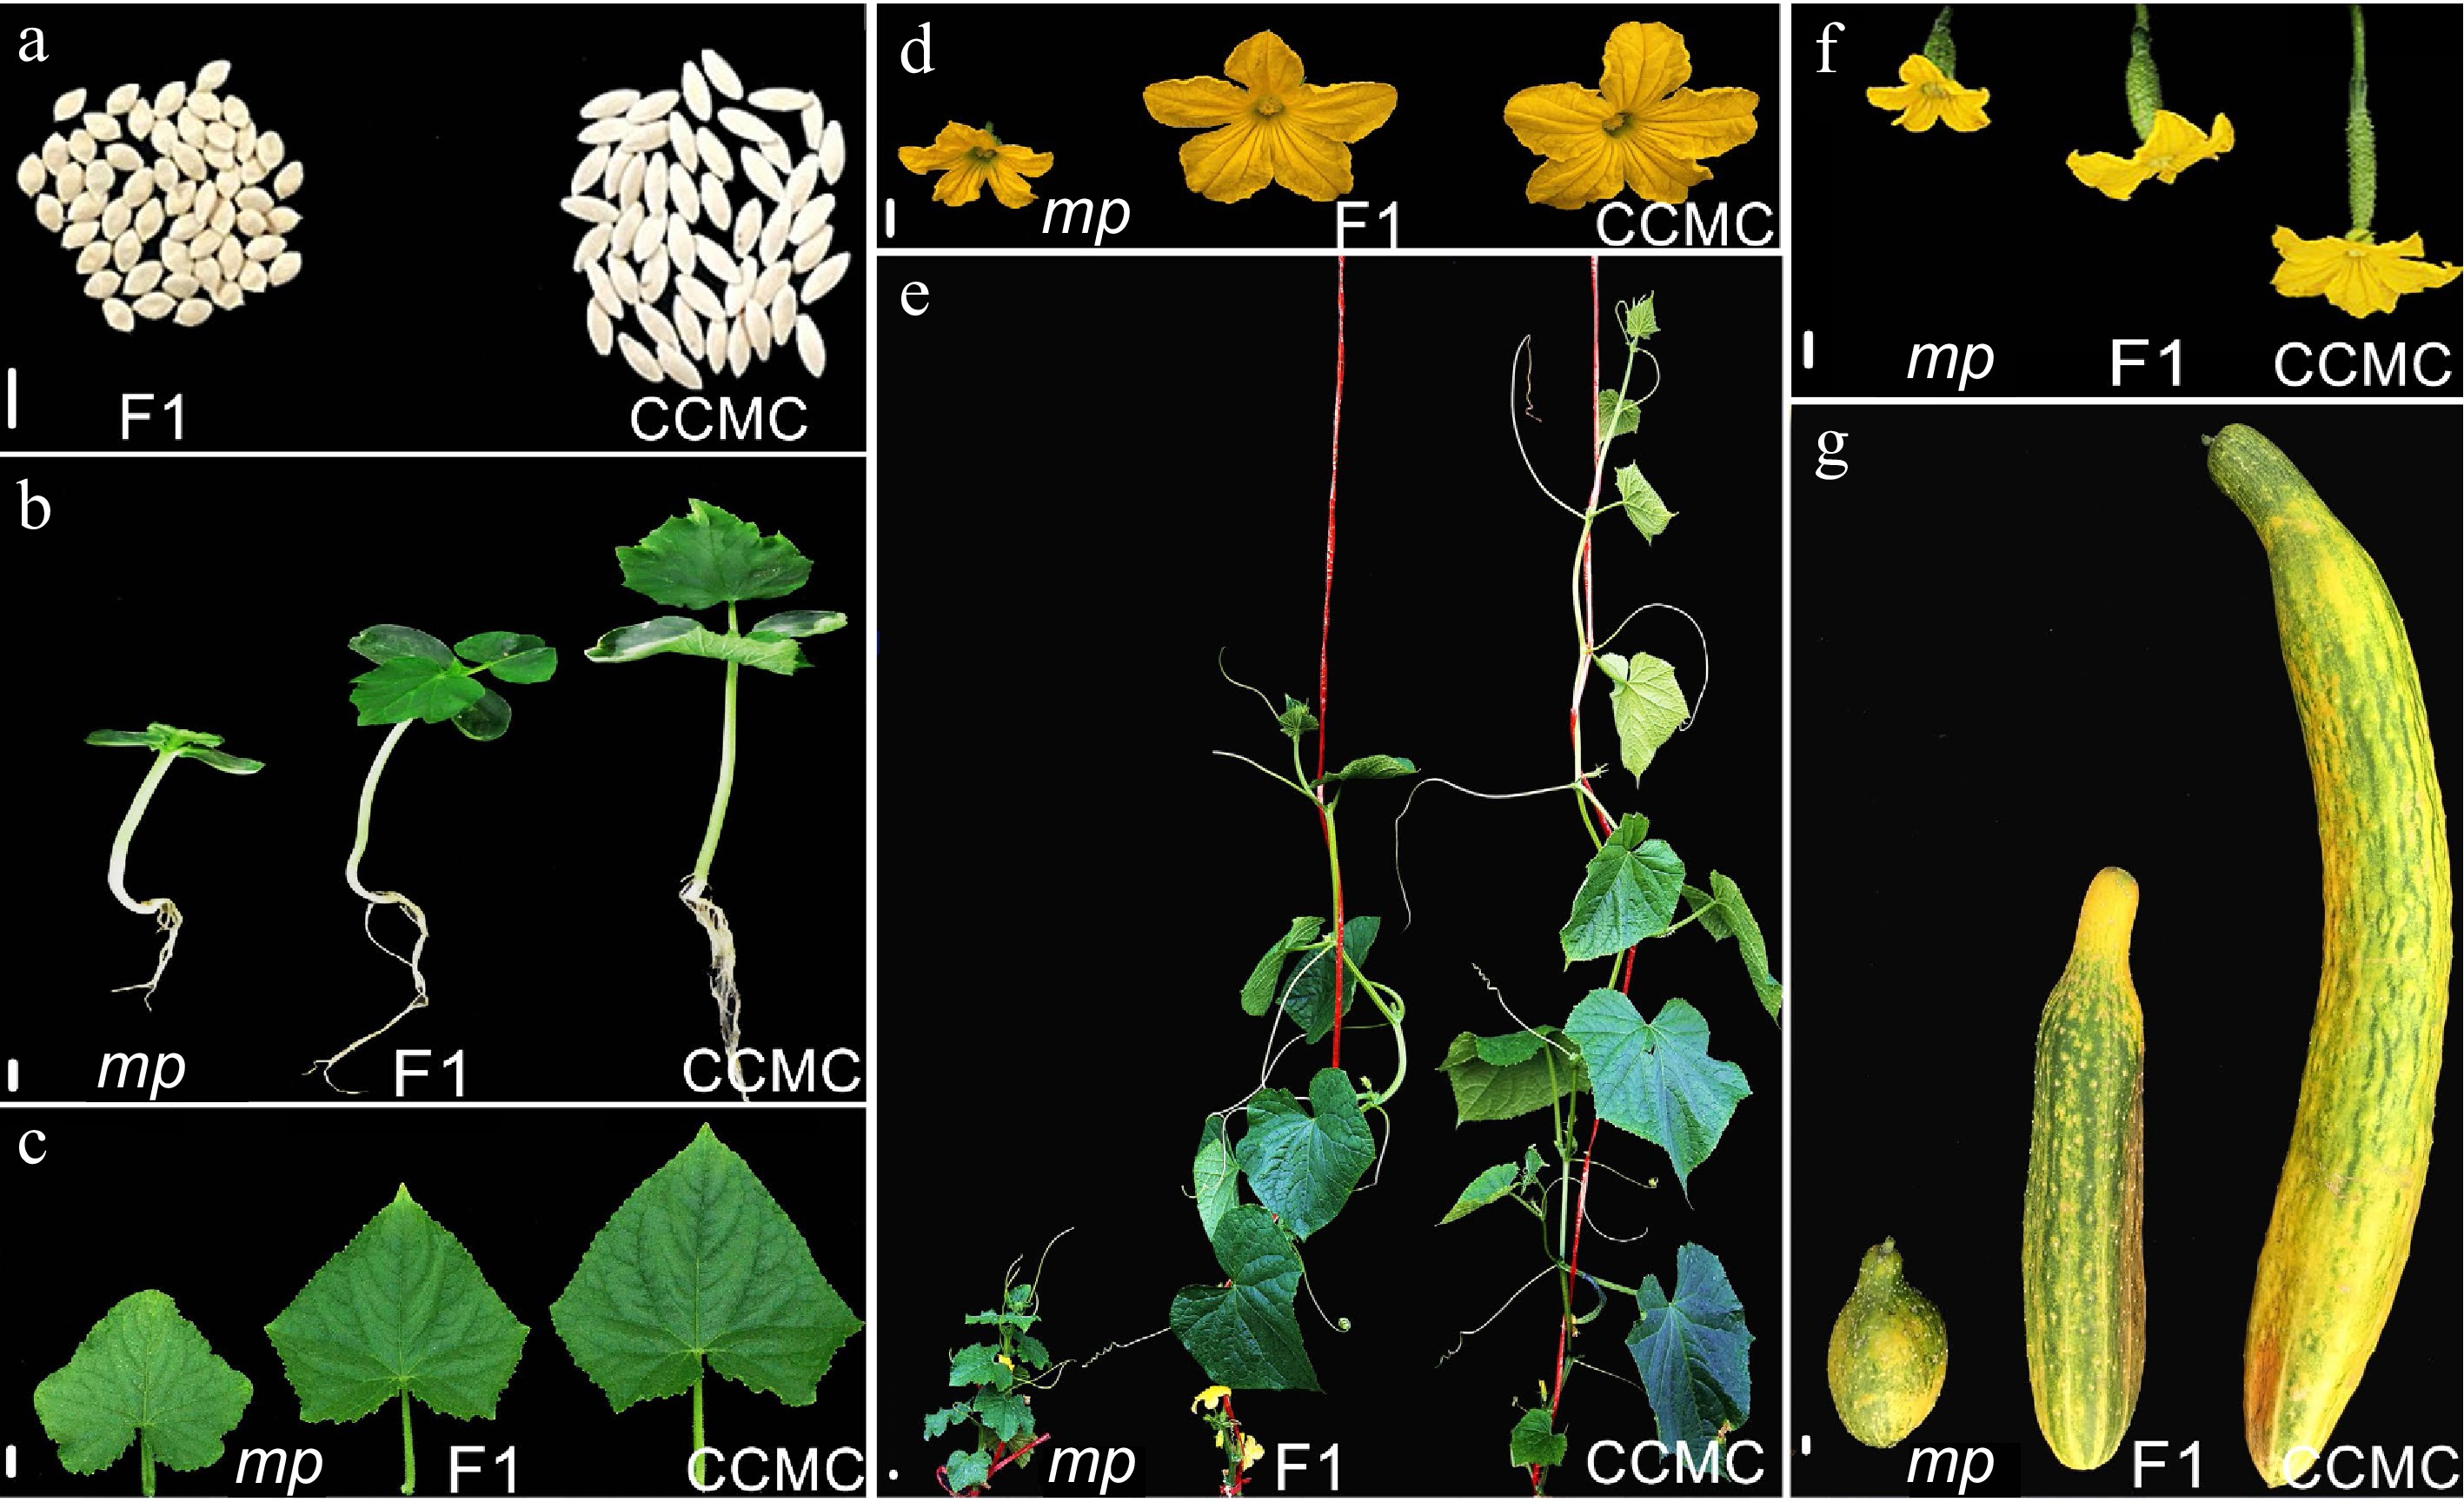
Figure 1.
Morphological characterization of CCMC and mp mutant. Representative photographs of mp mutant cucumber plants showing miniaturized development in (a) seed, (b) hypocotyl and root, (c) the 1st true leaf, (d) male flower, (e) the whole plant expanded 10 true-leaf stage, (f) female flower and ovary, and (g) mature fruit. Scale bar = 10 mm.
-
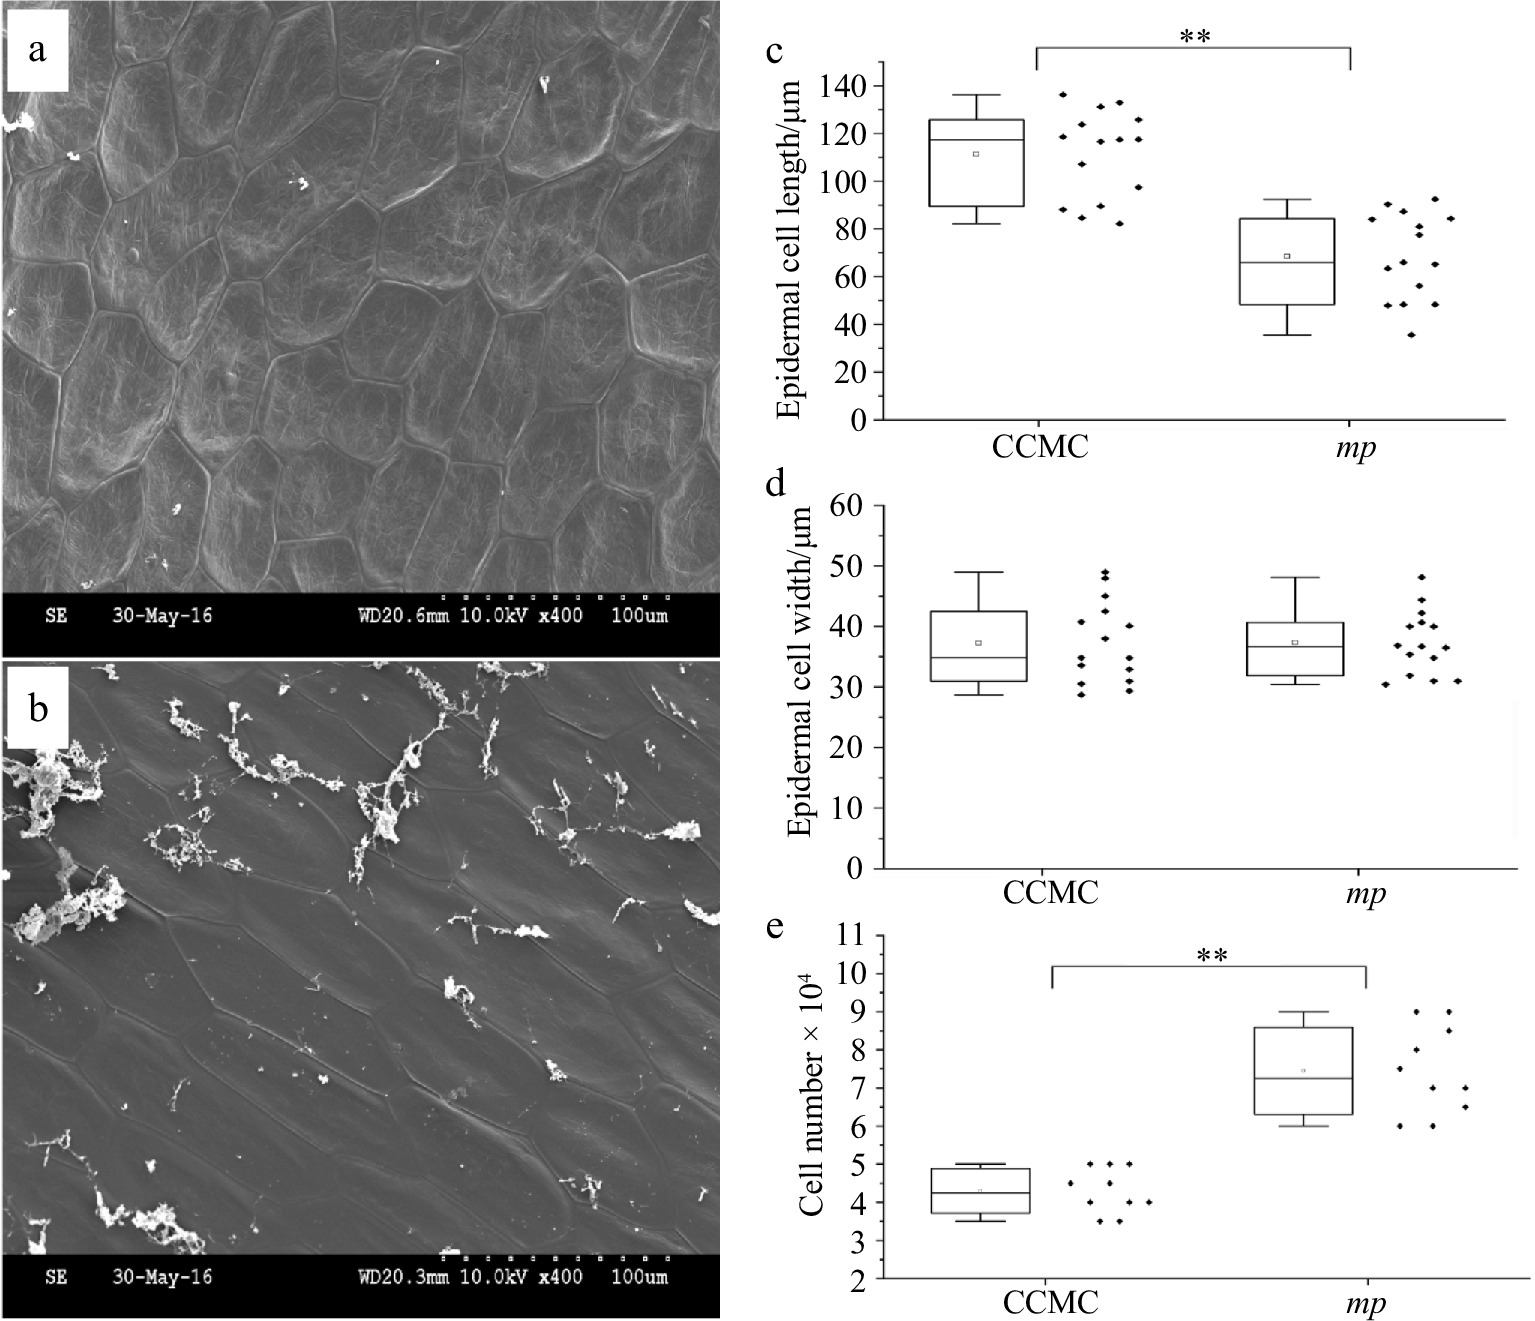
Figure 2.
Scanning electron microscopy (SEM) observation of stem epidermal cells of CCMC and mp mutant. Micrographs of stem epidermal cells in (a) mp mutant and (b) CCMC. Scale bar = 100 μm. Boxplot indicating the (c) length, (d) width and (e) cell number of epidermal cells on stems of CCMC and mp mutant.
-
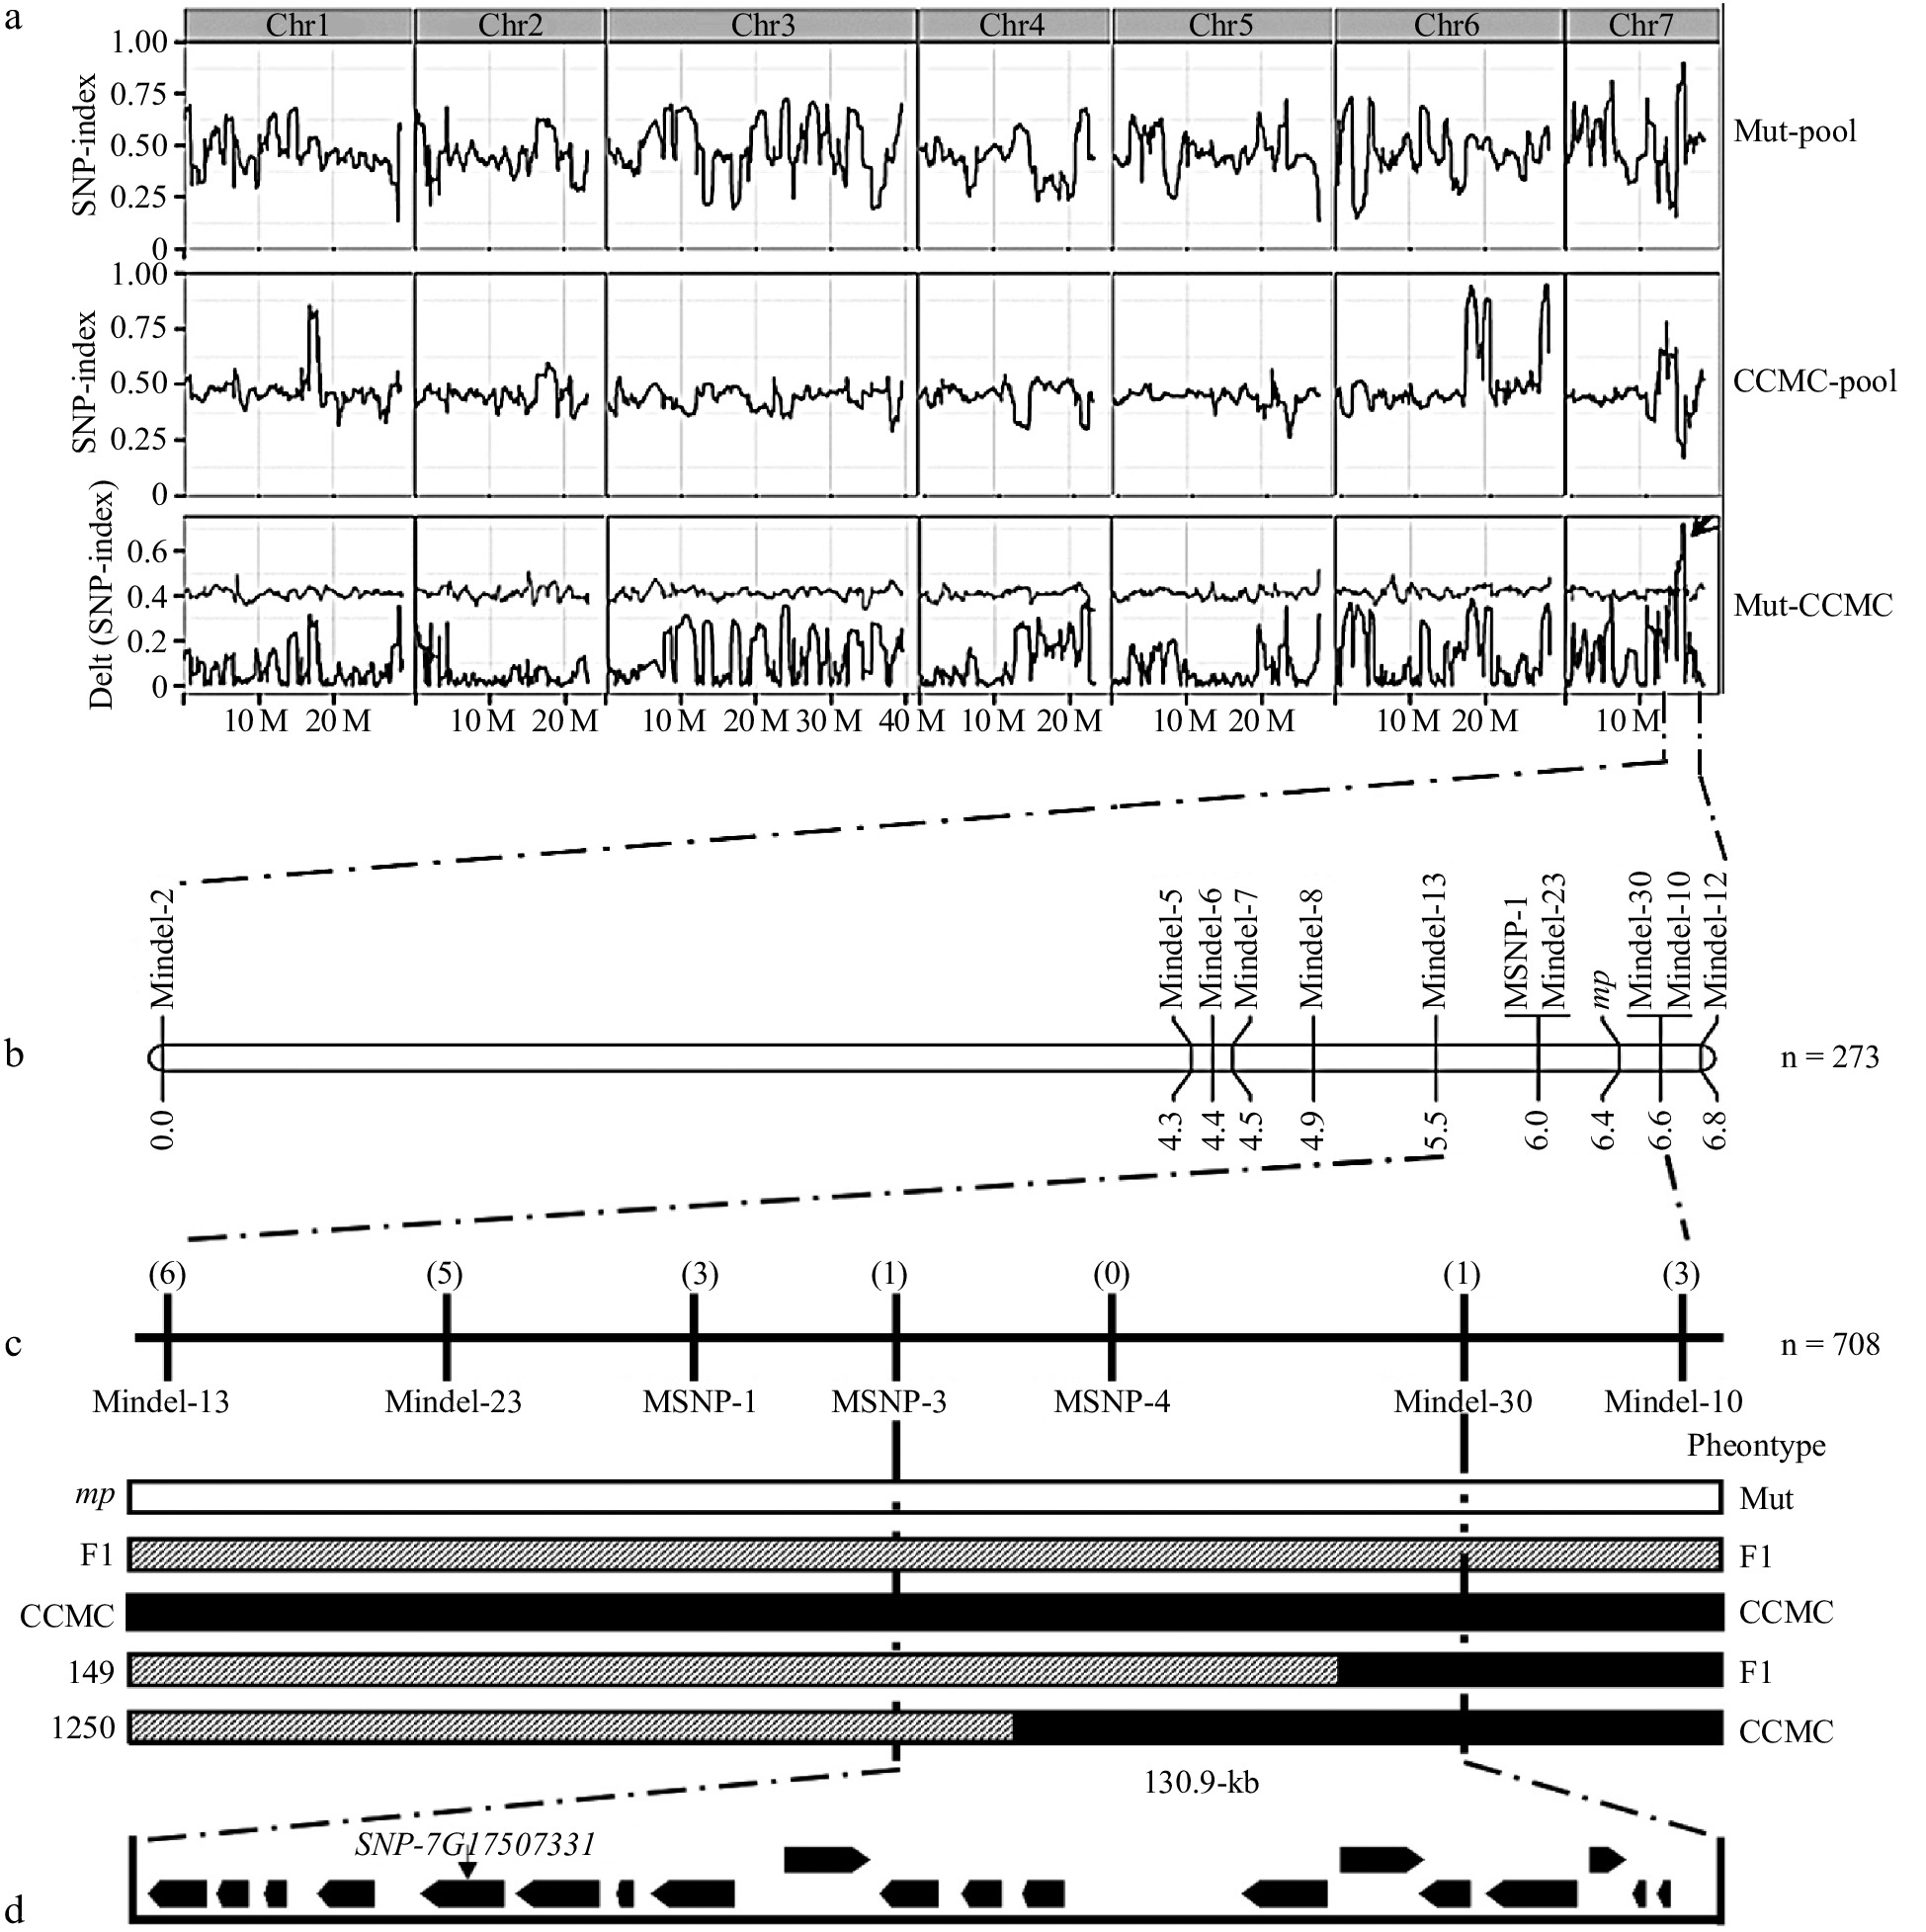
Figure 3.
BSA-seq and linkage analysis of the mp locus. (a) BSA-seq analysis identified the candidate interval for mp locus to a 2.1 Mb genomic region harboring a high ΔSNP index (subtracting the SNP-index value of the mutant-pool from the CCMC-pool) on chromosome 7 (15.5−17.6 Mb). (b) A genetic map based on a F2 segregation population containing 273 individual plants delimited the mp locus to a 1.1 cM region. (c) Seven polymorphic markers and nine recombinants were applied to narrow down the mp locus to a 130.9 kb region. The numbers in parentheses indicate the number of recombinant plants of each marker. The white box indicates the mutant genotype, the black box for the CCMC genotype, and the striped box for the heterozygous genotype. (d) Genes (black boxes) and candidate mutation site in the mapping region.
-
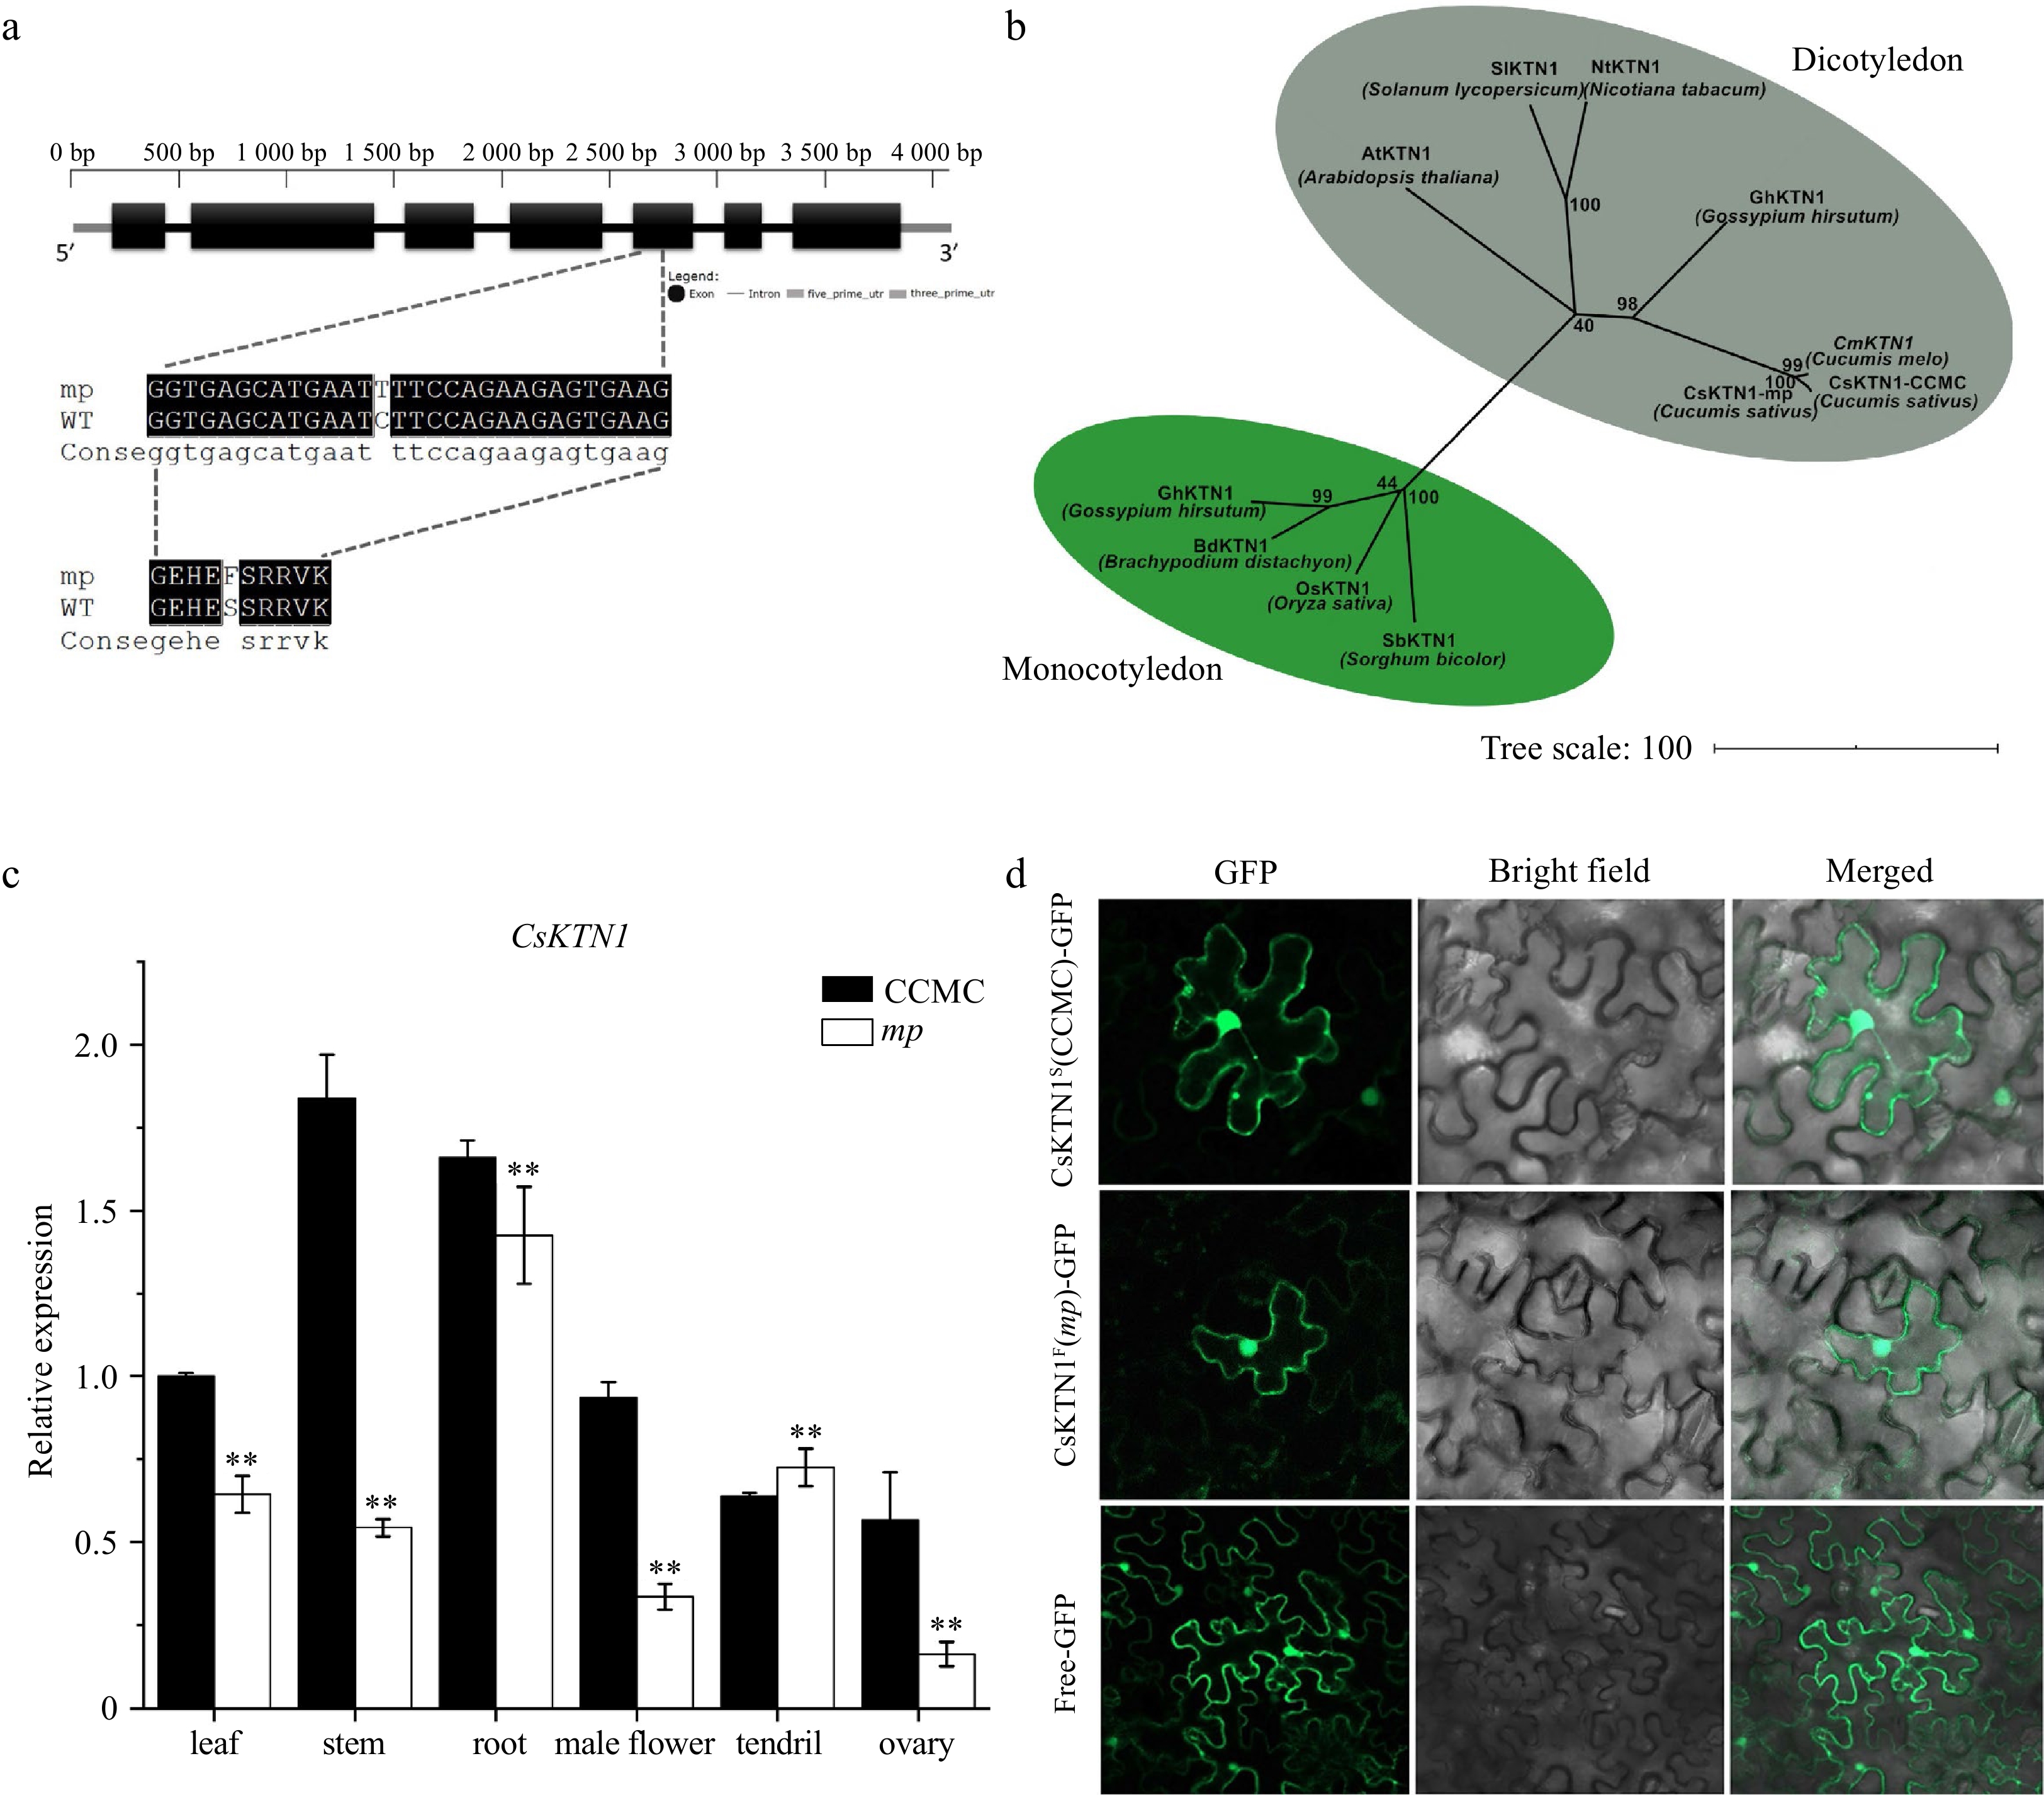
Figure 4.
Identification of CsKTN1 gene. (a) Diagram of the gene structure of Csa7G435510. A single-nucleotide mutation occurs in the fifth exon of Csa7G435510 resulted in S (Serine) to F (Phenylalanine) substitution in mp mutant. (b) A neighbor-joining tree for cucumber Katanin p60 protein and its homologs with other selected plant species, constructed by MEGA 7. The numbers at the branch points represent bootstrap values (%) of 1000 replications. (c) Relative expression of CsKTN1 in different tissues of mp and CCMC plants measured by qRT-PCR. Values are mean±SD. ** P < 0.01 (Student's t-test). (d) Subcellular localization of CsKTN1 protein (CCMC and mp mutant) in tobacco epidermal cell. GFP signal was observed by confocal fluorescence microscopy. GFP, Bright field and Merged represent the images observed under different light fields. Free-GFP represents the free GFP plasmid p35S::GFP, while CsKTN1F(mp)-GFP and CsKTN1S(CCMC)-GFP represent two KNT1-GFP protein.
-
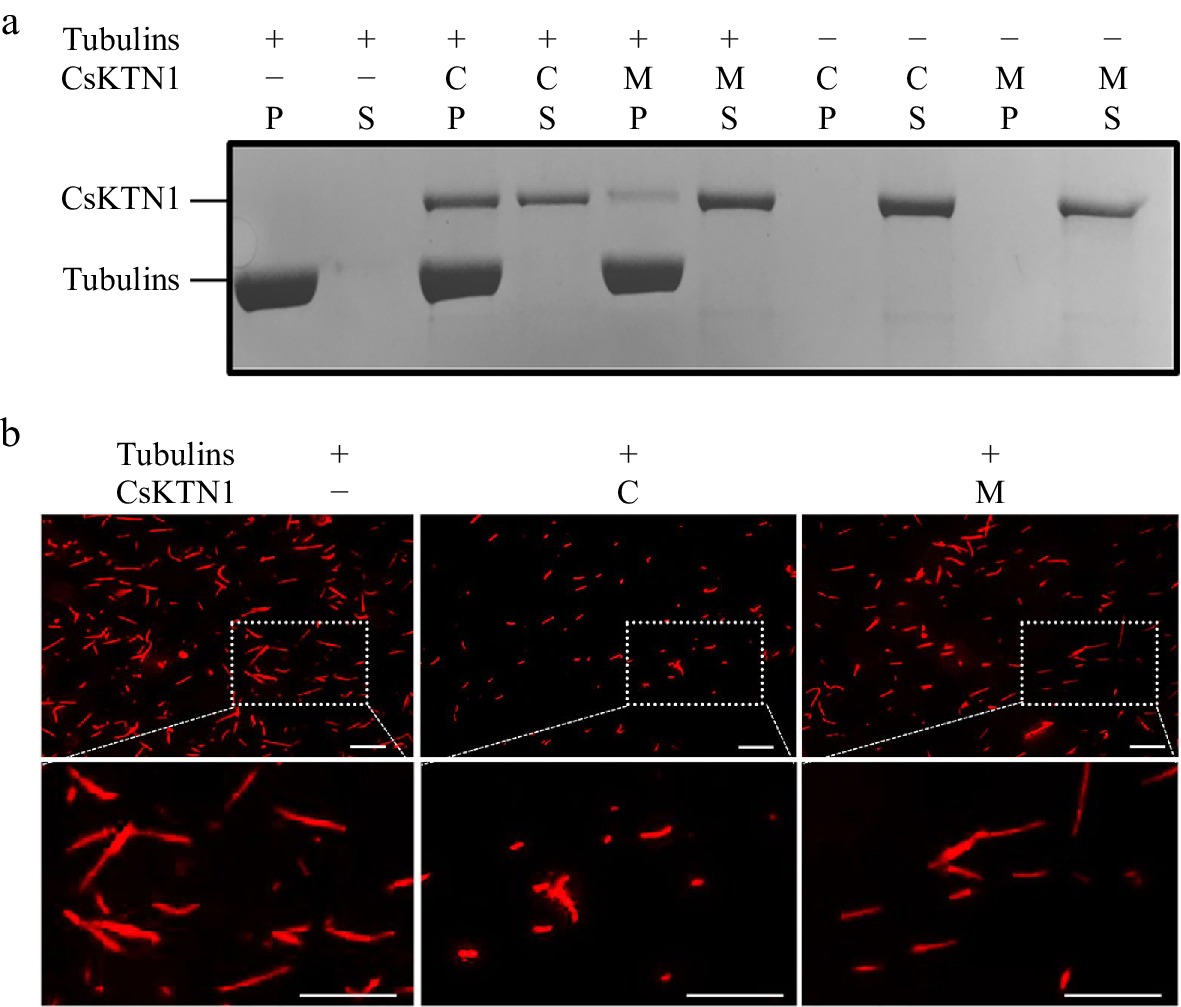
Figure 5.
Microtubule binding and shearing capacity of CsKTN1. (a) Binding of CsKTN1 to microtubules in vitro. The proteins of supernatants (S) and the pellets (P) were analyzed on a coomassie-blue-stained polyacrylamide gel. C: CsKTN1S (CCMC)-His, M: CsKTN1F (mp mutant)-His, +: present, −: absent. (b) Microtubule-shearing activity of CsKTN1 in vitro. The shearing situation of microtubules was observed by fluorescence microscopy. Bar = 10 μm.
Figures
(5)
Tables
(0)