-
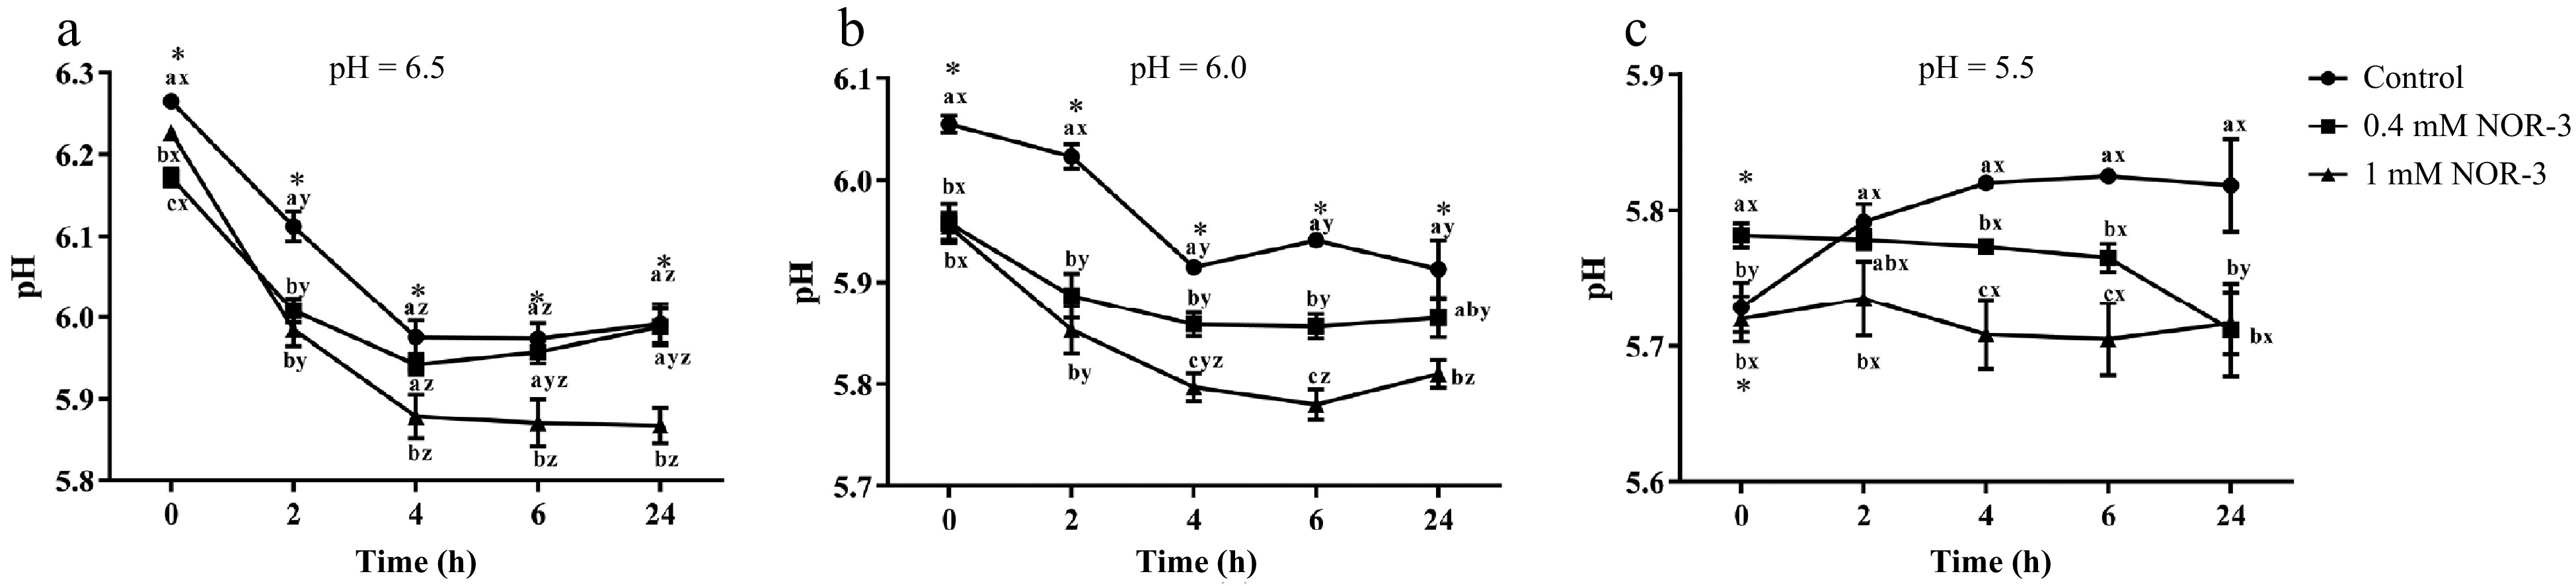
Figure 1.
pH of in vitro reactions. All measurements were expressed as the mean ± SE. a–c: Different letters at the same time points are significantly different between treatments (p < 0.05). x–z: Different letters are significantly different at different incubation times within the same treatment (p < 0.05). (n = 6).
-
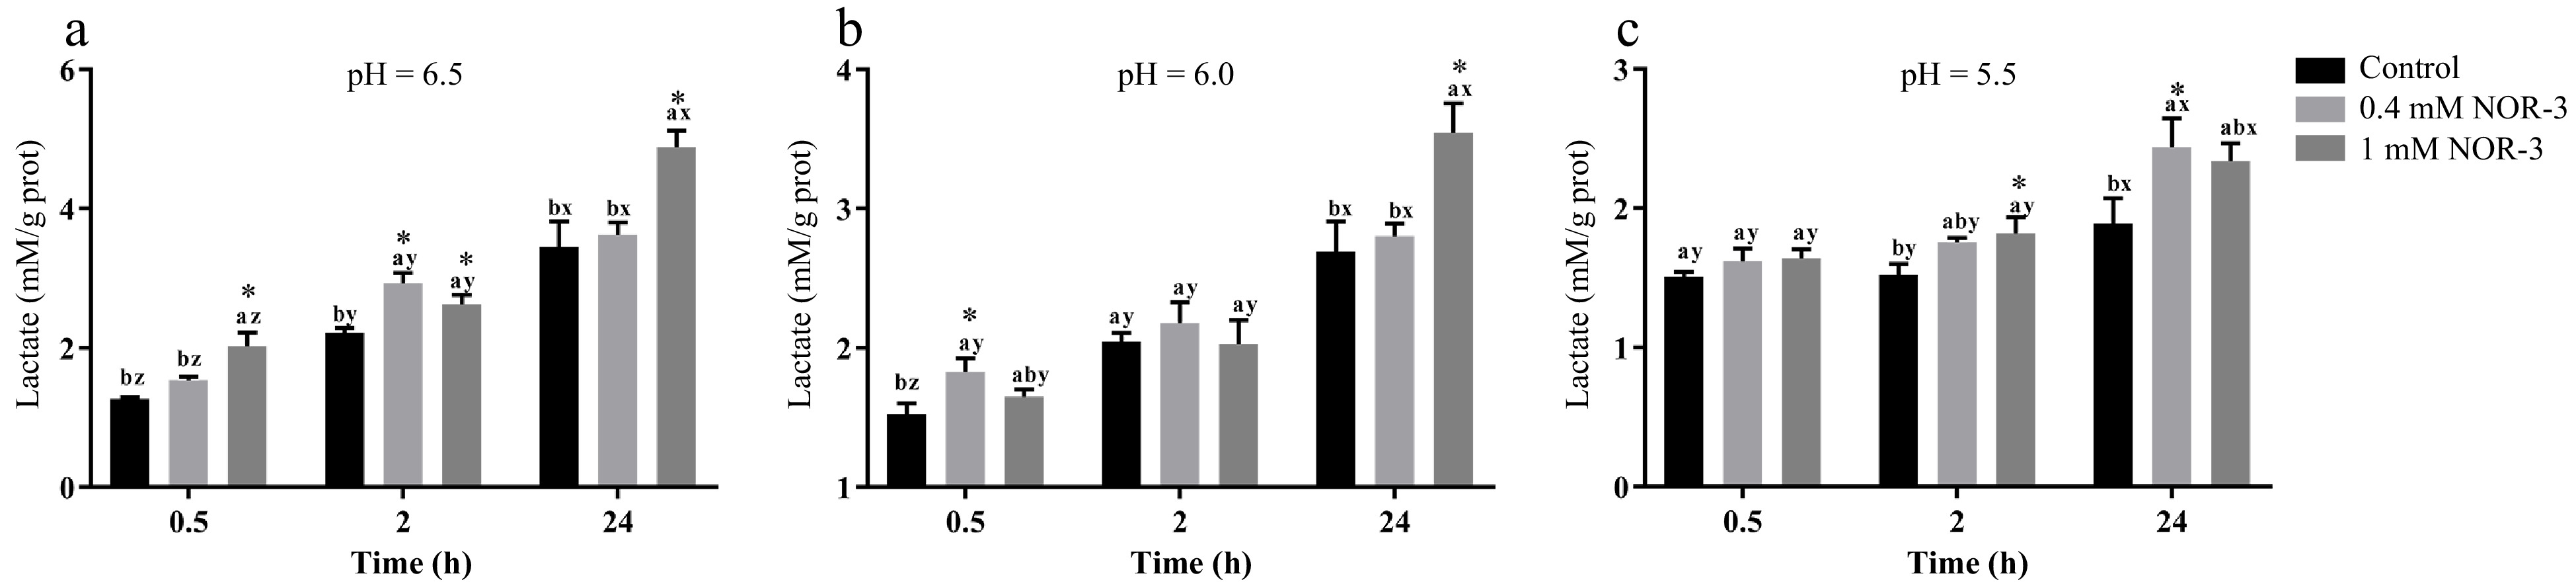
Figure 2.
The content of lactate in the in vitro reactions. All measurements were expressed as the mean ± SE. a–c: Different letters at the same time points are significantly different between treatments (p < 0.05). x–z: Different letters are significantly different at different incubation times within the same treatments (p < 0.05). (n = 6).
-
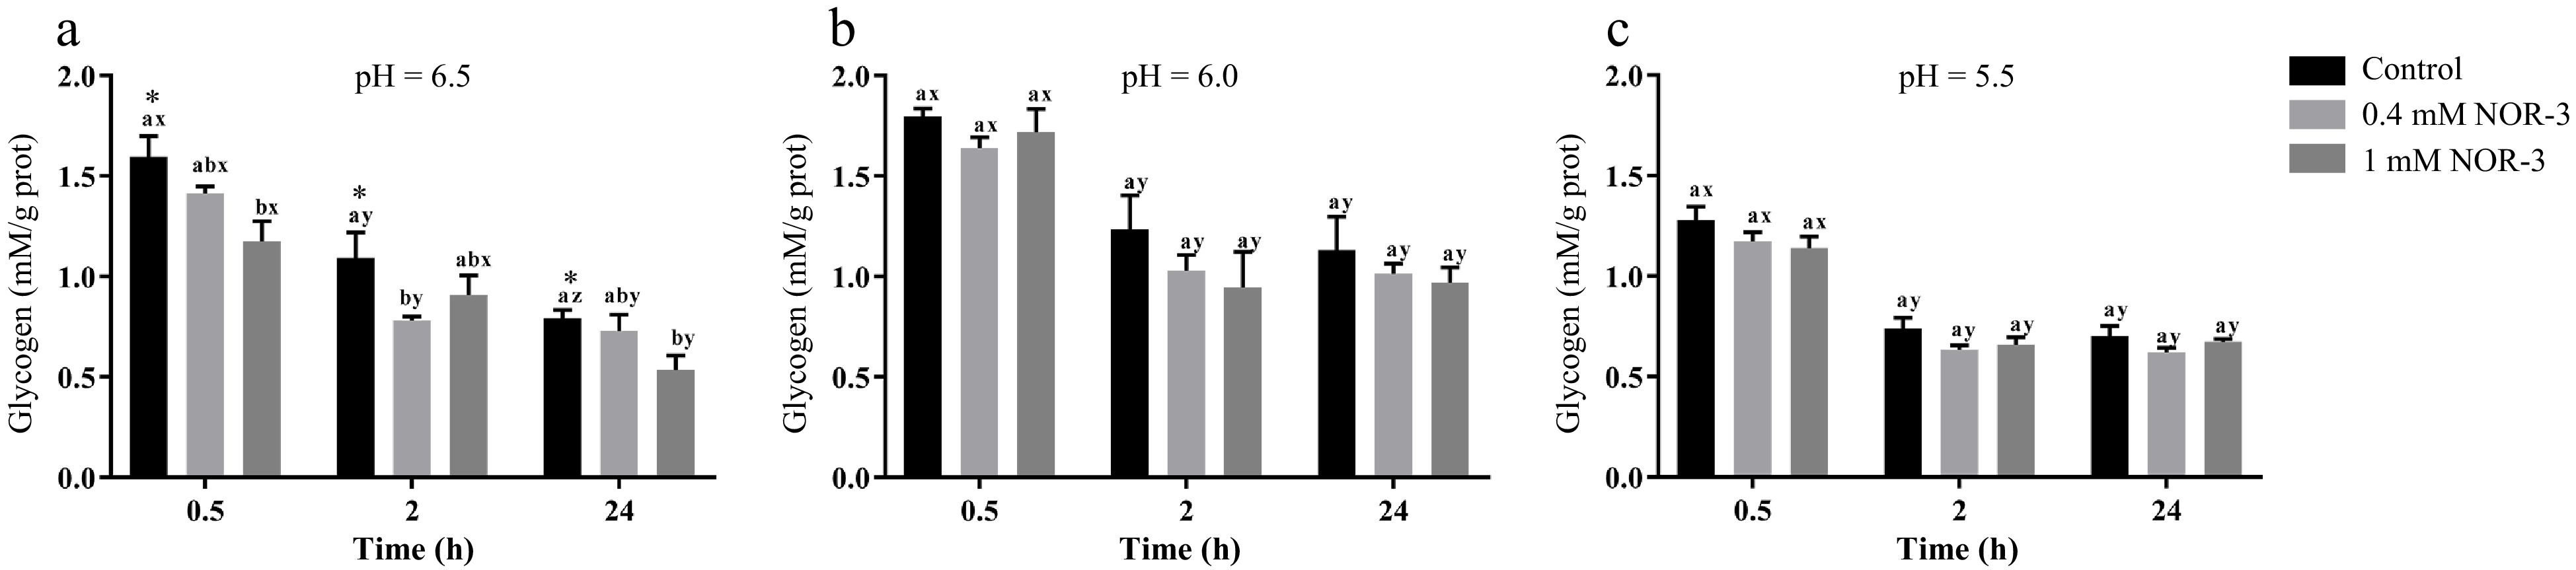
Figure 3.
The content of glycogen in the in vitro reactions. All measurements were expressed as the mean ± SE. a–c: Different letters at the same time points are significantly different between treatments (p < 0.05). x–z: Different letters are significantly different at different incubation times within the same treatments (p < 0.05). (n = 6).
-
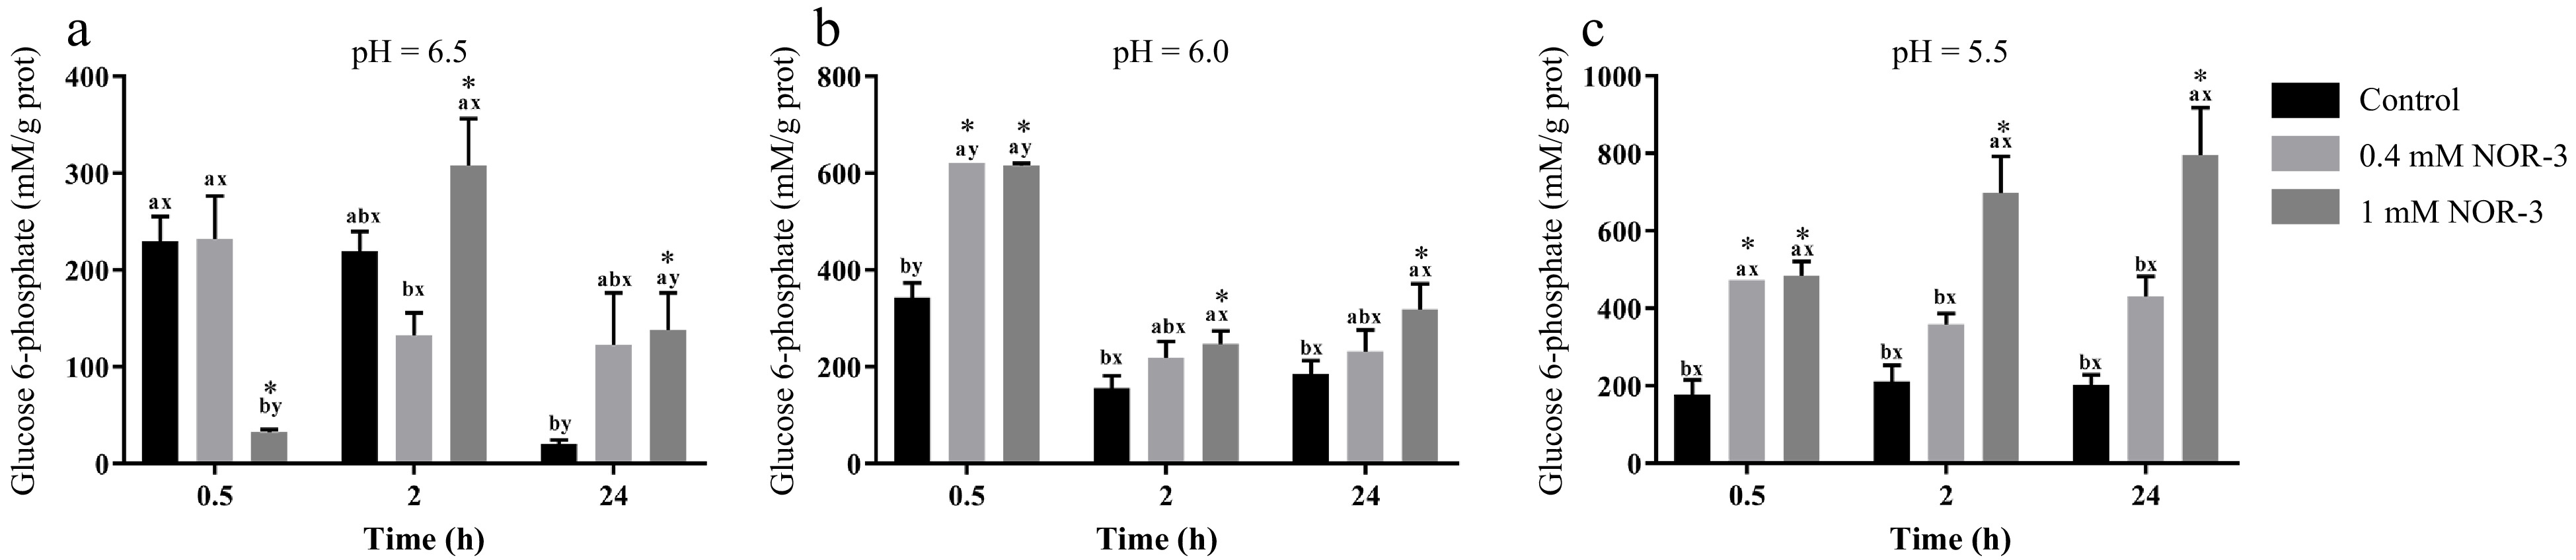
Figure 4.
The content of glucose-6-phosphate in the in vitro model. All measurements were expressed as the mean ± SE. a–c: Different letters at the same time points are significantly different between treatments (p < 0.05). x–z: Different letters are significantly different at different incubation times within the same treatments (p < 0.05). (n = 6).
-
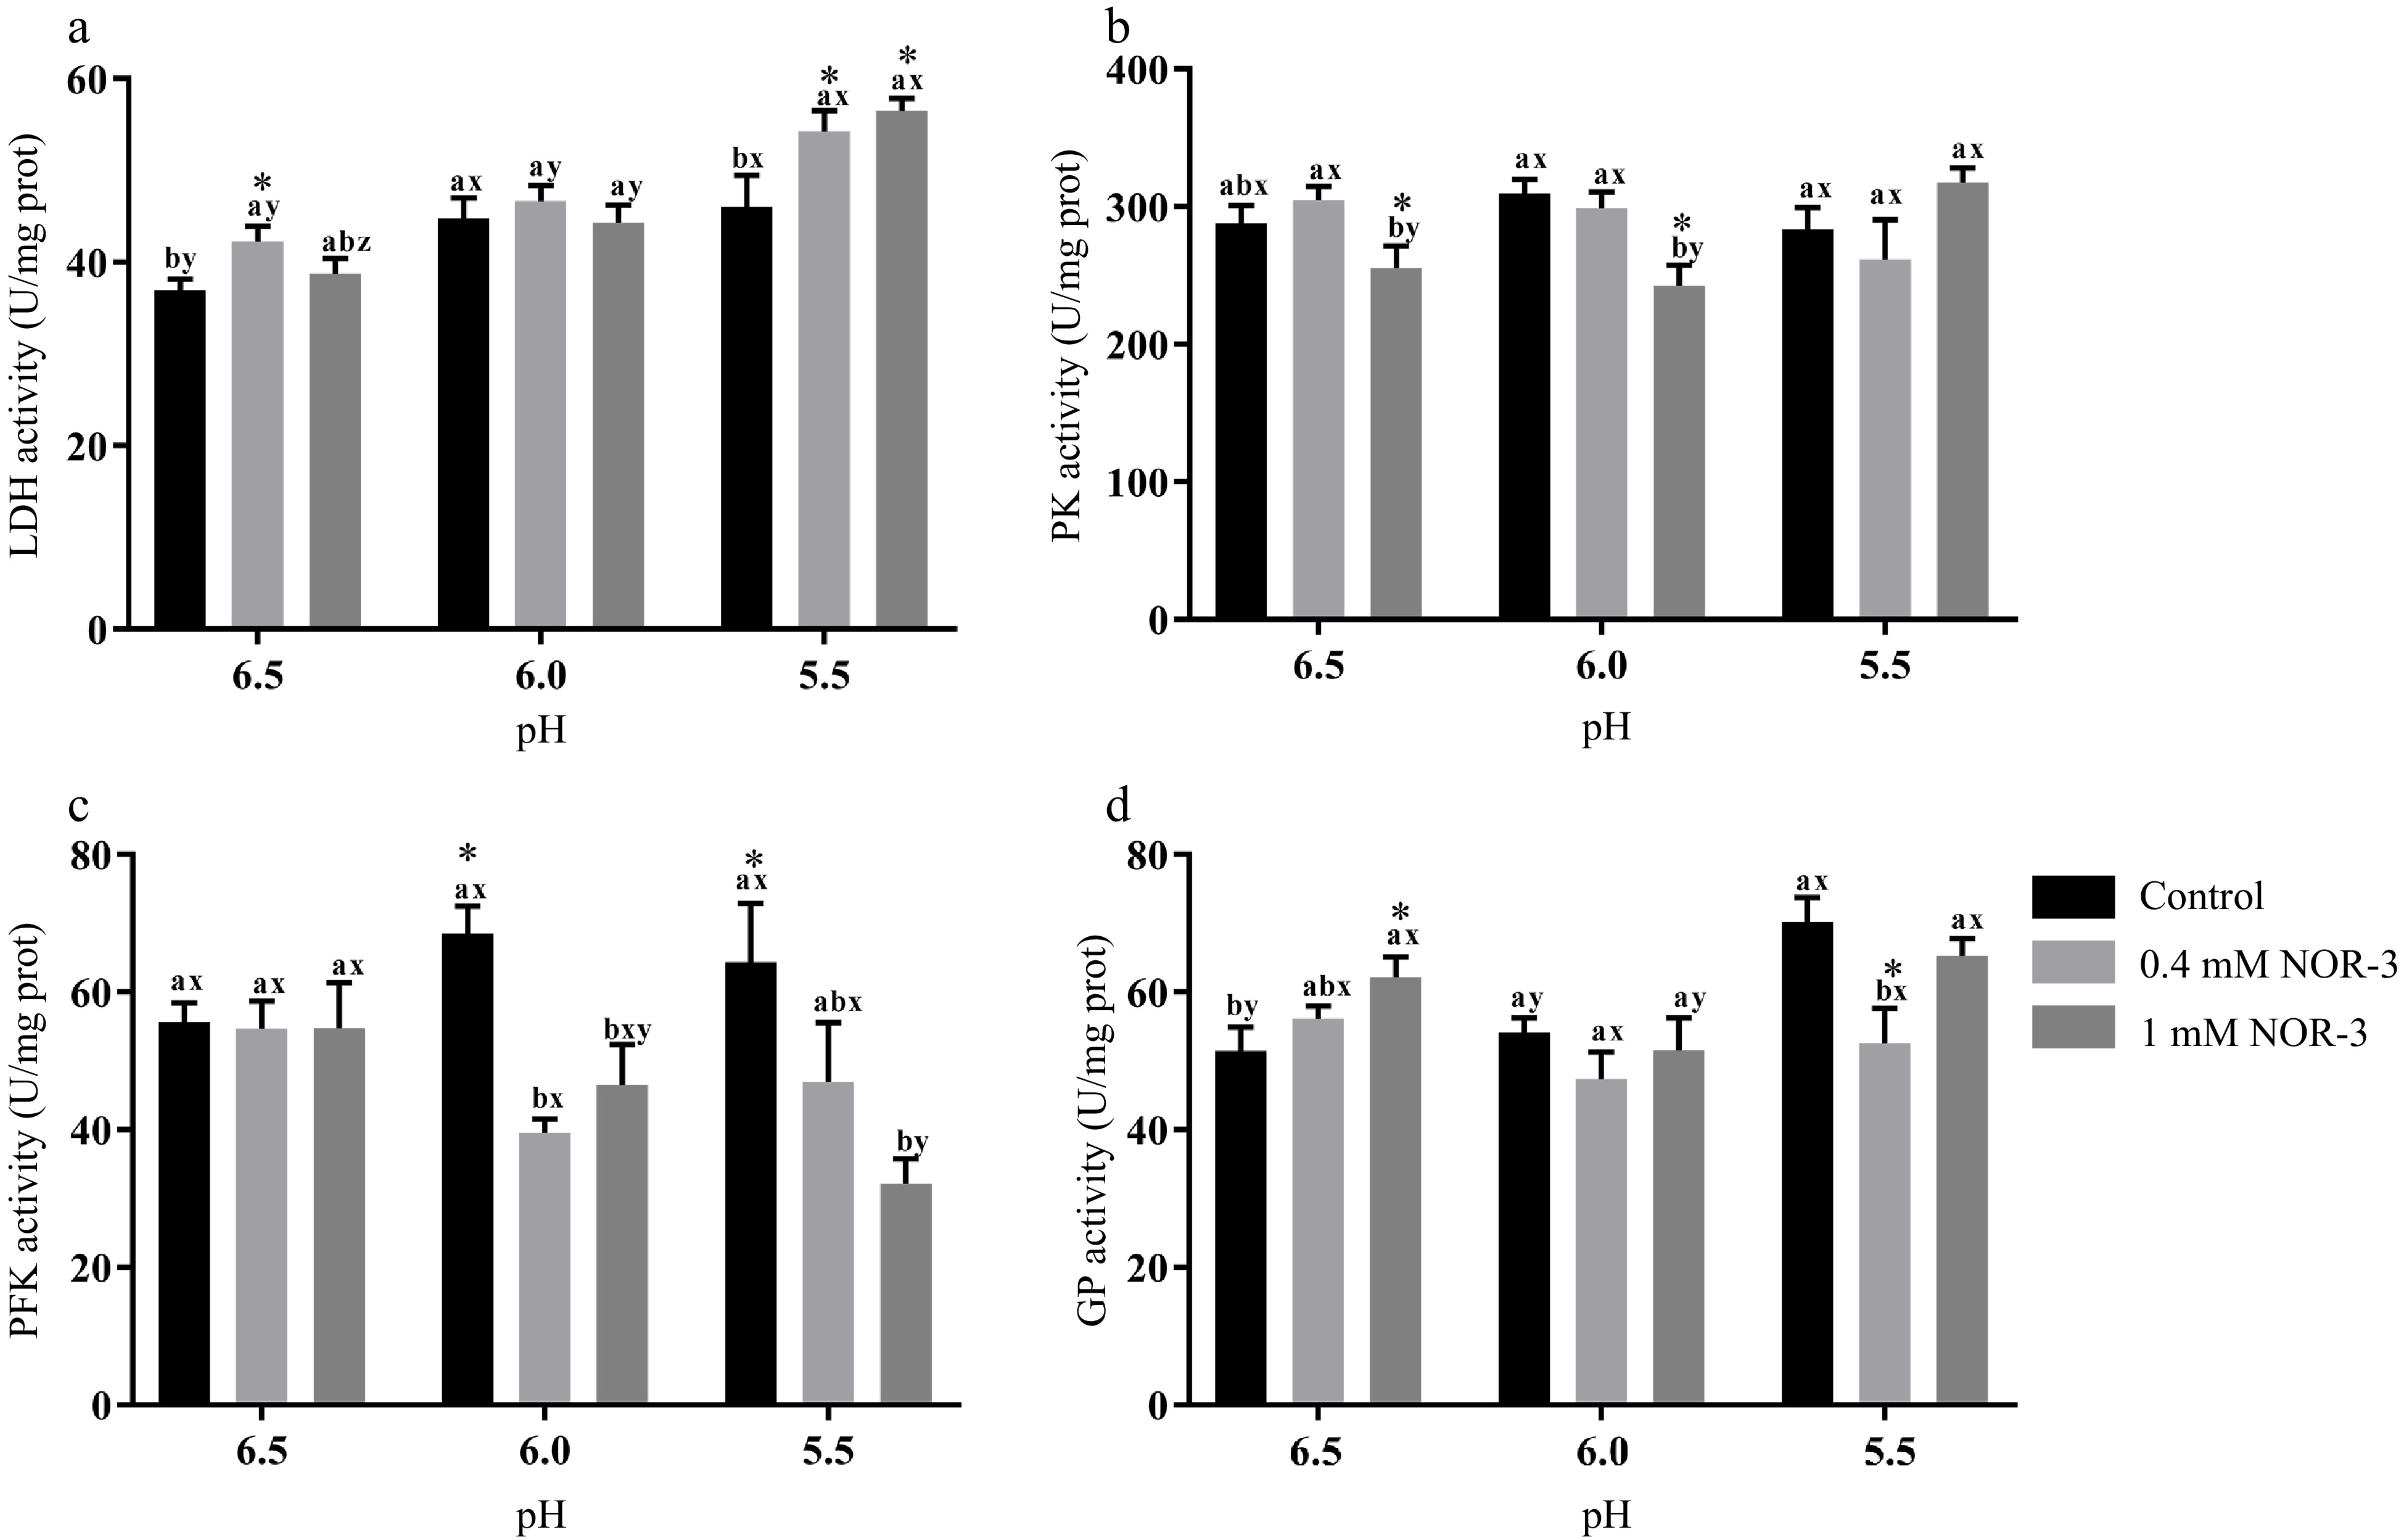
Figure 5.
The activities of glycolytic enzymes in the in vitro model at 0.5 h. All measurements were expressed as the mean ± SE. a–c: Different letters at the same pH conditions are significantly different between treatments (p < 0.05). x–z: Different letters are significantly different at different incubation pH within the same treatments (p < 0.05). (n = 6).
-
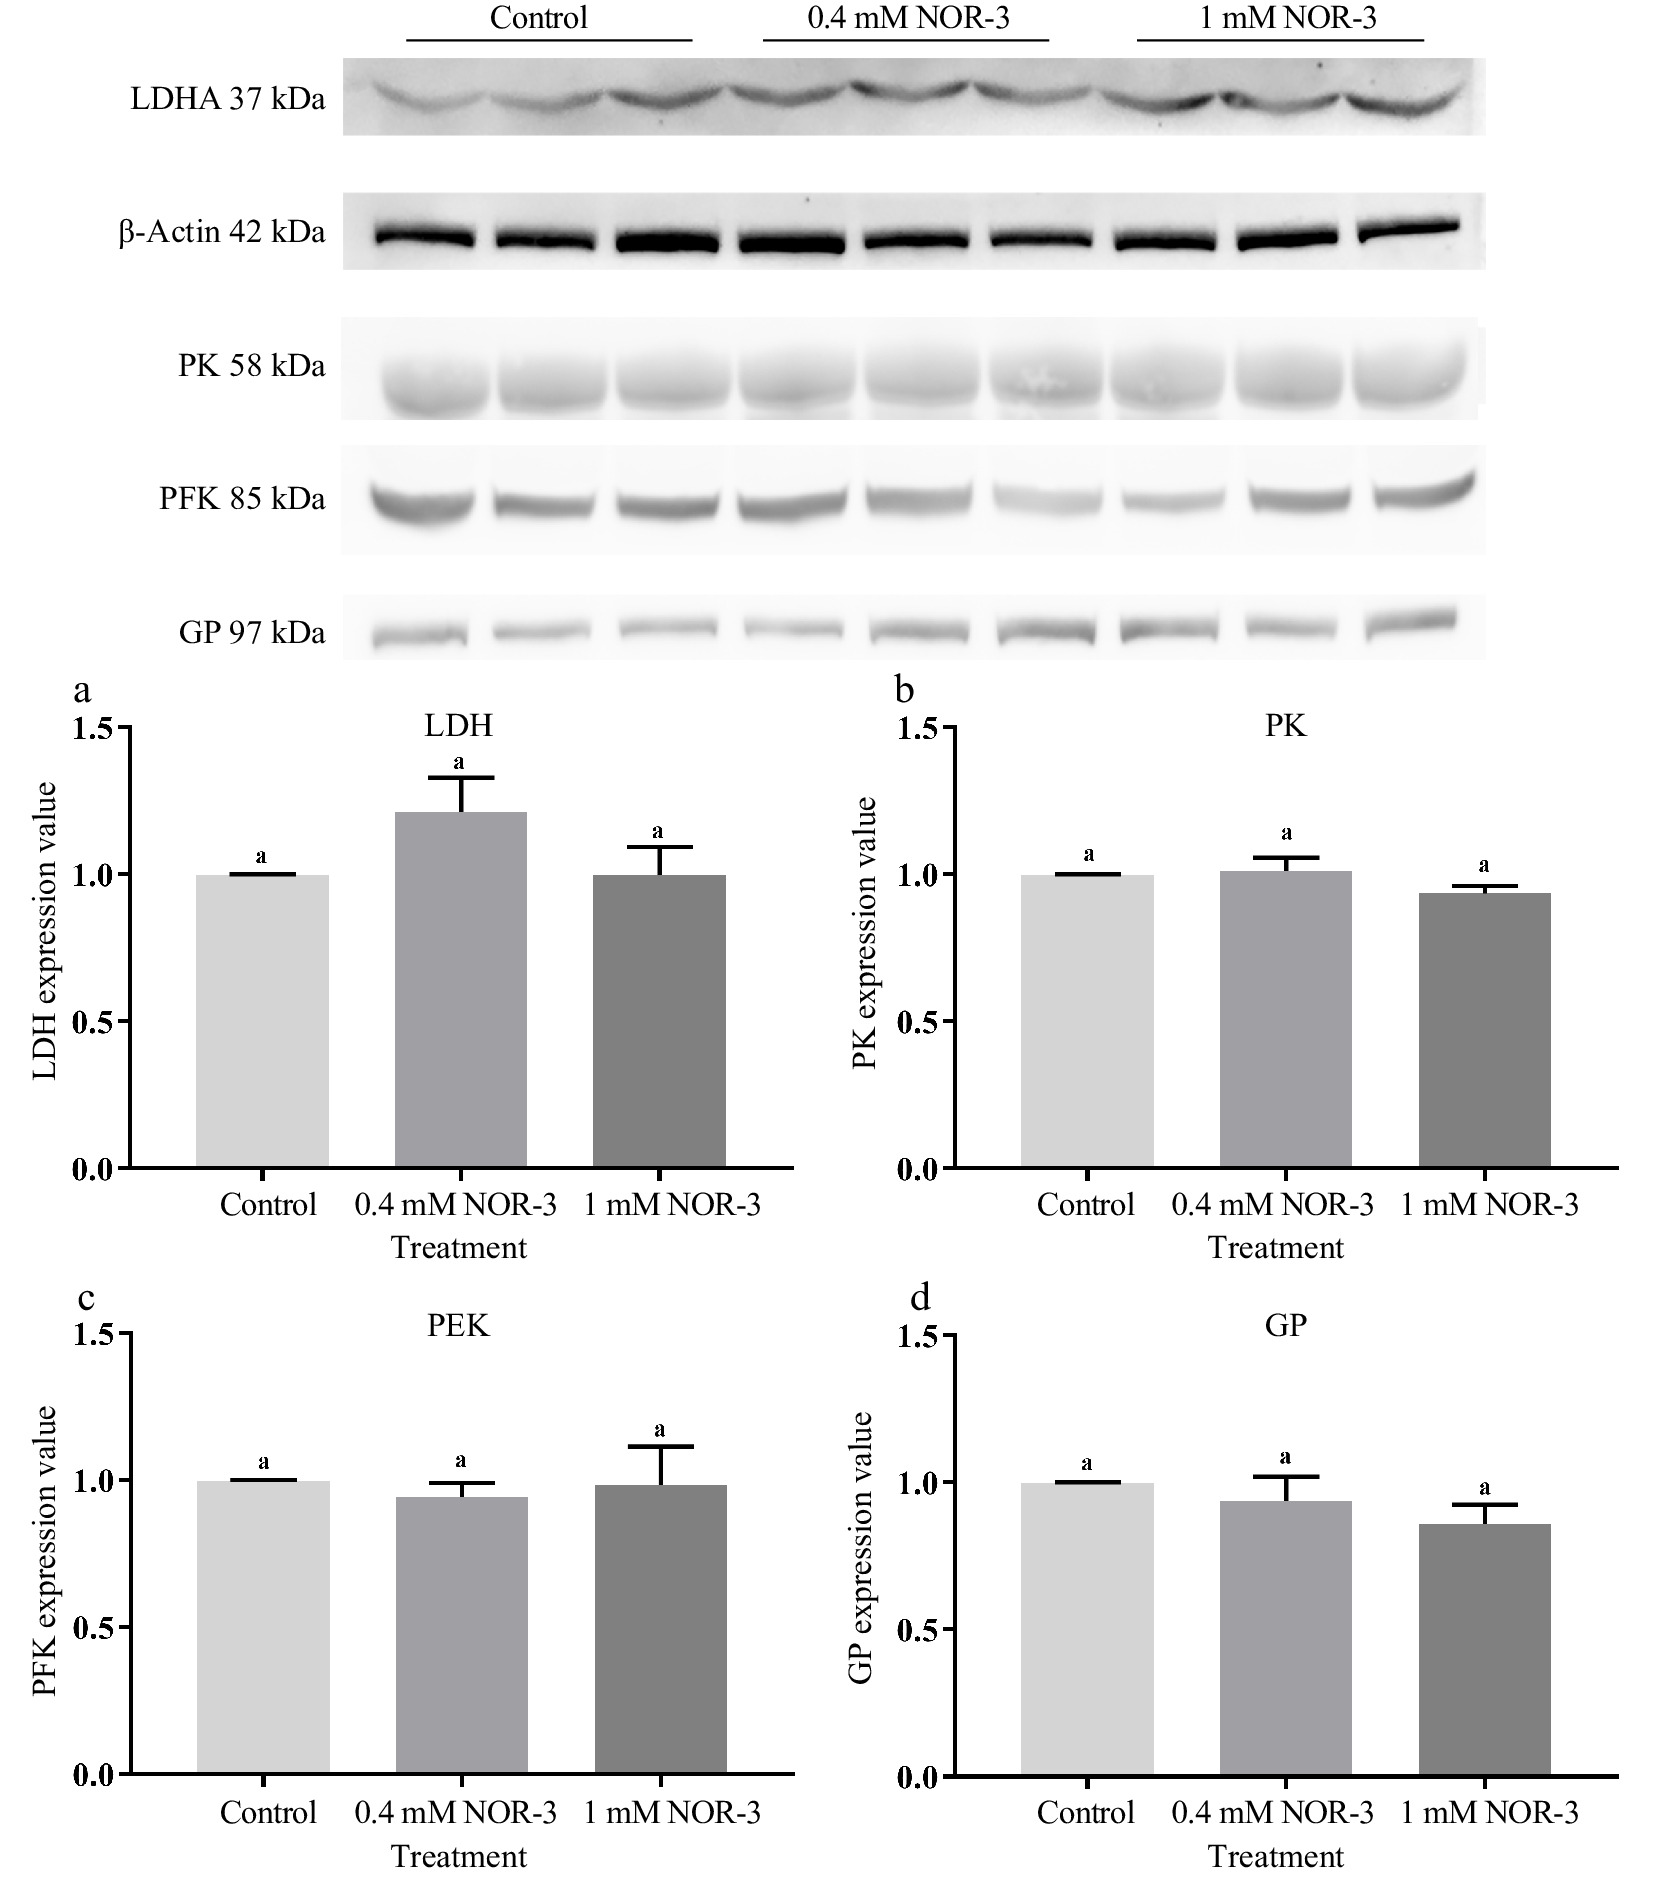
Figure 6.
The expression value of glycolytic enzymes in the in vitro model at 0.5 h. All measurements were expressed as the mean ± SE. a–c: Different letters are significantly different between treatments (p < 0.05). (n = 6).
-
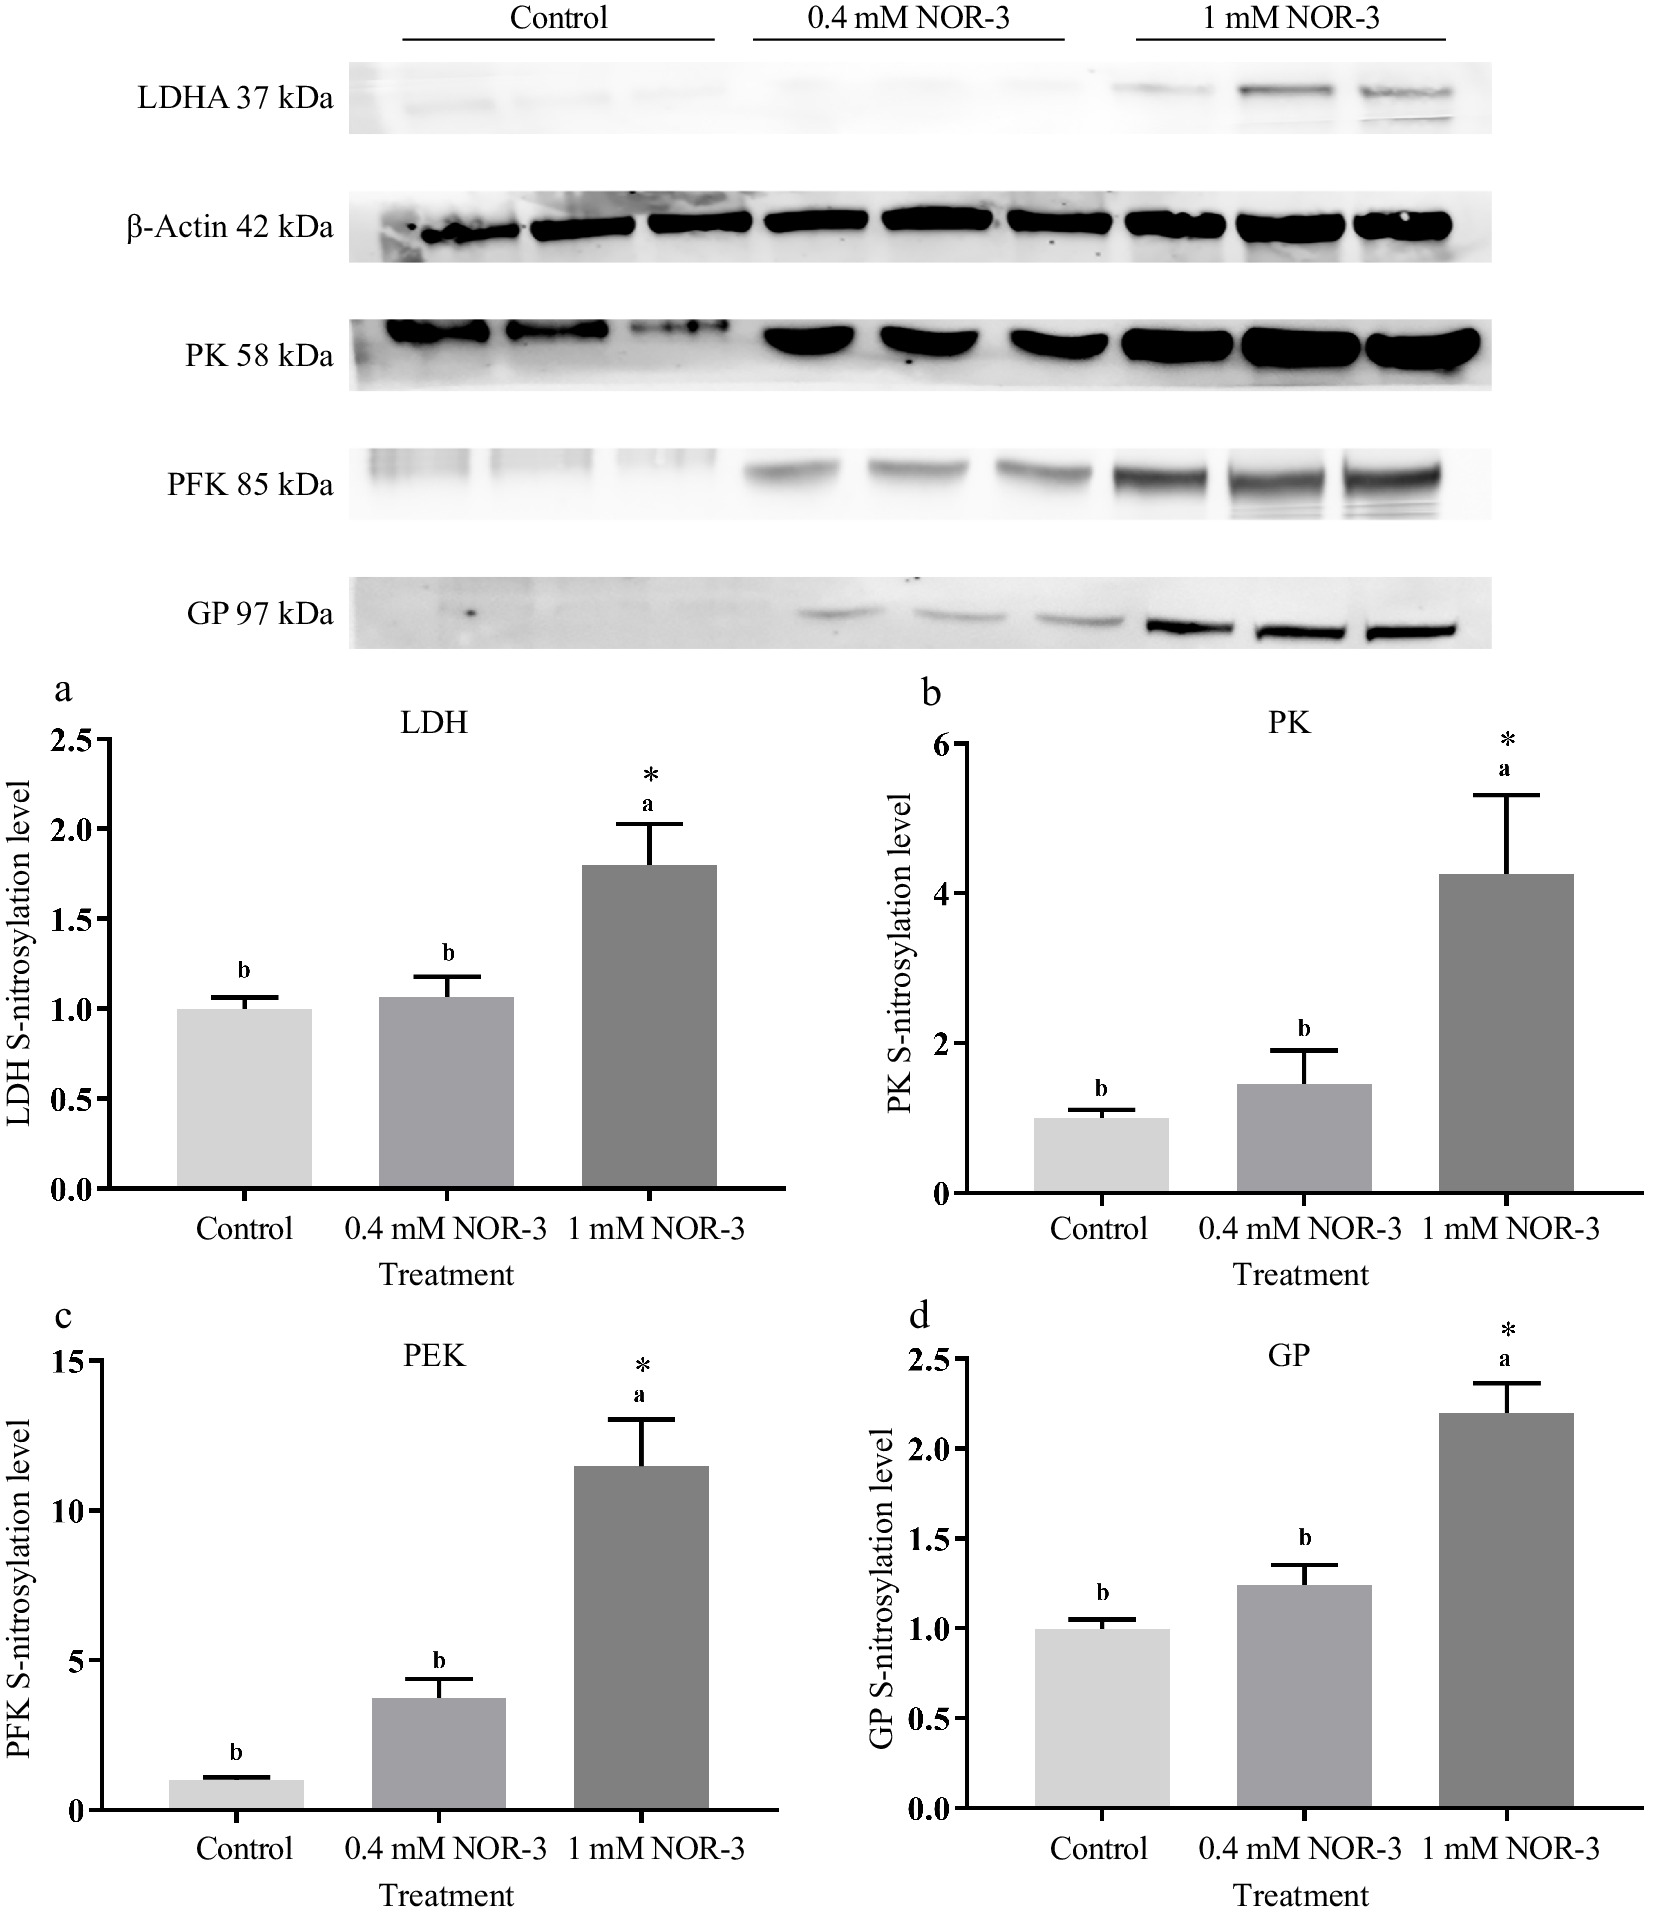
Figure 7.
The S-nitrosylation levels of glycolytic enzymes in the in vitro reactions at 0.5 h. All measurements were expressed as the mean ± SE. a–c: Different letters are significantly different between treatments (p < 0.05). (n = 6).
Figures
(7)
Tables
(0)