-
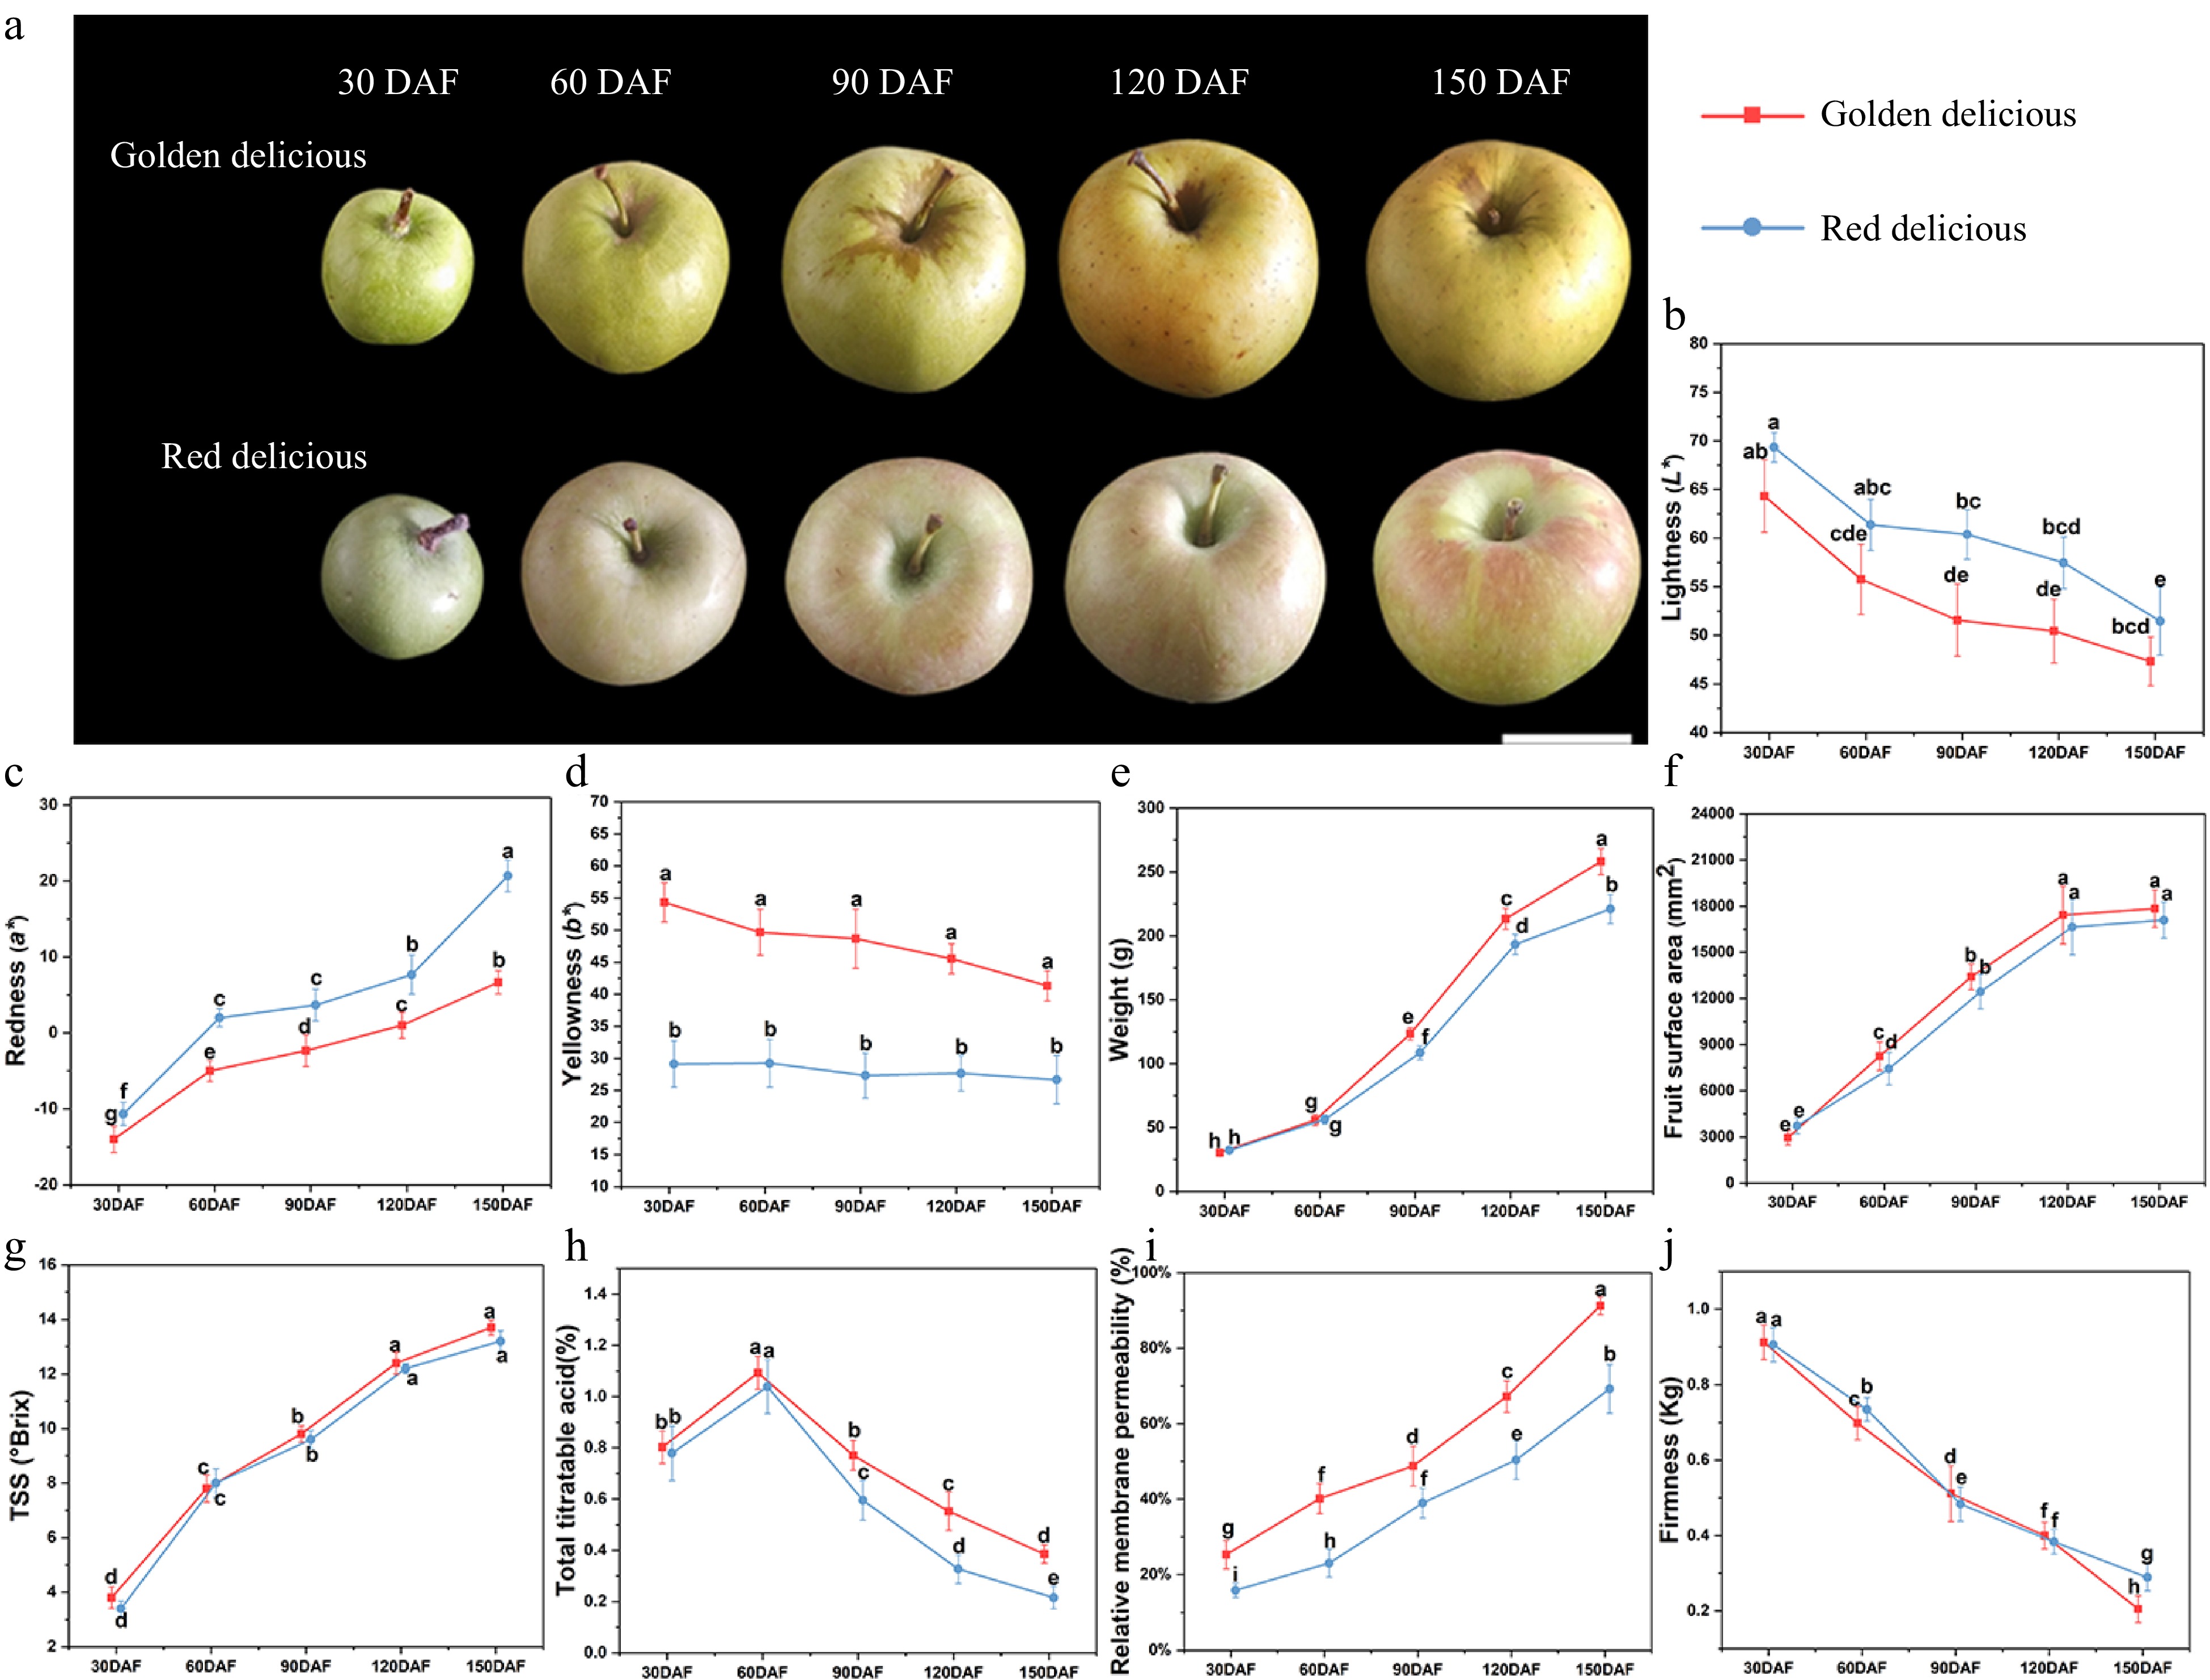
Figure 1. Changes of fruit appearance and quality during growth and development. (a) Fruit phenotypic, (b) lightness, (c) redness, (d) yellowness, (e) fruit weight, (f) fruit surface area, (g) TSS, (h) TA, (i) relative electrical conductivity of pericarp tissue, (j) fruit firmness (P/2 columnar probe diameter: 2 mm). Different letters in the same fraction indicate significant differences at p ≤ 0.05 according to Duncan's new multiple range test. Each value is the mean ± standard error.
-
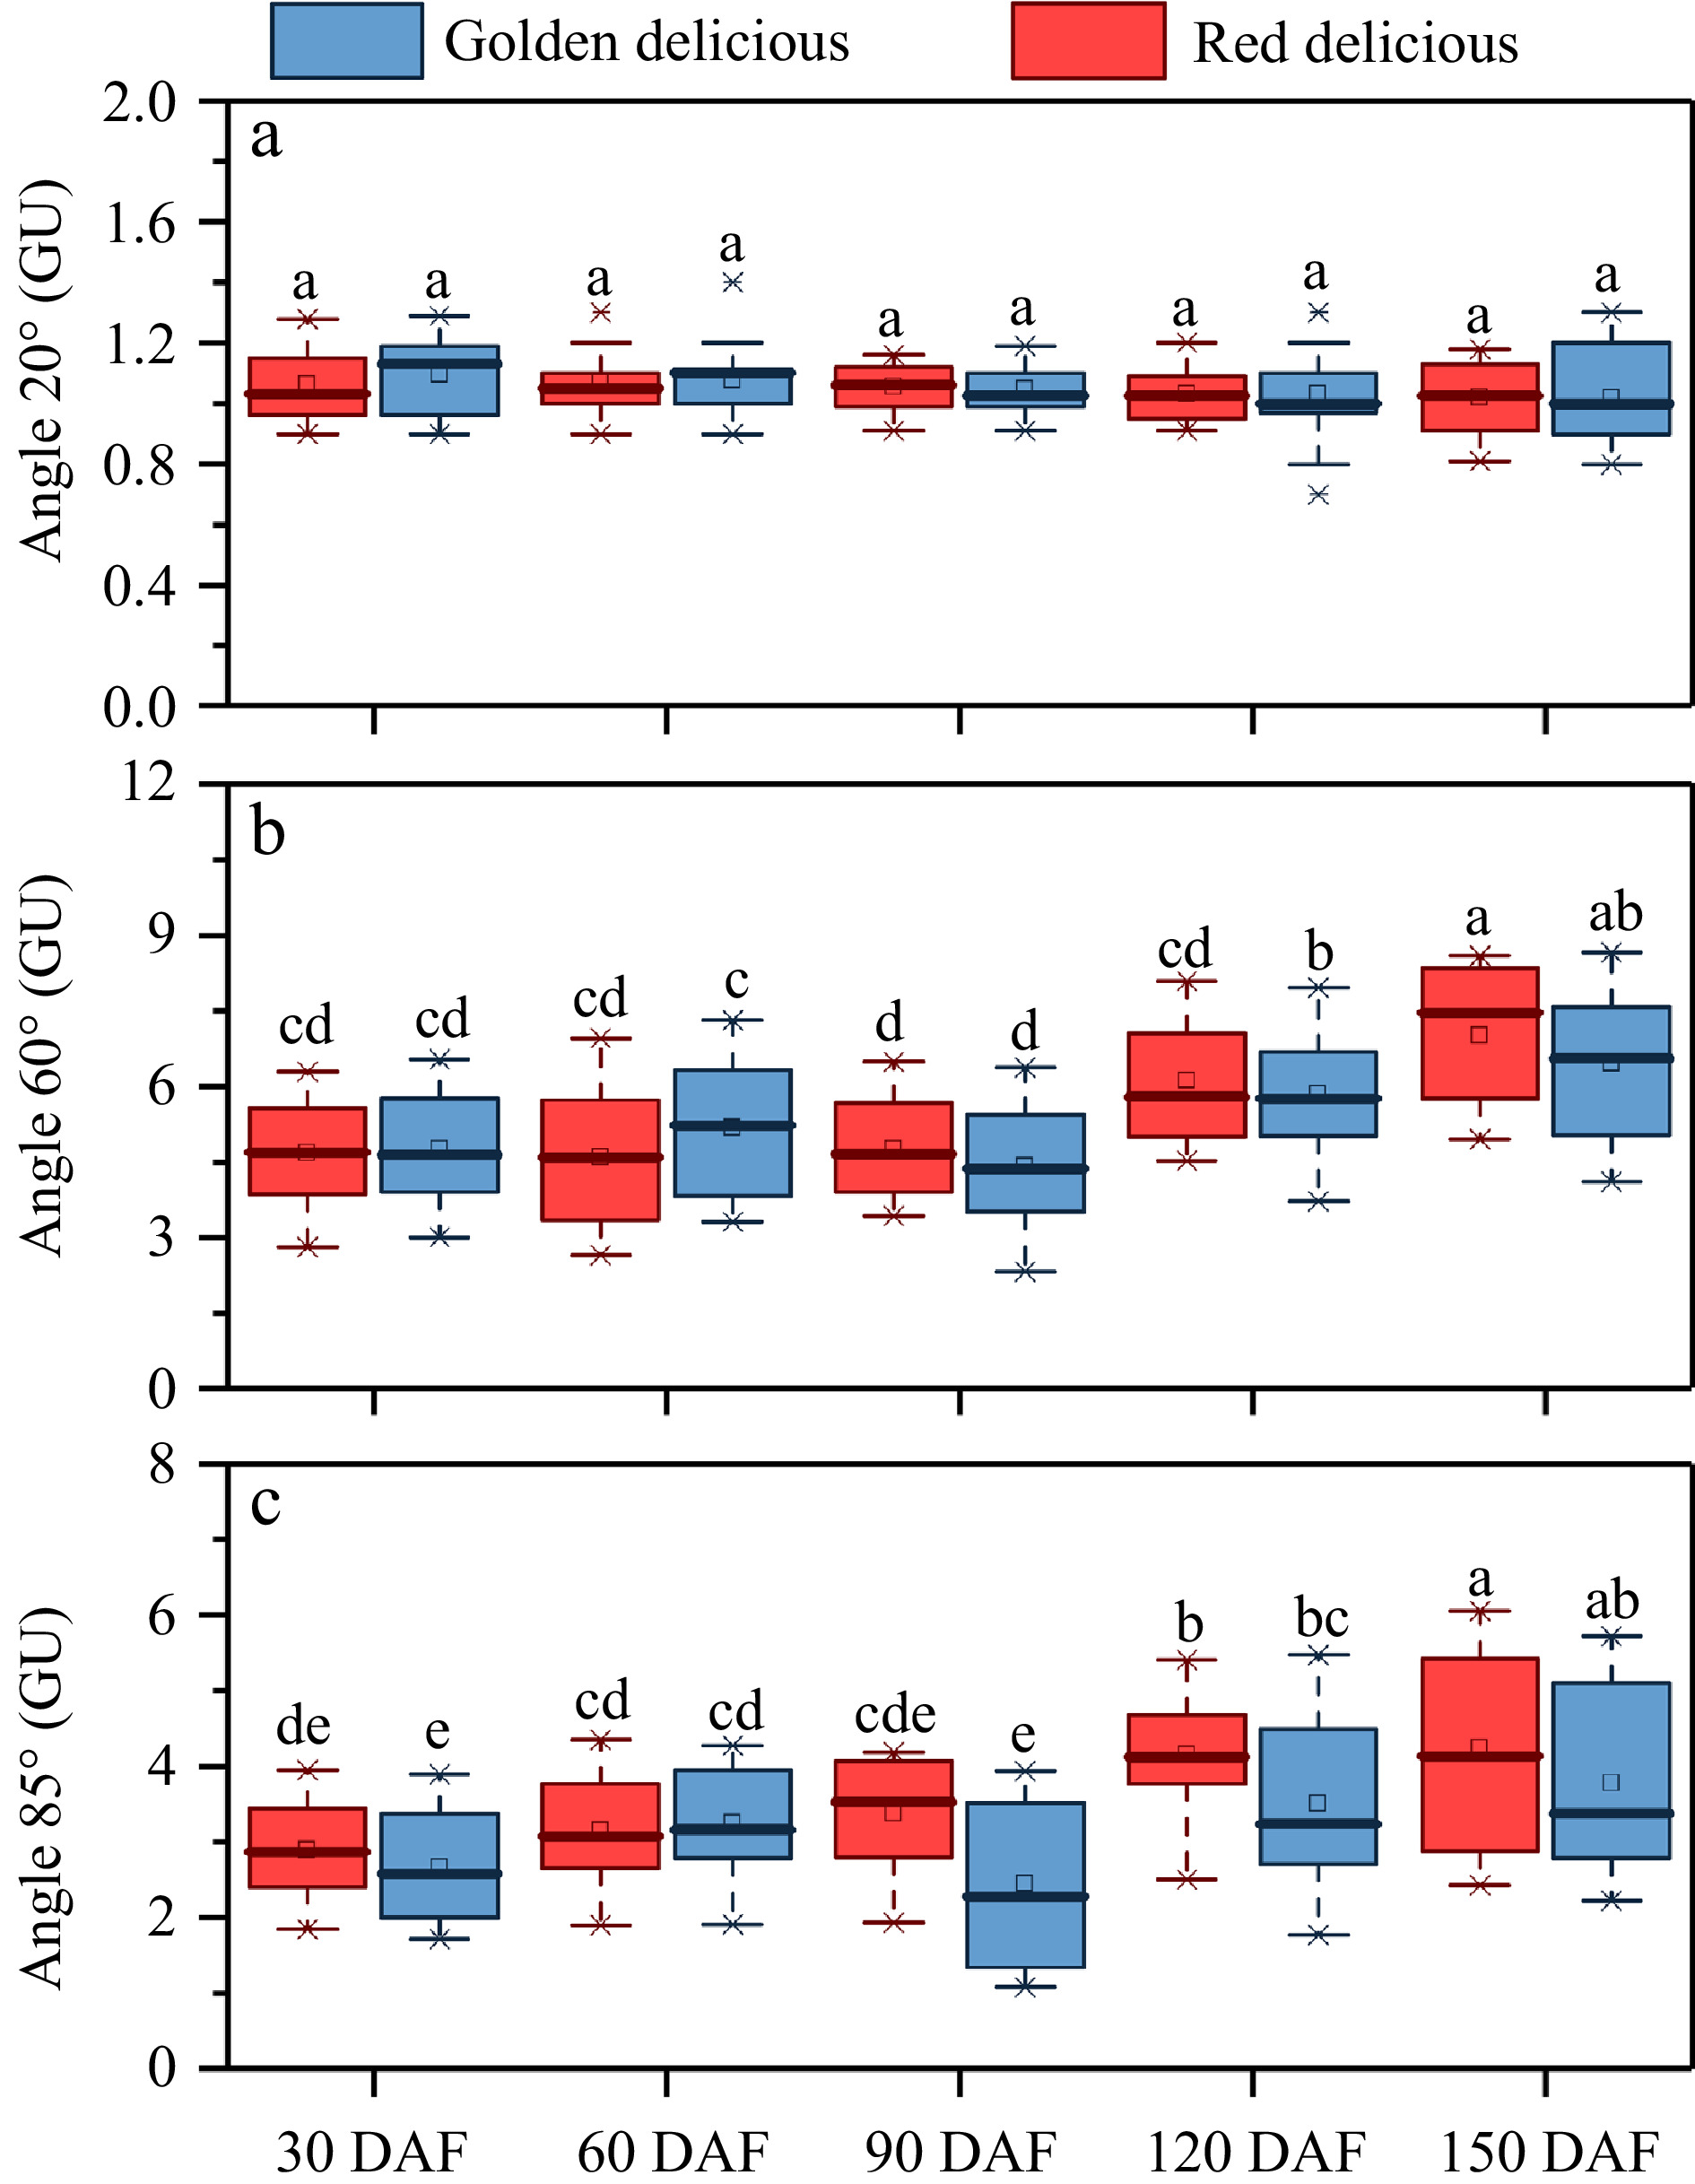
Figure 2. Changes in appearance gloss during fruit growth and development. (a) Angle 20°, (b) angle 60°, (c) angle 85°. Different letters in the same fraction indicate significant differences at p ≤ 0.05 according to Duncan's new multiple range test. Box edges represent the 0.25 and 0.75 quantiles, and the bold lines indicate median values. Whiskers indicate 1.5 times the interquartile range. Each value is the mean ± standard error.
-
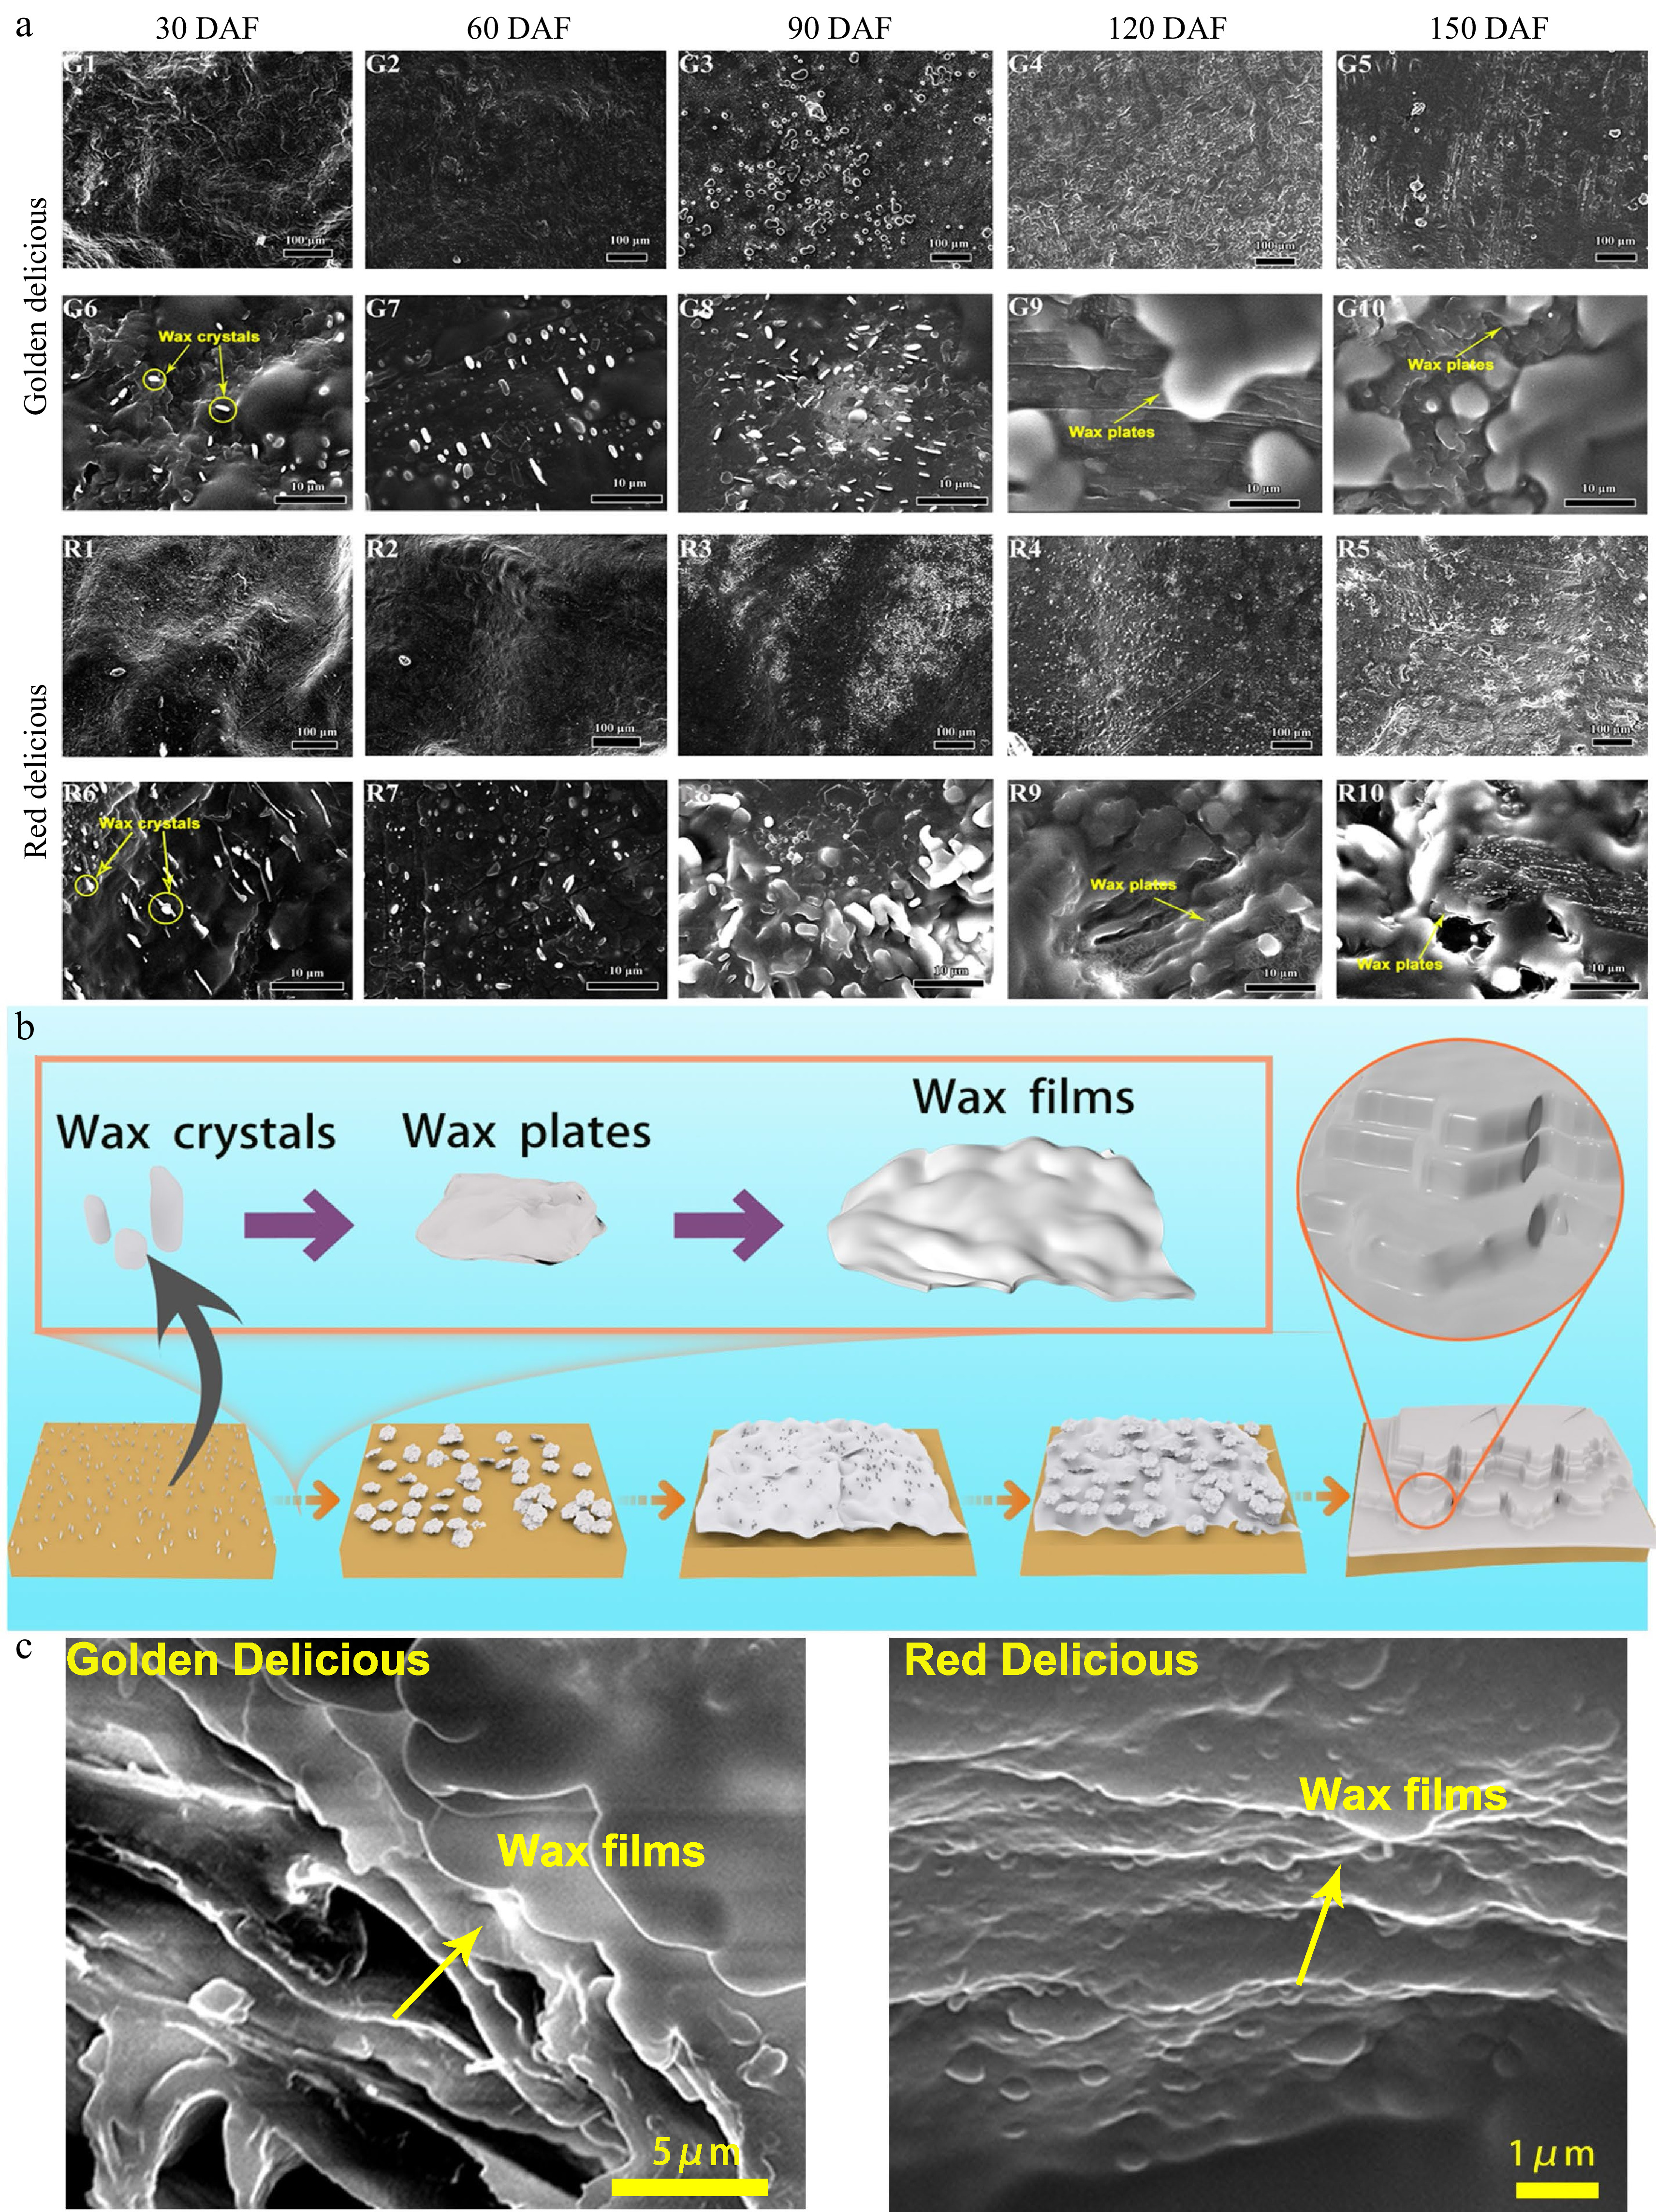
Figure 3. Changes of wax crystal in the epidermis of apple fruit during growth and development. (a) Environmental field scanning electron micrographs of the apple fruit surface. G1–G5 and R1–R5: Low magnification scanning electron microscopic observations (×150) of 'Golden Delicious' and 'Red Delicious' growing at 30, 60, 90, 120, and 150 DAF; G6–G10 and R6–R10: High magnification scanning electron microscopic observations (×2,500) of 'Golden Delicious' and 'Red Delicious' growing at 30, 60, 90, 120, and 150 DAF. (b) Diagram of wax model of apple epidermis at different growth and development stages. (c) Wax lamellar structures of 'Golden Delicious' and 'Red Delicious' apple fruit at 150 DAF.
-
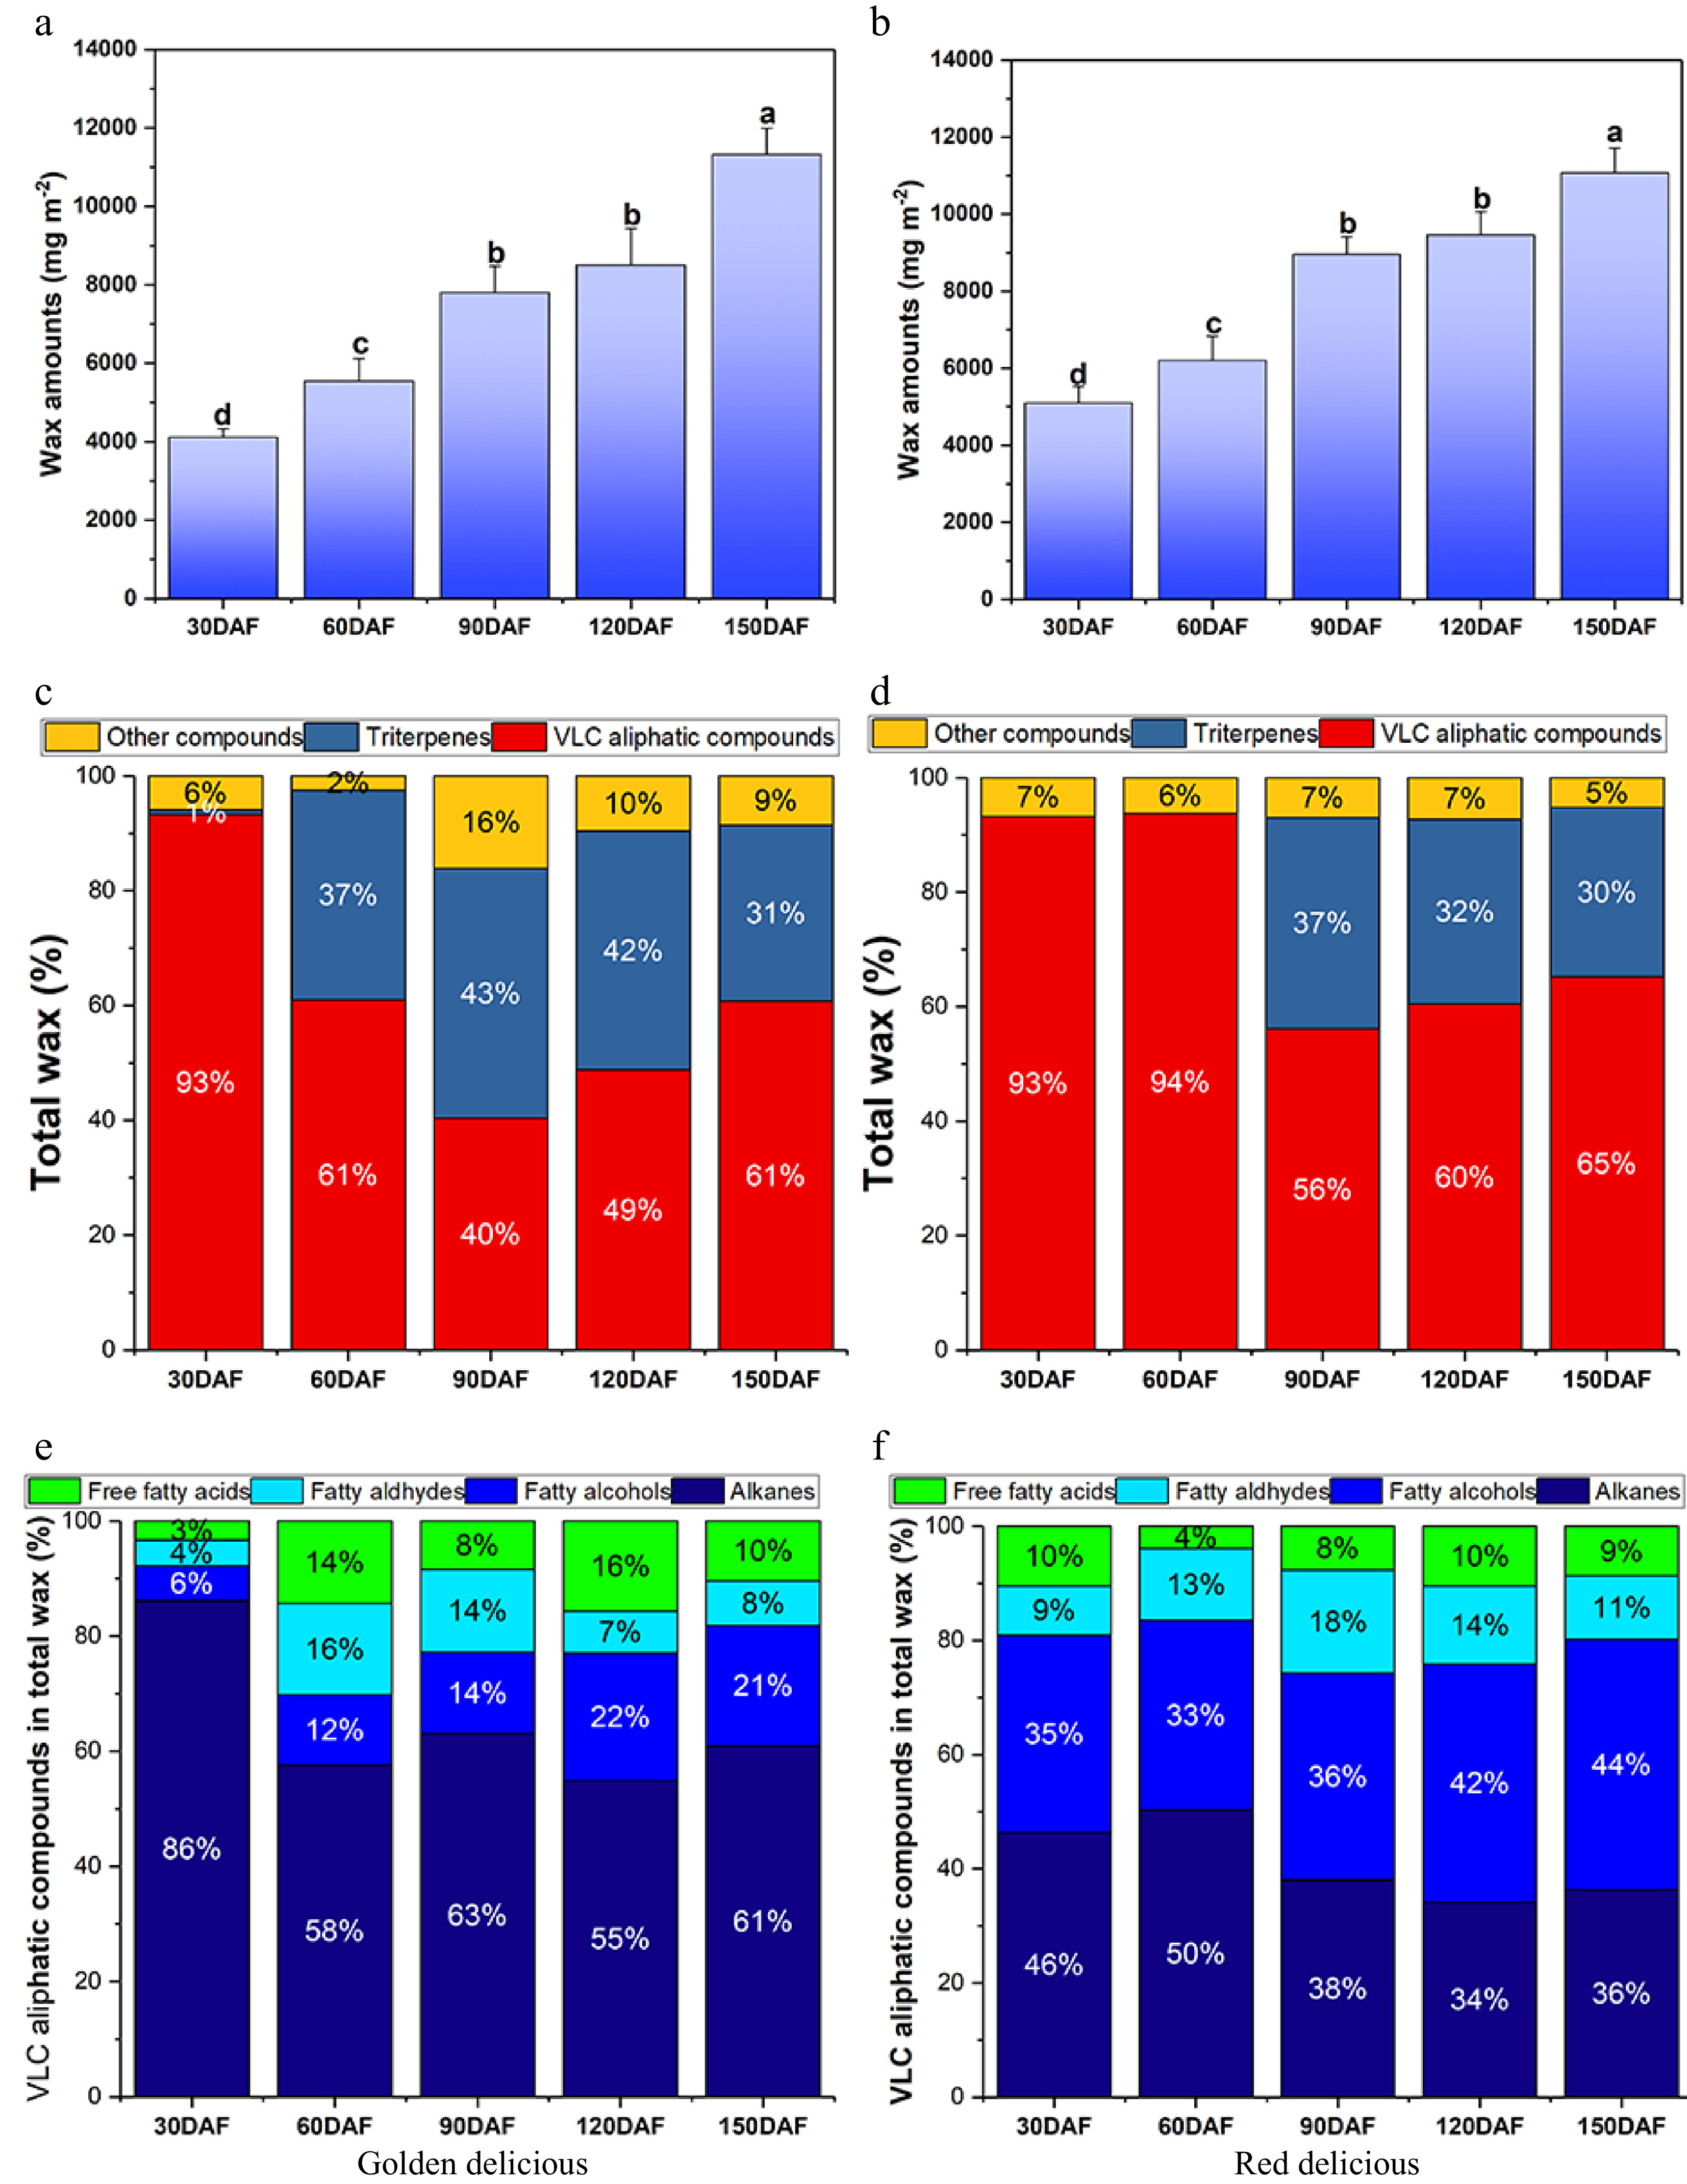
Figure 4. Wax content and chemical composition of the two apple cultivars at different developmental stages. (a), (b) Represent the total wax content per unit area of 'Golden Delicious' and 'Red Delicious' fruits, respectively. Different letters in the same fraction indicate significant differences at p ≤ 0.05 according to Duncan's new multiple range test. Each value is the mean ± standard error. (c), (d) Represent the percentage of different components in total wax of 'Golden Delicious' and 'Red Delicious' fruits. (e), (f) Represent the percentage of VLCFA derivatives of 'Golden Delicious' and 'Red Delicious' fruits.
-
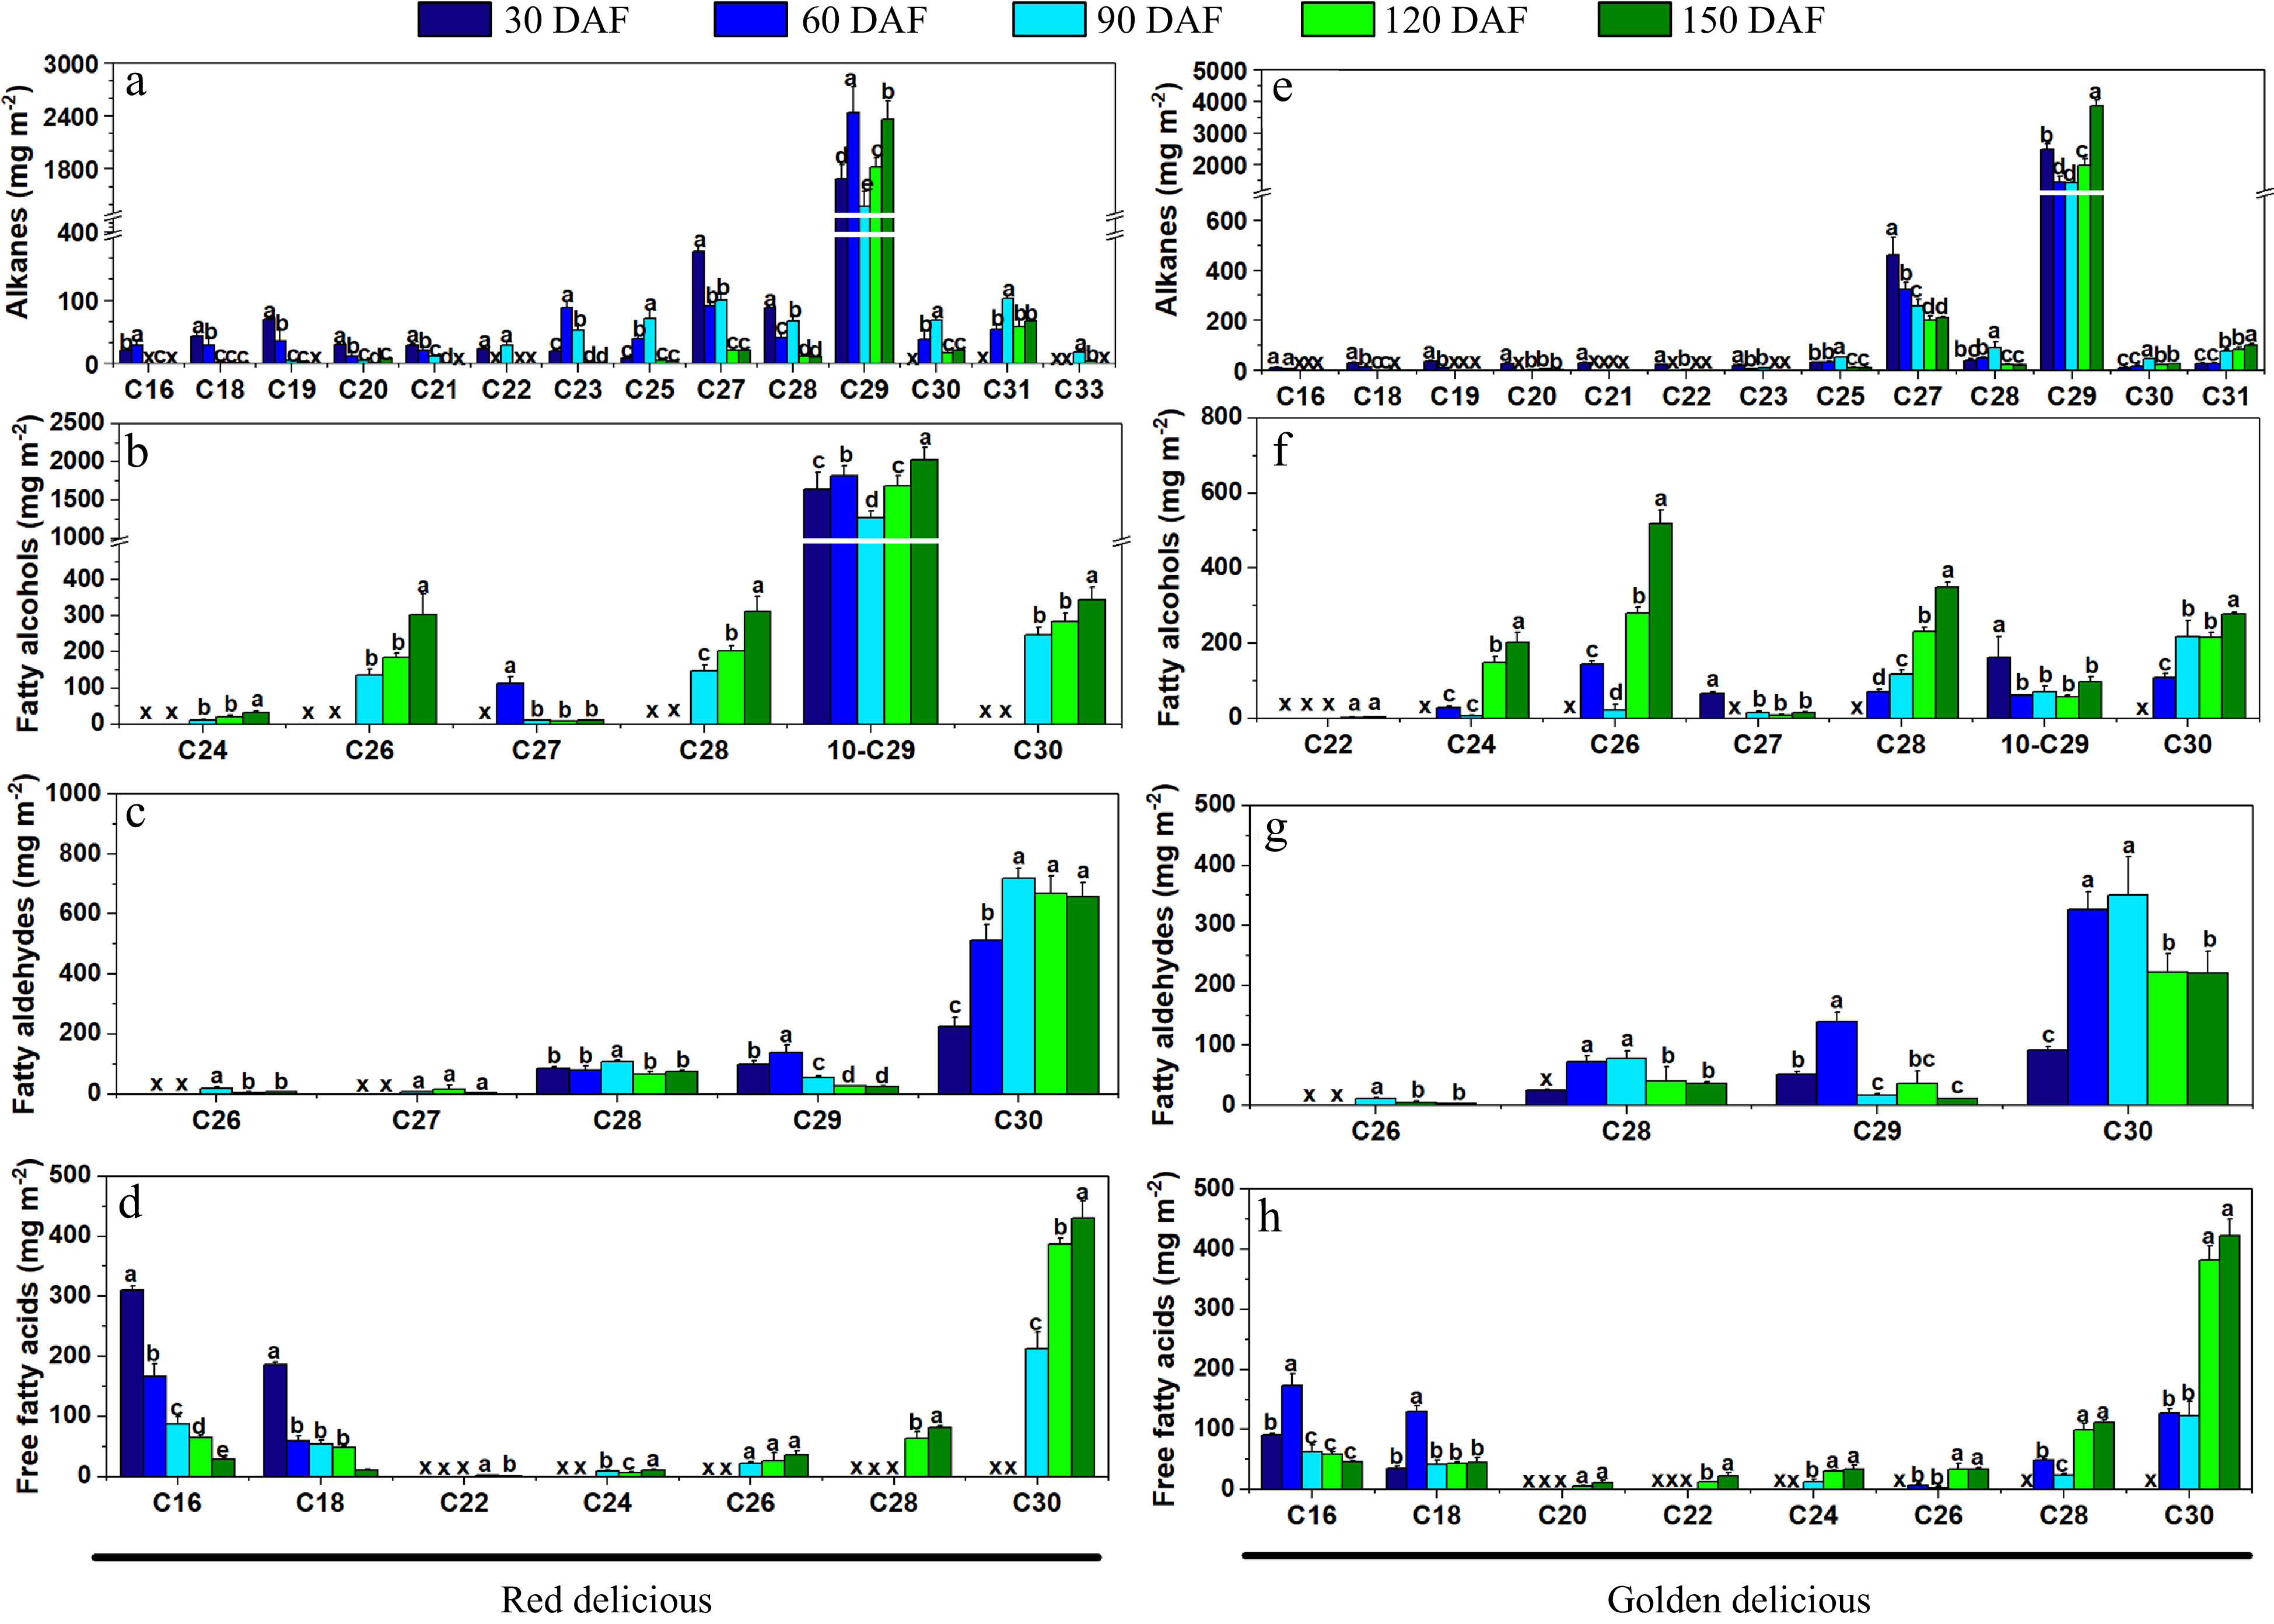
Figure 5. Concentrations of the cuticular wax composition of 'Golden Delicious' (a−d) and 'Red Delicious' (e−h) apples at growth and development. (a), (e) Alkanes. (b), (f) Fatty alcohols. (c), (g) Fatty aldehydes. (d), (h) Free fatty acids. Different letters in the same fraction indicate significant differences at p ≤ 0.05 according to Duncan's new multiple range test, x indicates that the composition is not detected. Each value is the mean ± standard error.
-
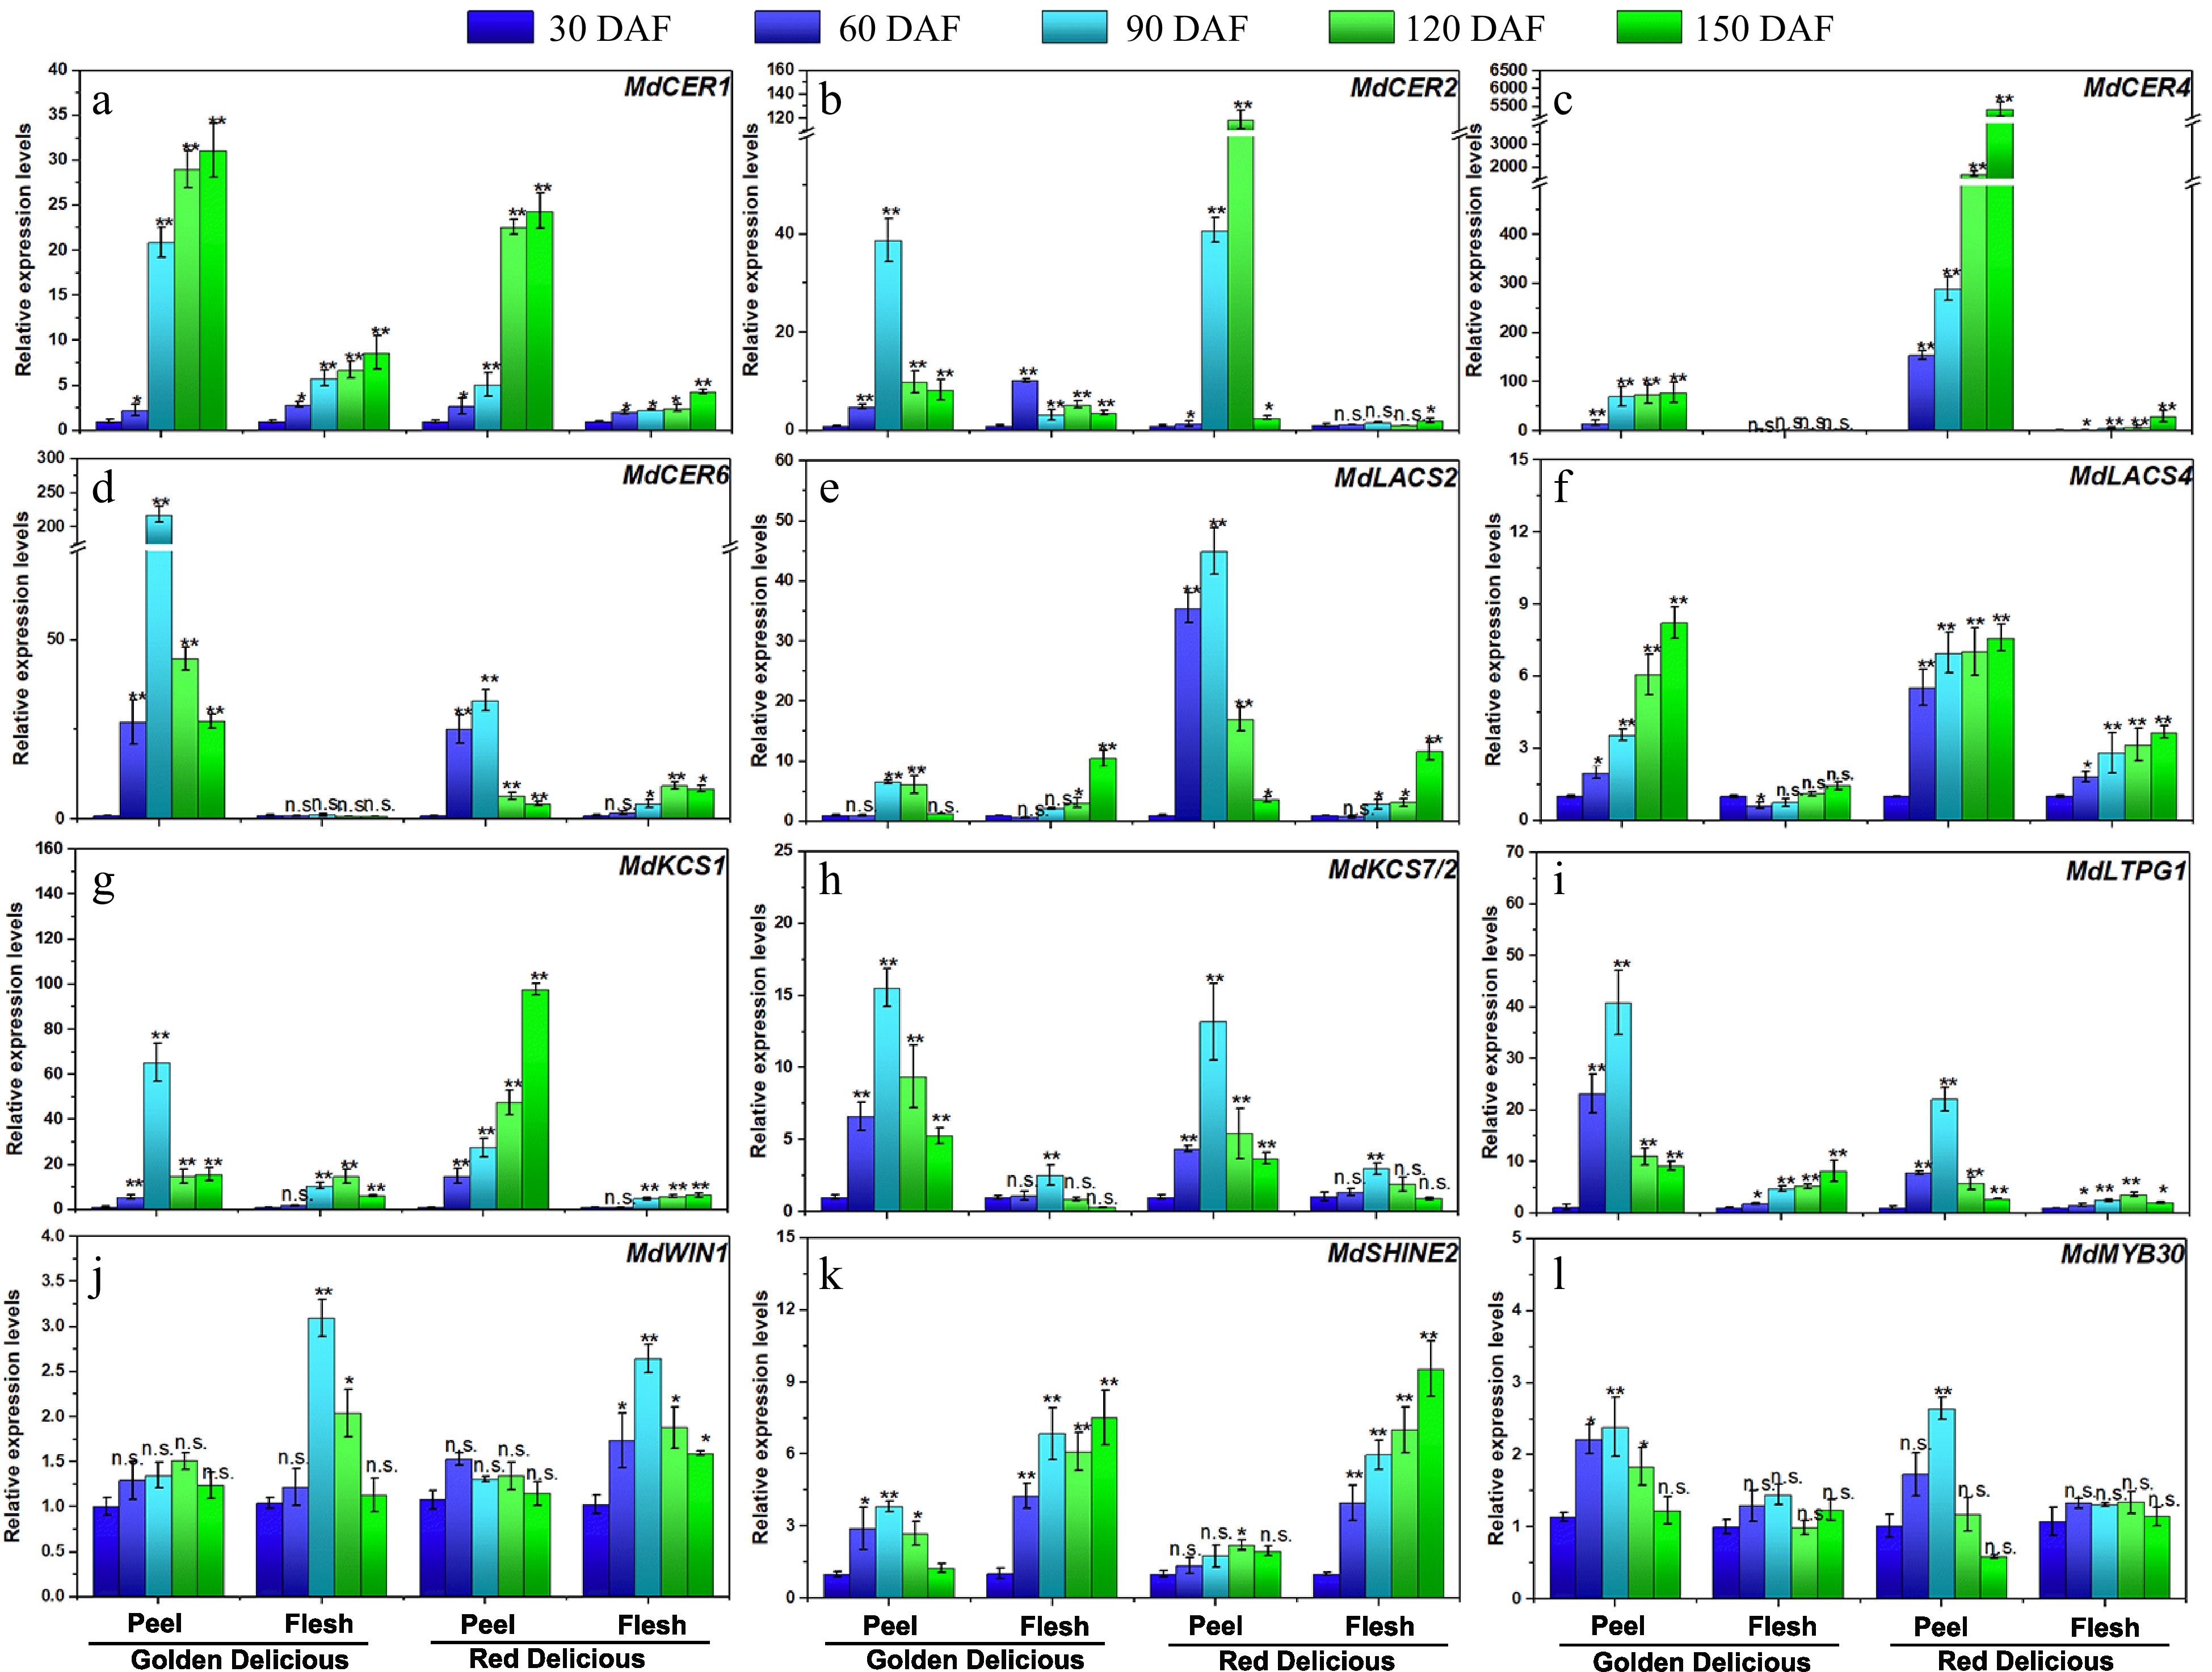
Figure 6. Expression analysis of wax-related genes at growth and development of 'Golden Delicious' and 'Red Delicious'. The asterisks indicate a statistically significant difference (two-tailed Student's t-test, * p ≤ 0.05, ** p ≤ 0.01). n.s. represent no significant difference (p > 0.05). The columns and bars represent the mean and standard error, respectively (n = 3).
Figures
(6)
Tables
(0)