-
Figure 1.
The chemical formula of AQ.
-
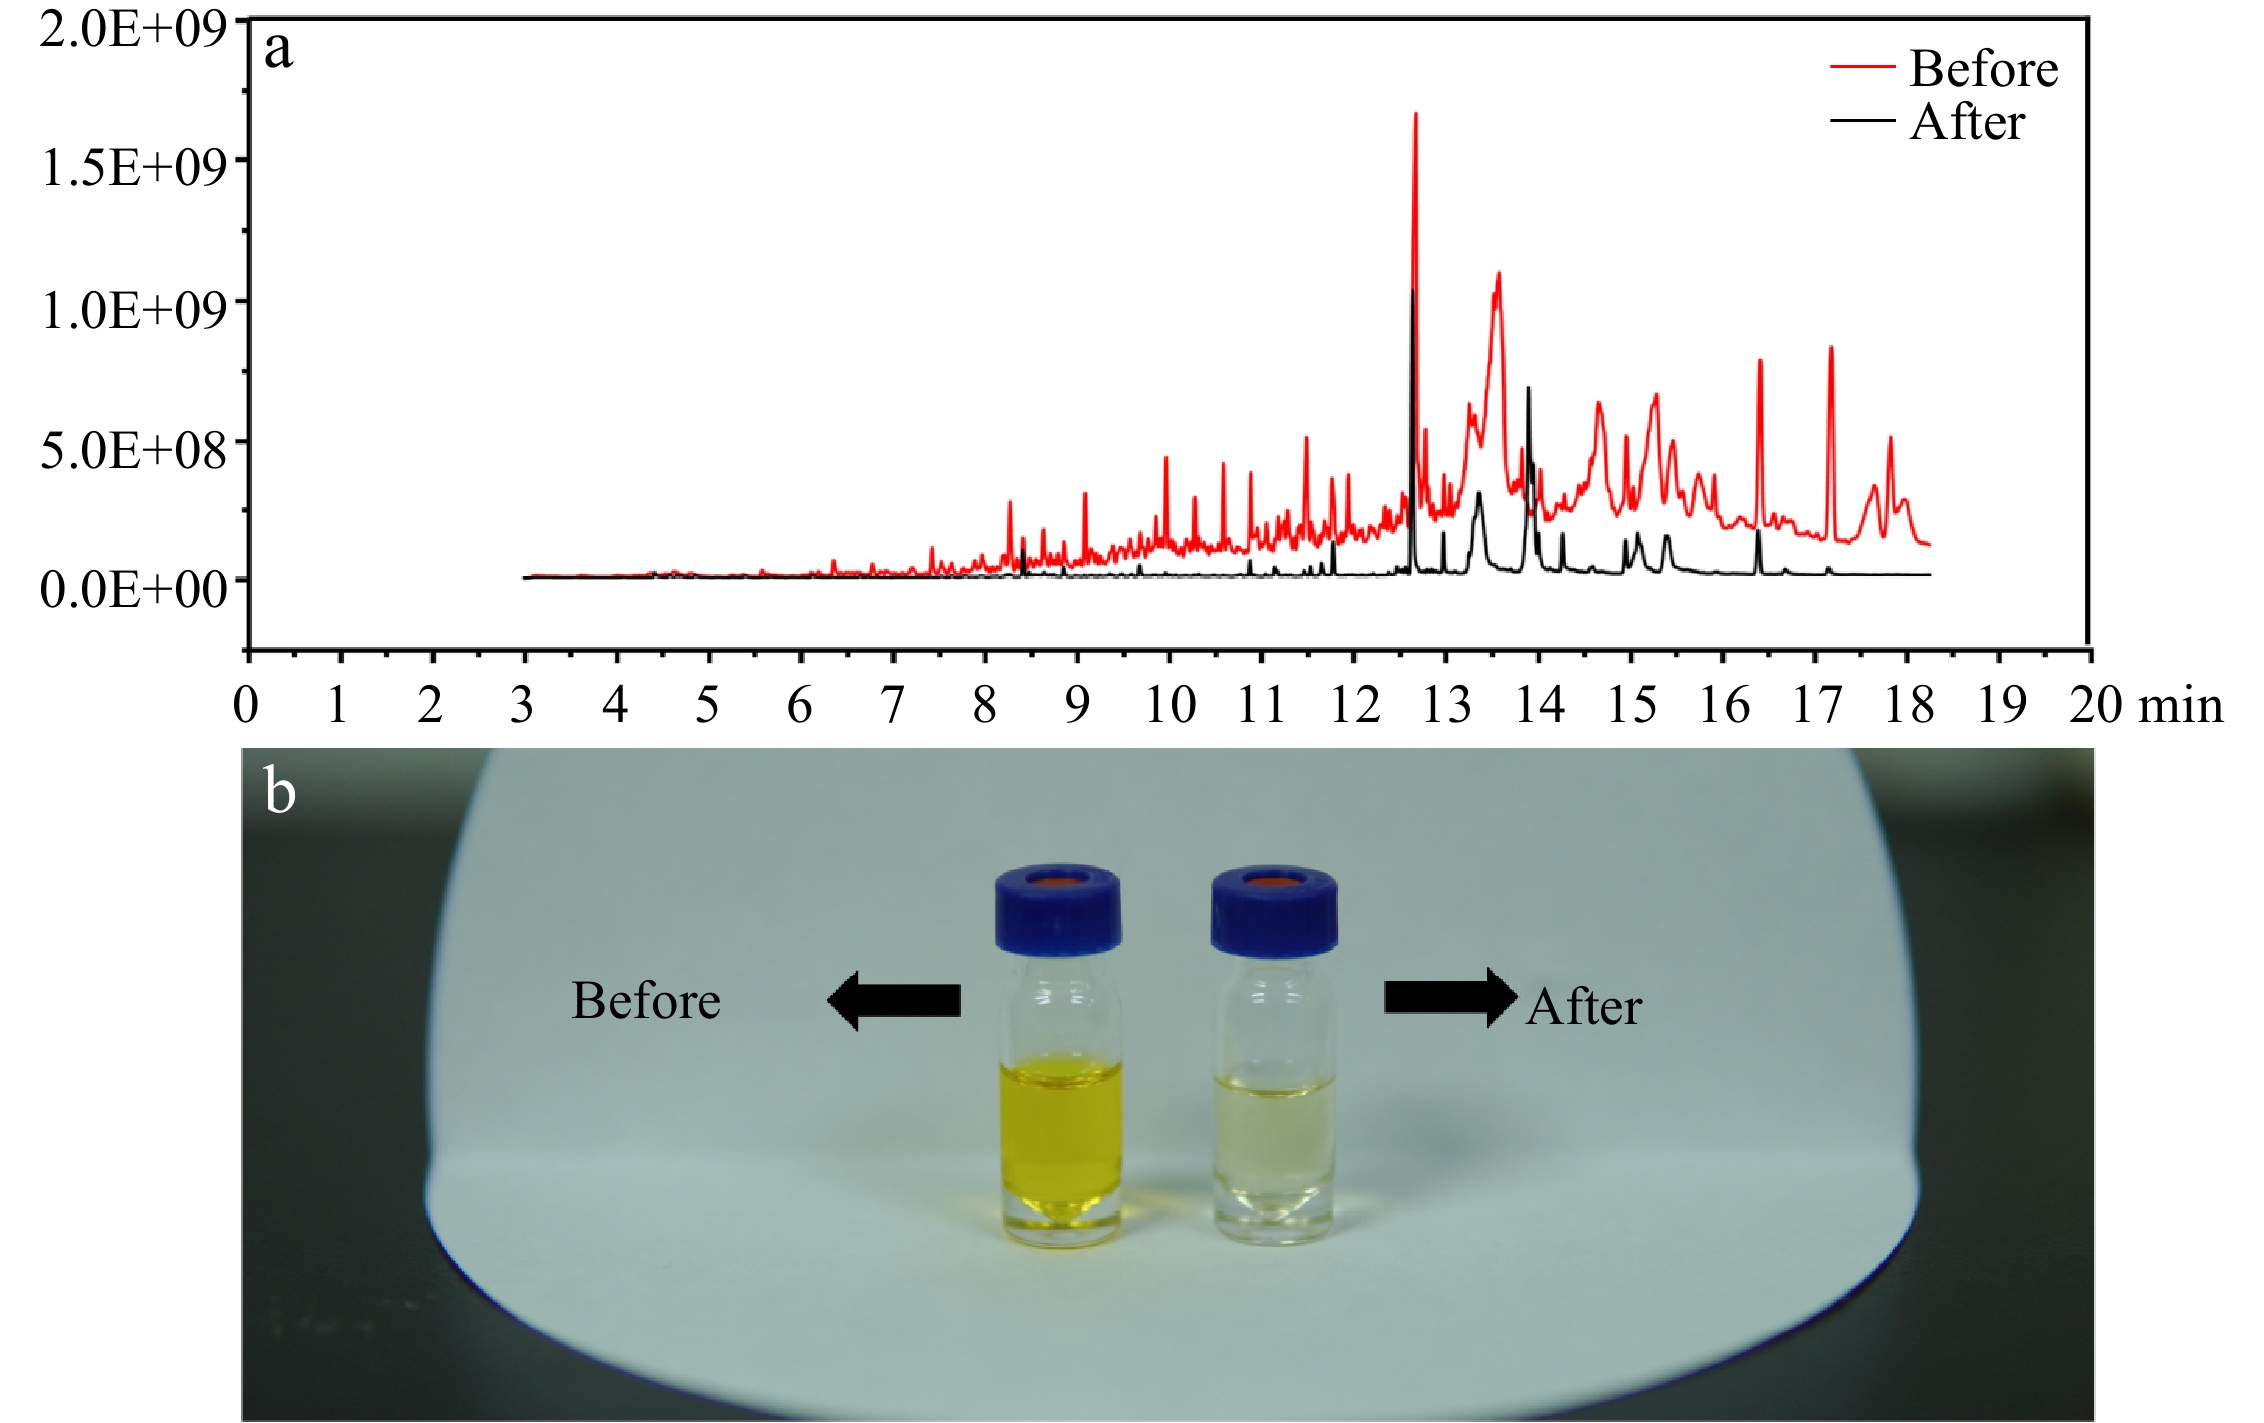
Figure 2.
(a) Full scan spectrum of the sample before and after the purification. (b) The purification effect of the improved method.
-
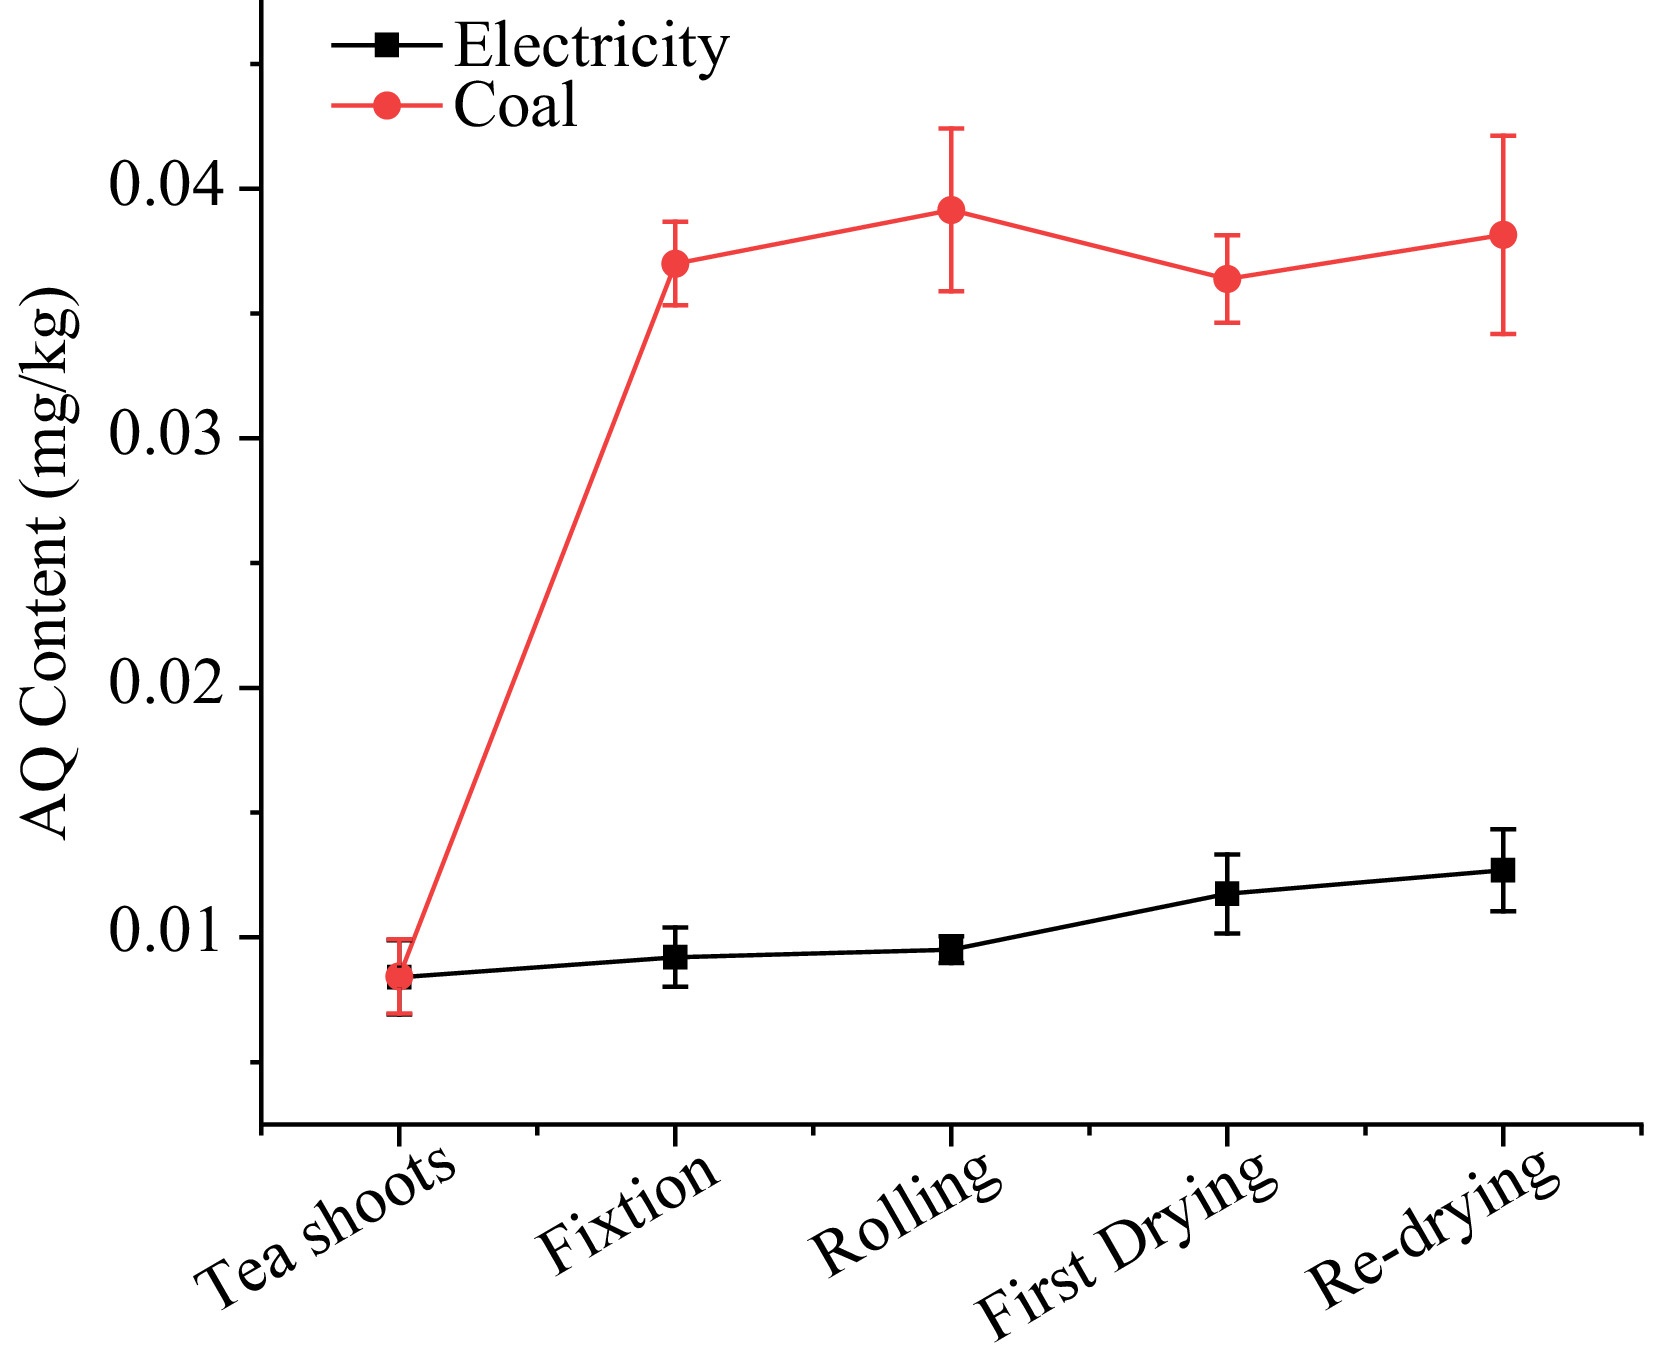
Figure 3.
The AQ level during green tea processing with electricity and coal as heat sources.
-
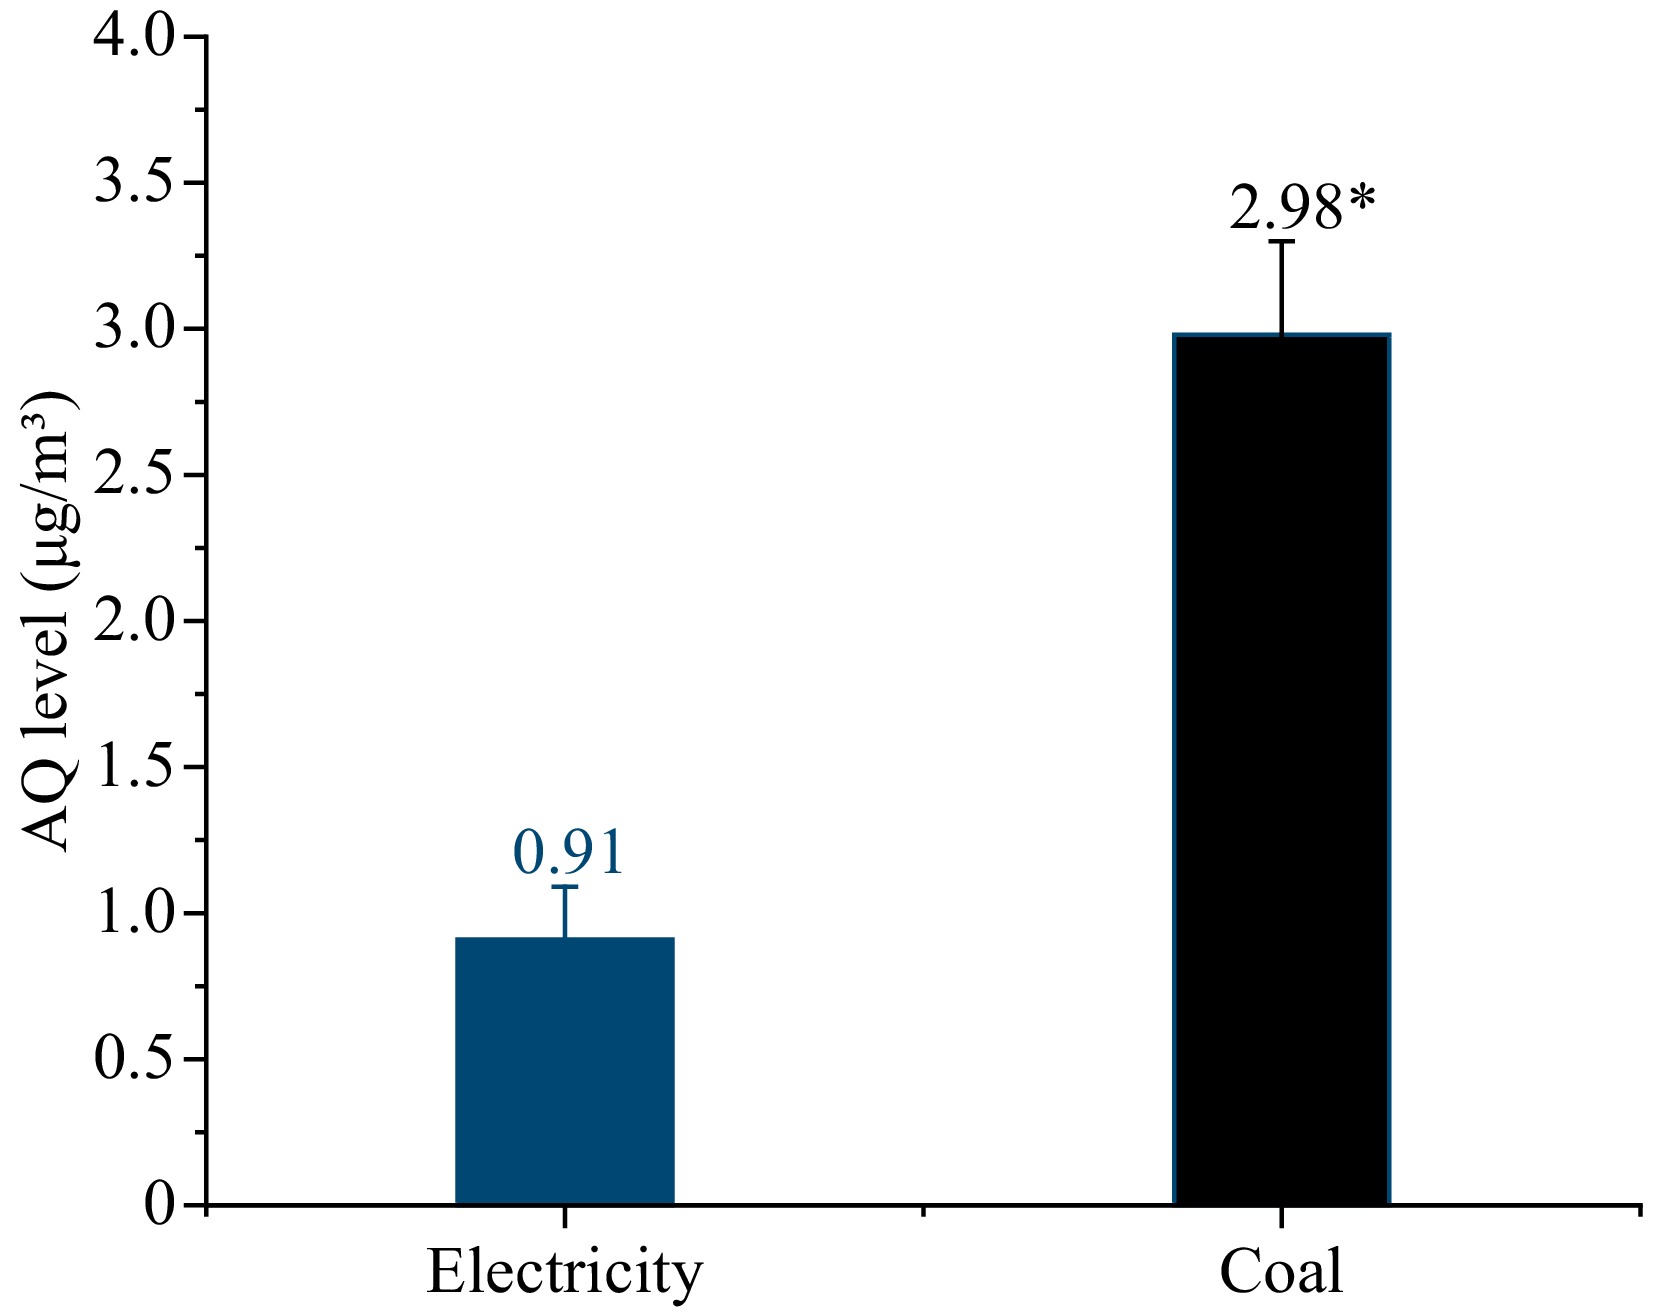
Figure 4.
The levels of AQ in the environment with electricity and coal as heat source. * Indicates significant differences in AQ levels in the samples (p < 0.05).
-
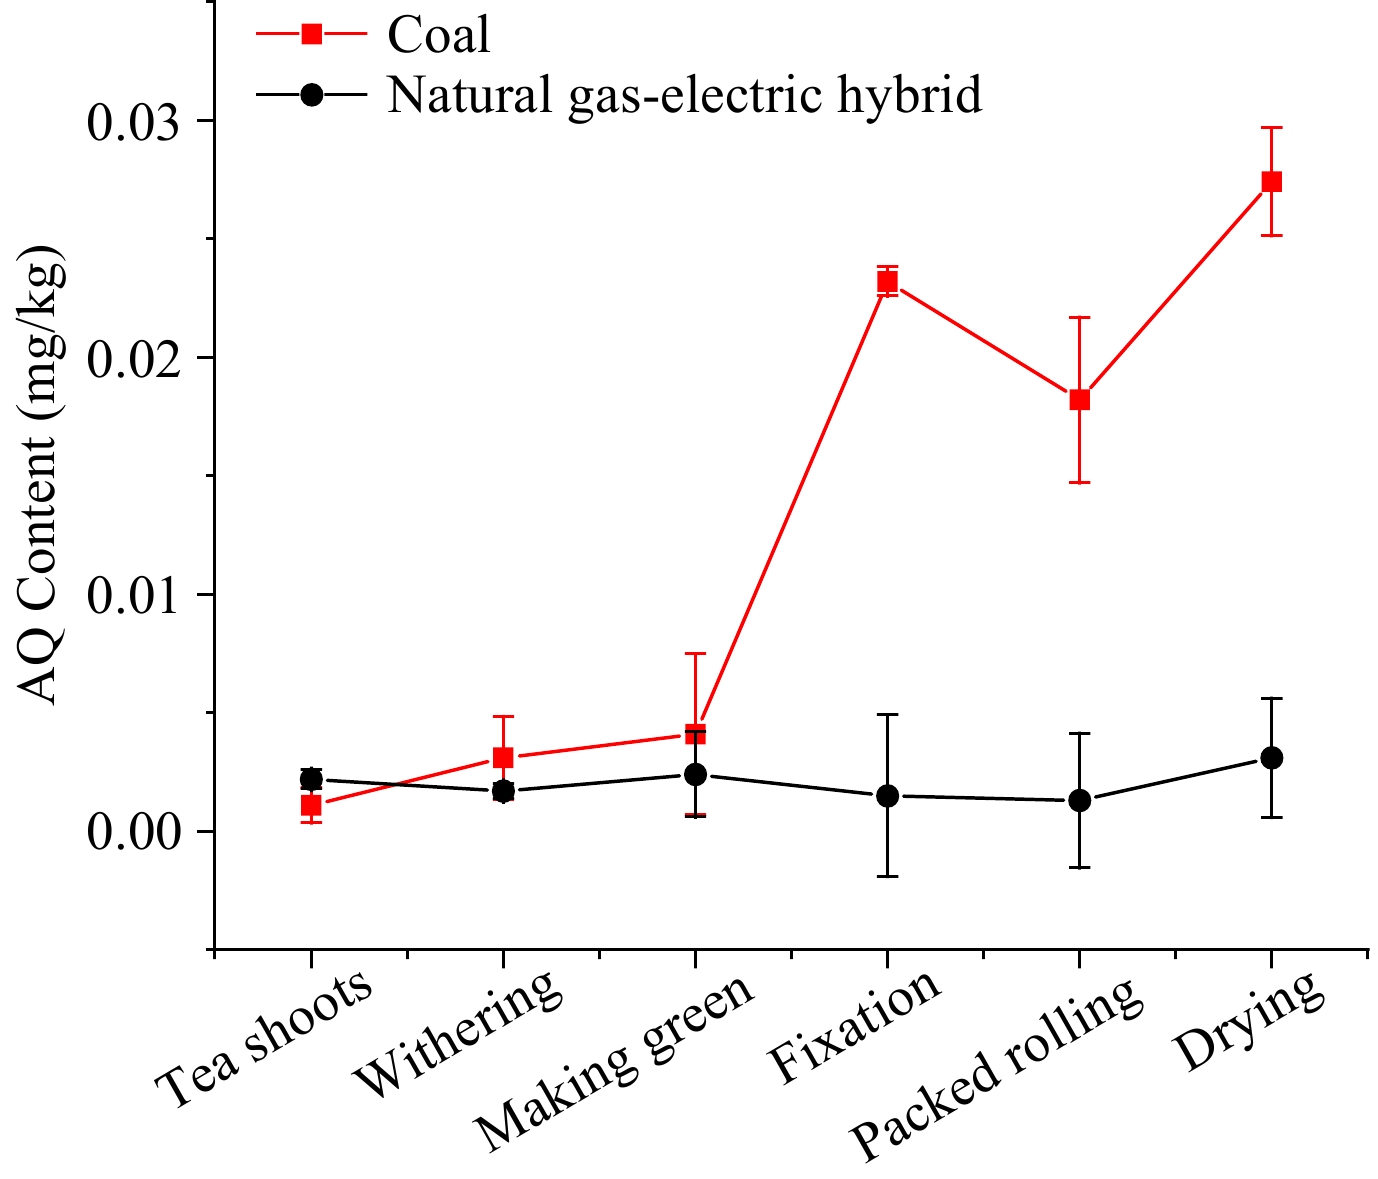
Figure 5.
The AQ level during oolong tea processing with natural gas-electric blend and coal as heat source.
-
Martrix Fortified level
(mg/kg)Recovery
(%, SD)RSD
n = 5LOQ
(mg/kg)r2 (range g/L) ME (%) Tea shoots 0.005 125.7 ± 8.6 6.9 0.005 0.999 (5−200) 10.9 0.01 96.5 ± 5.7 5.9 0.02 87.4 ± 6.4 7.3 Dry tea 0.005 77.8 ± 9.7 12.5 0.005 0.998 (5−200) 9.0 0.02 113.0 ± 3.2 3.6 0.005 107.6 ± 1.4 1.5 Air sample 0.5a 117.06 ± 9.4 10.8 0.5a 0.999 (0.5−8) 196.1 1.5 78.47 ± 4.0 5.1 3.0 105.07 ± 14.8 14.1 a: µg/m3 Table 1.
Validated parameters of AQ in spiked samples.
-
Total samples
analyzedNumber of detective
samplesRates of
detection (%)Number of samples
exceeded MRLRates of
exceedance (%)Min
(mg/kg)Max
(mg/kg)Electricity 20 10 50.0 1 5.0 ND 0.020 Coal 20 17 85.0 7 35.0 ND 0.064 Table 2.
The occurrence for AQ in tea products with different heat sources.
-
Equipment Compound TR (min) Parent ion (m/z) Daughter ion (m/z) Collision energy Vairan 450GC-300MS 9,10-anthraquinone 13.02 208 152 22 180 10 D8-anthraquinone 12.99 216 160 20 188 10 Agilent 8890GC-7000DMS 9,10-anthraquinone 12.15 208 152 30 180 10 D8-anthraquinone 12.19 216 160 30 188 10 Table 3.
MRM conditions of 9,10-anthraquinone and D8-anthraquinone.
Figures
(5)
Tables
(3)