-
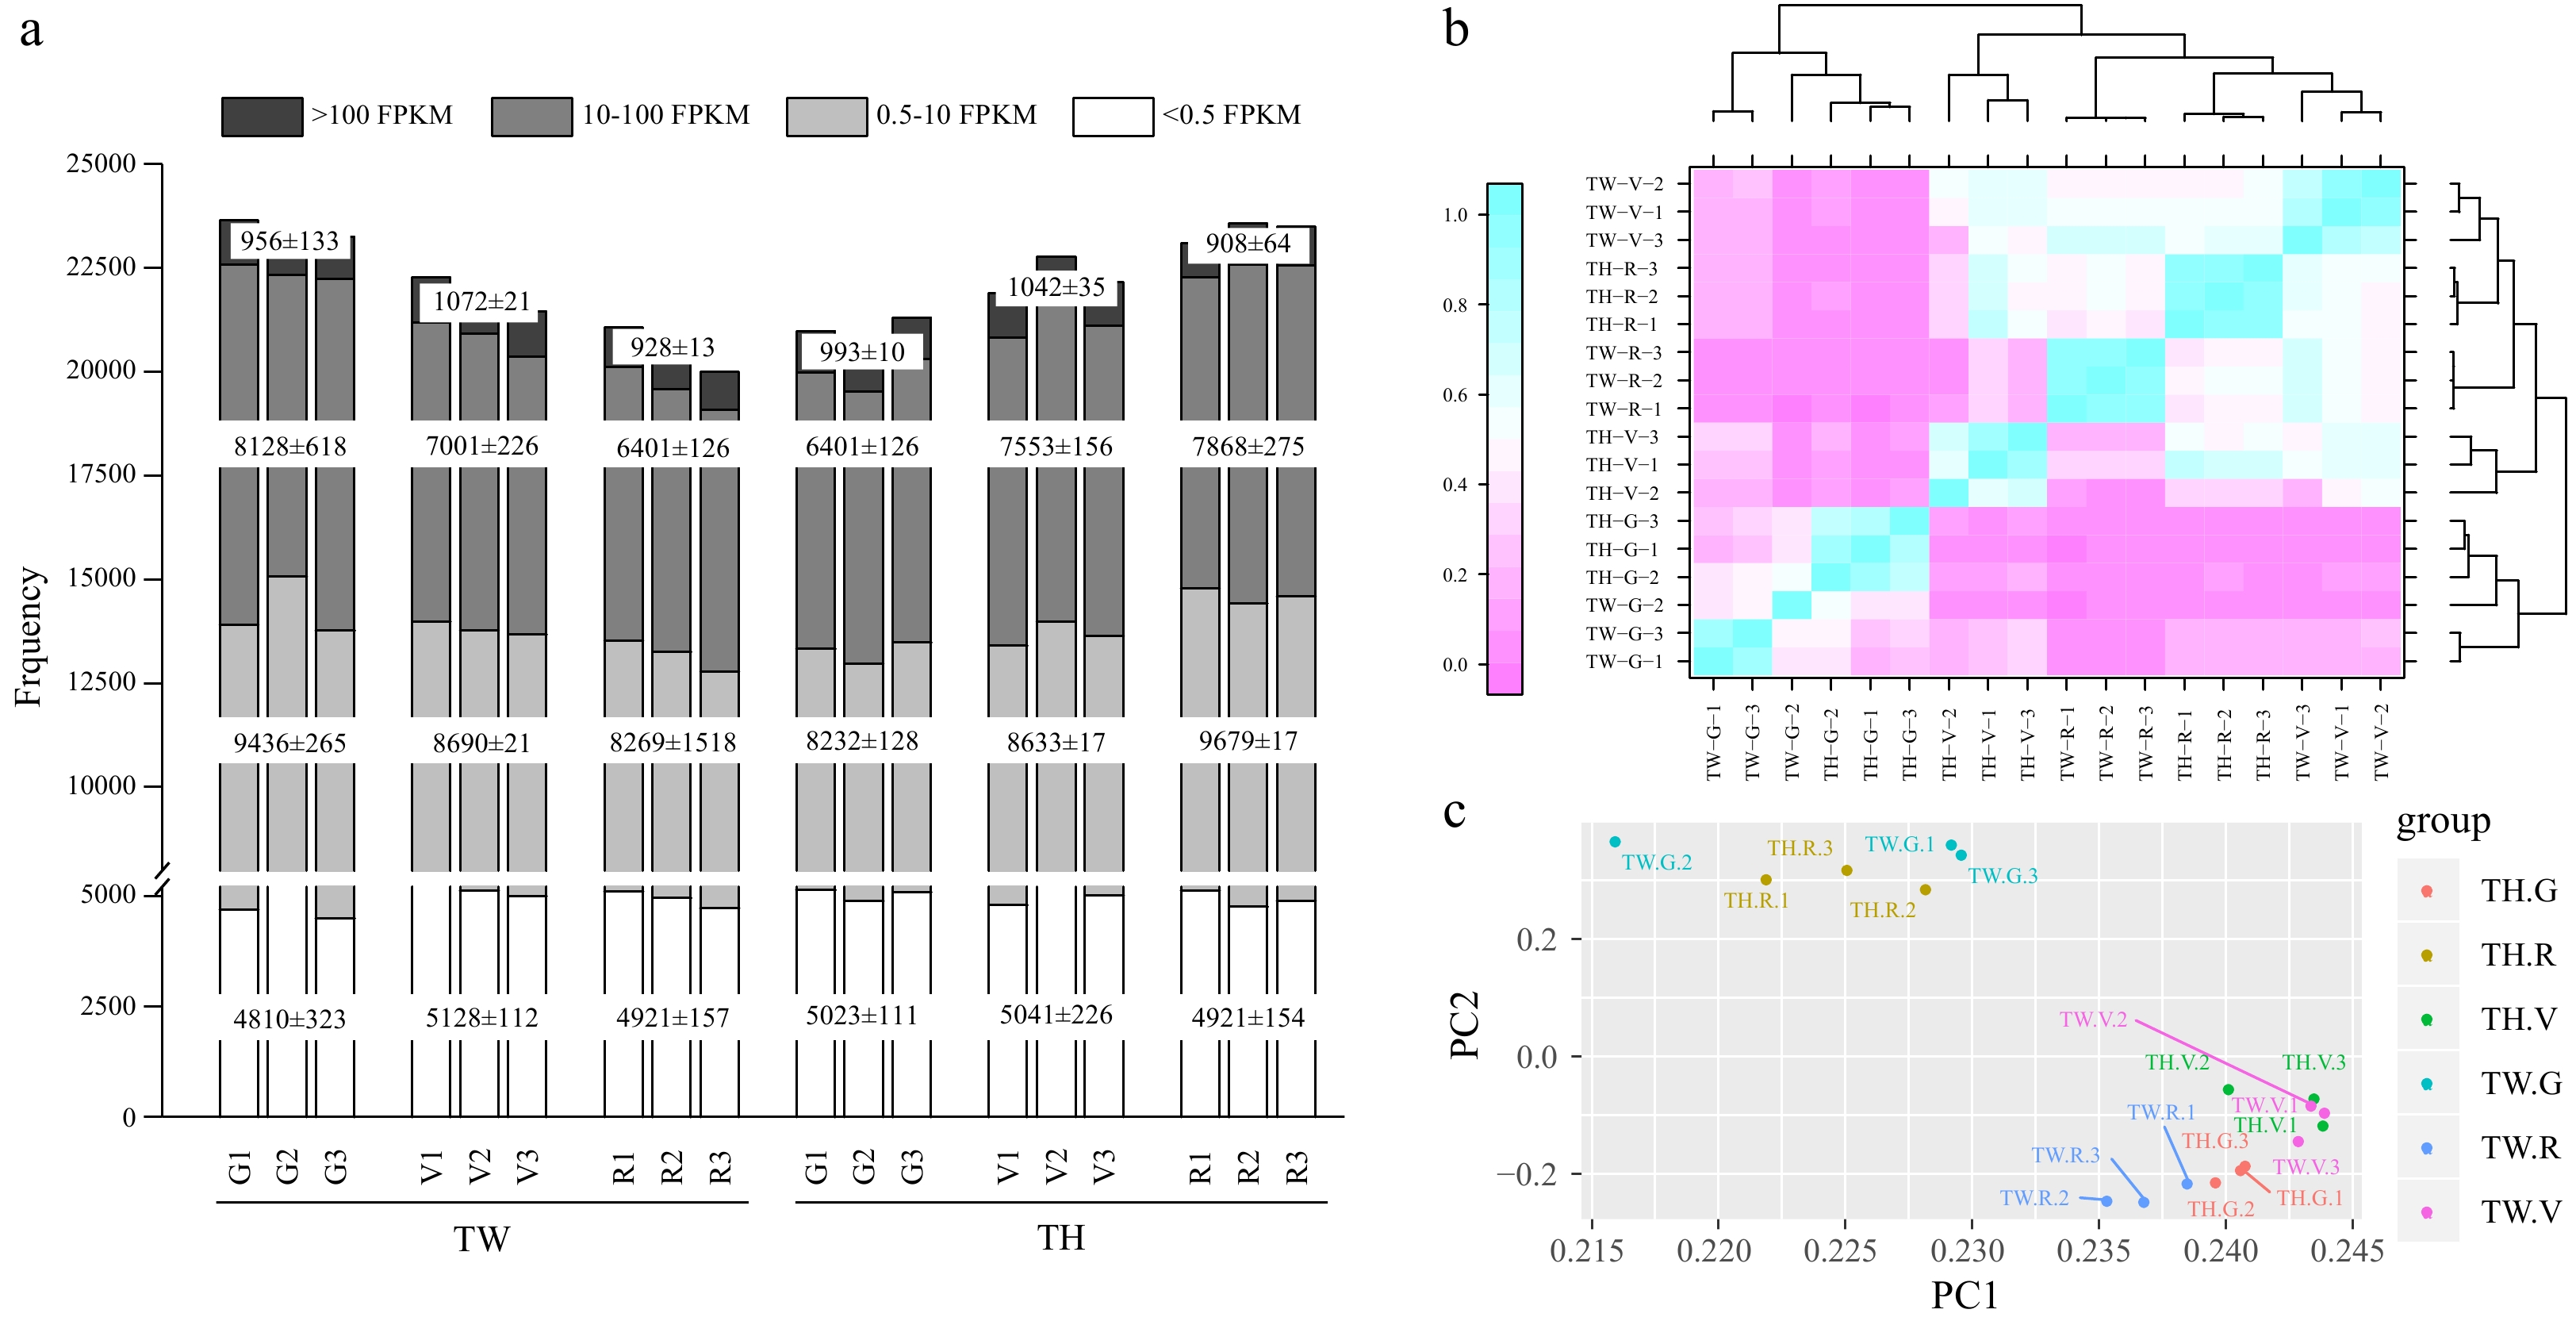
Figure 1. Properties of transcriptome data of 'Tangwei' (TW) and 'Tonghua-3' (TH) berry at green hard (G), véraison (V), and ripe (R) stages. (a) Total numbers of expressed genes with fragments per kilobase of transcript per million fragments mapped (FPKM) values; (b) Heatmap of the sample correlation analysis; (c) Principal component analysis (PCA) showing clustering pattern among TW and TH at G, V and R samples based on global gene expression profiles.
-
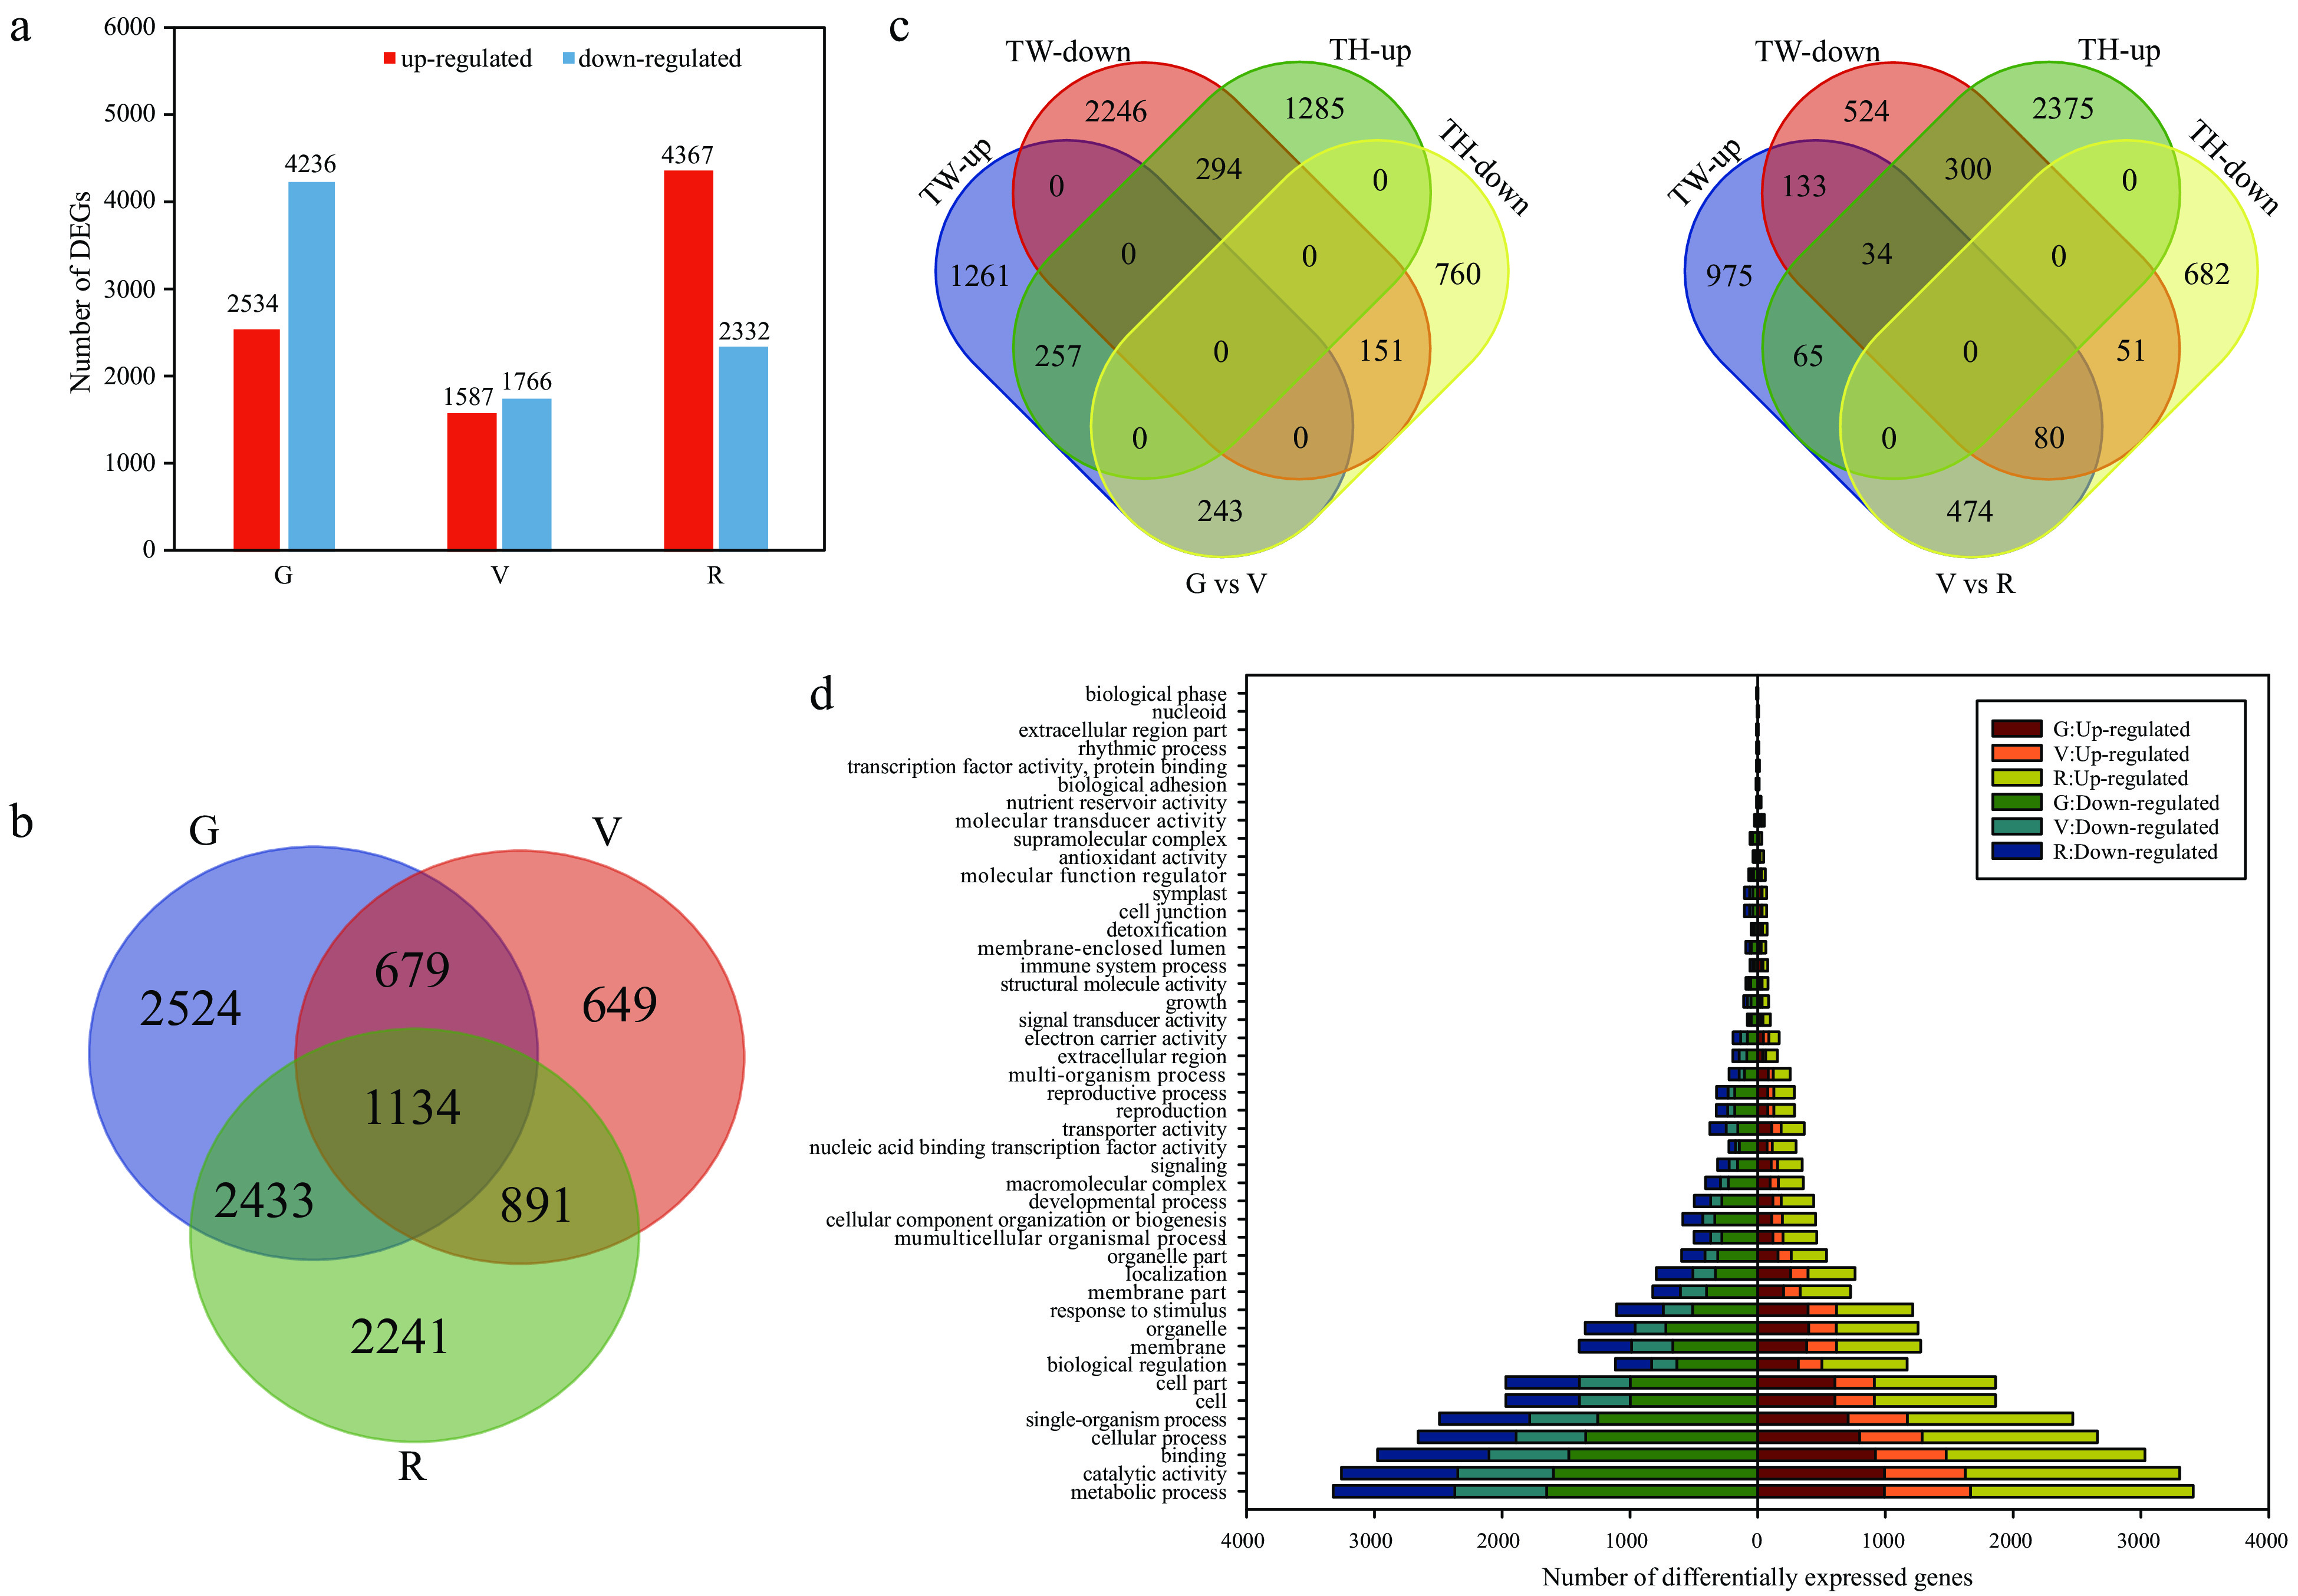
Figure 2. Analysis of differentially expressed genes (DEGs) at the green hard (G), véraison (V), and ripe (R) stages in 'Tangwei' (TW) and 'Tonghua-3' (TH). (a) Number of DEGs and (b) numbers of overlapping DEGs between 'Tangwei' and 'Tonghua-3' at G, V and R; (c) Overlap among DEGs between G and V, and V and R, for 'Tangwei' and 'Tonghua-3'; (d) Gene ontology (GO) functional categorization of DEGs.
-
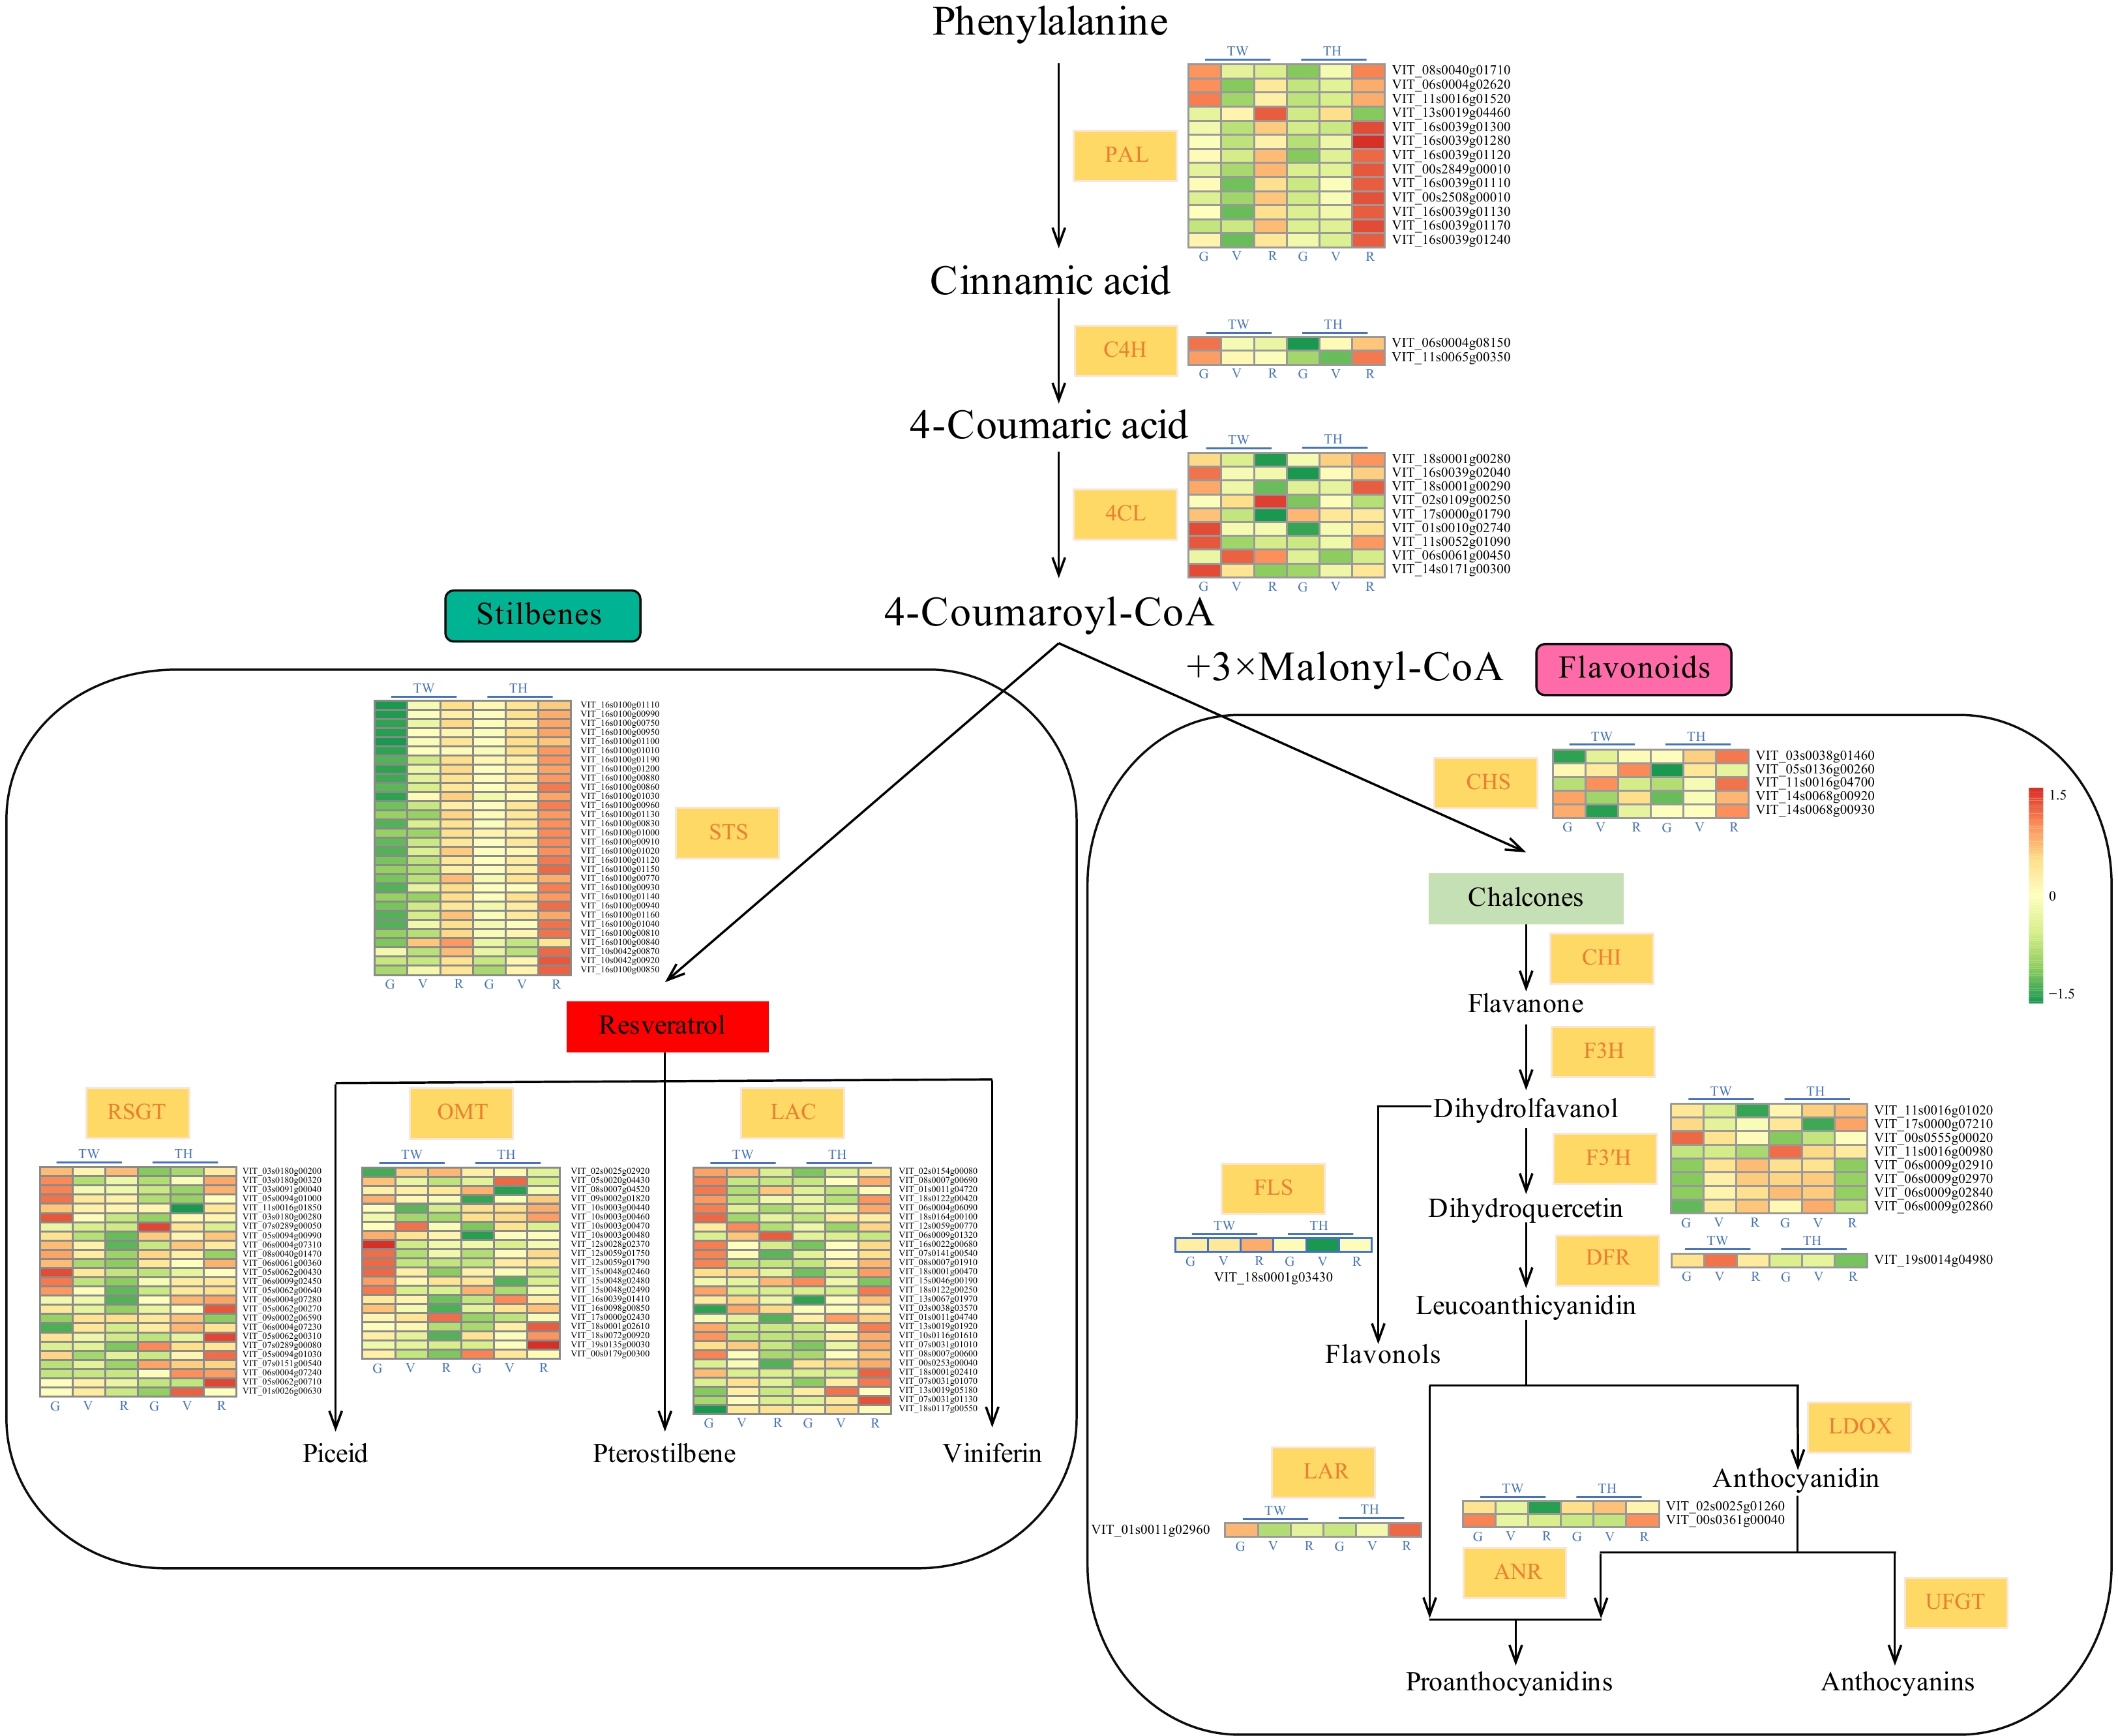
Figure 3. Expression of differentially expressed genes (DEGs) associated with phenylalanine metabolism. TW, 'Tangwei'; TH, 'Tonghua-3'. PAL, PHENYLALANINE AMMONIA LYASE; C4H, CINNAMATE 4-HYDROXYLASE; 4CL, 4-COUMARATE-COA LIGASE; STS, STILBENE SYNTHASE; RSGT, RESVERATROL GLUCOSYLTRANSFERASE; OMT, O-METHYLTRANSFERASE; LAC, LACCASE; CHS, CHALCONE SYNTHASE; CHI, CHALCONE ISOMERASE; F3H, FLAVANONE 3-HYDROXYLASE; FLS, FLAVONOL SYNTHASE; F3'H, FLAVONOID 3′-HYDROXYLASE; DFR, DIHYDROFLAVONOL 4-REDUCTASE; LAR, LEUCOANTHOCYANIDIN REDUCTASE; ANR, ANTHOCYANIDIN REDUCTASE; LDOX, LEUCOANTHOCYANIDIN DIOXYGENASE; UFGT, UDP-GLUCOSE: FLAVONOID 3-O-GLUCOSYLTRANSFERASE.
-
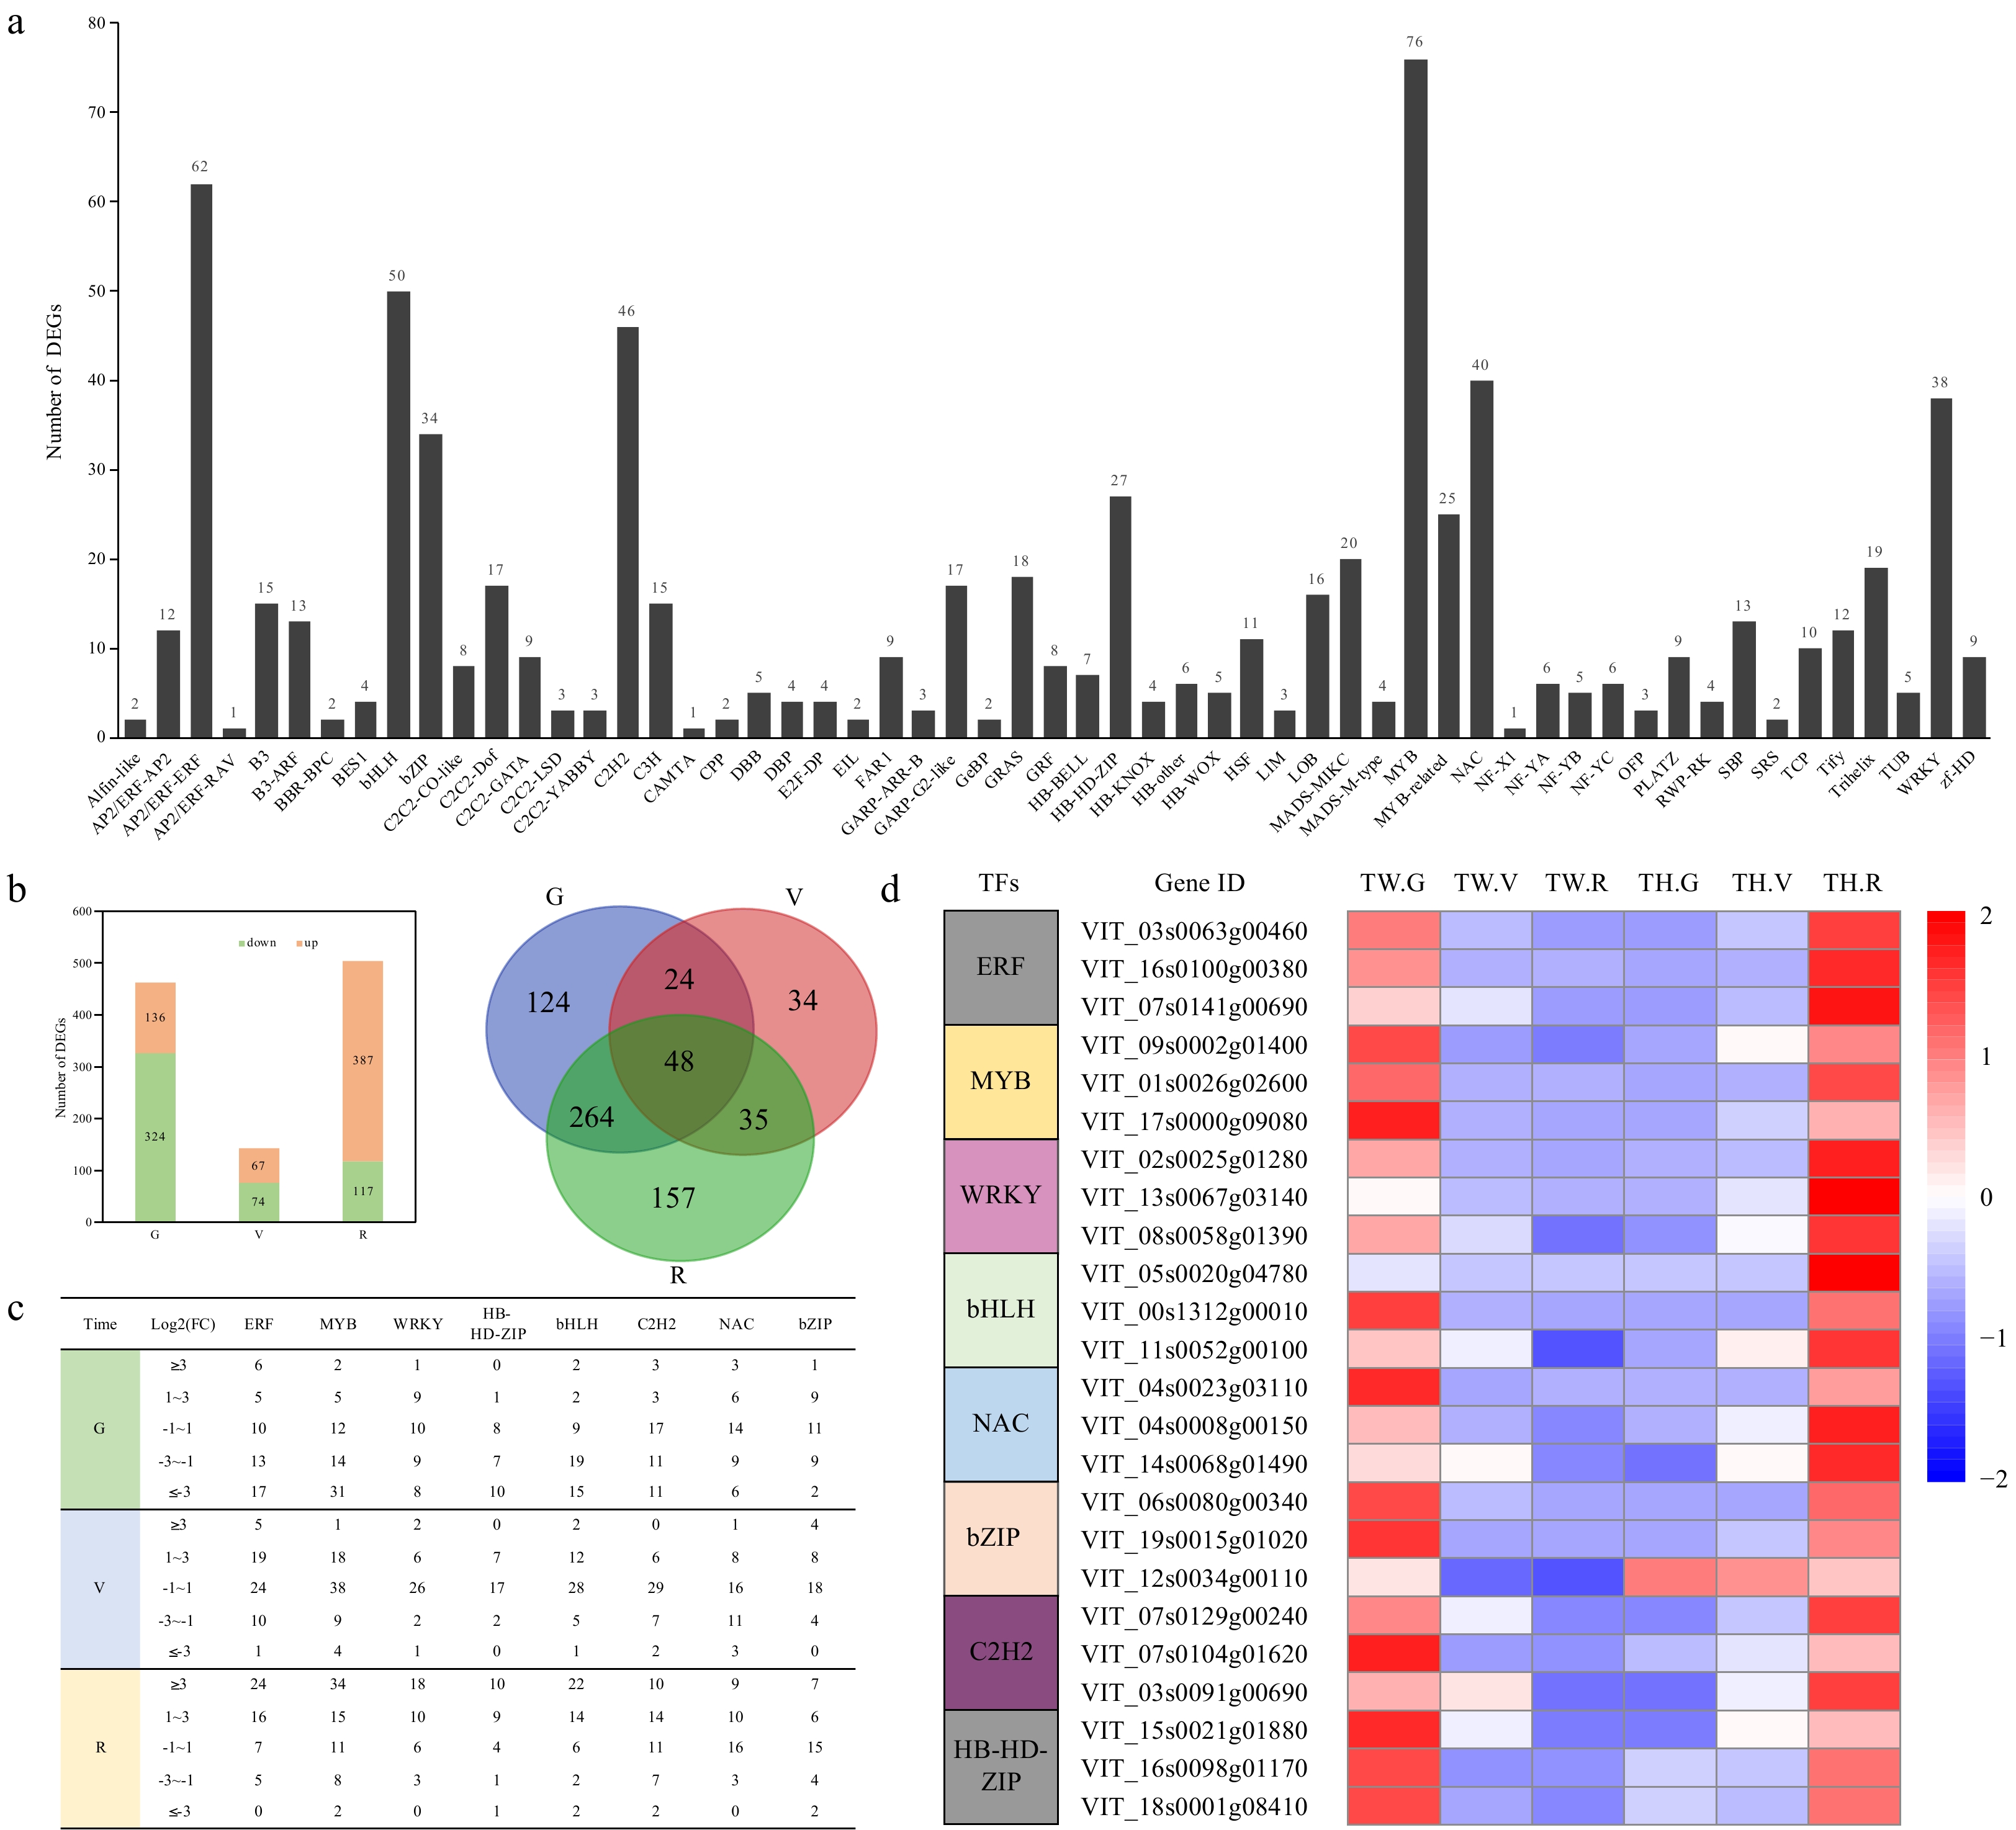
Figure 4. Differentially expressed transcription factor (TF) genes. (a) The number of differentially expressed genes (DEGs) in different TF families; (b) Number of differentially expressed TF genes, numbers of overlapping differentially expressed TF genes, and (c) categorization of expression fold change (FC) for members of eight TF families between 'Tangwei' and 'Tonghua-3' at green hard (G), véraison (V), and ripe (R) stages; (d) Heatmap expression profiles of the three most strongly differentially expressed TF genes from each of eight TF families.
-
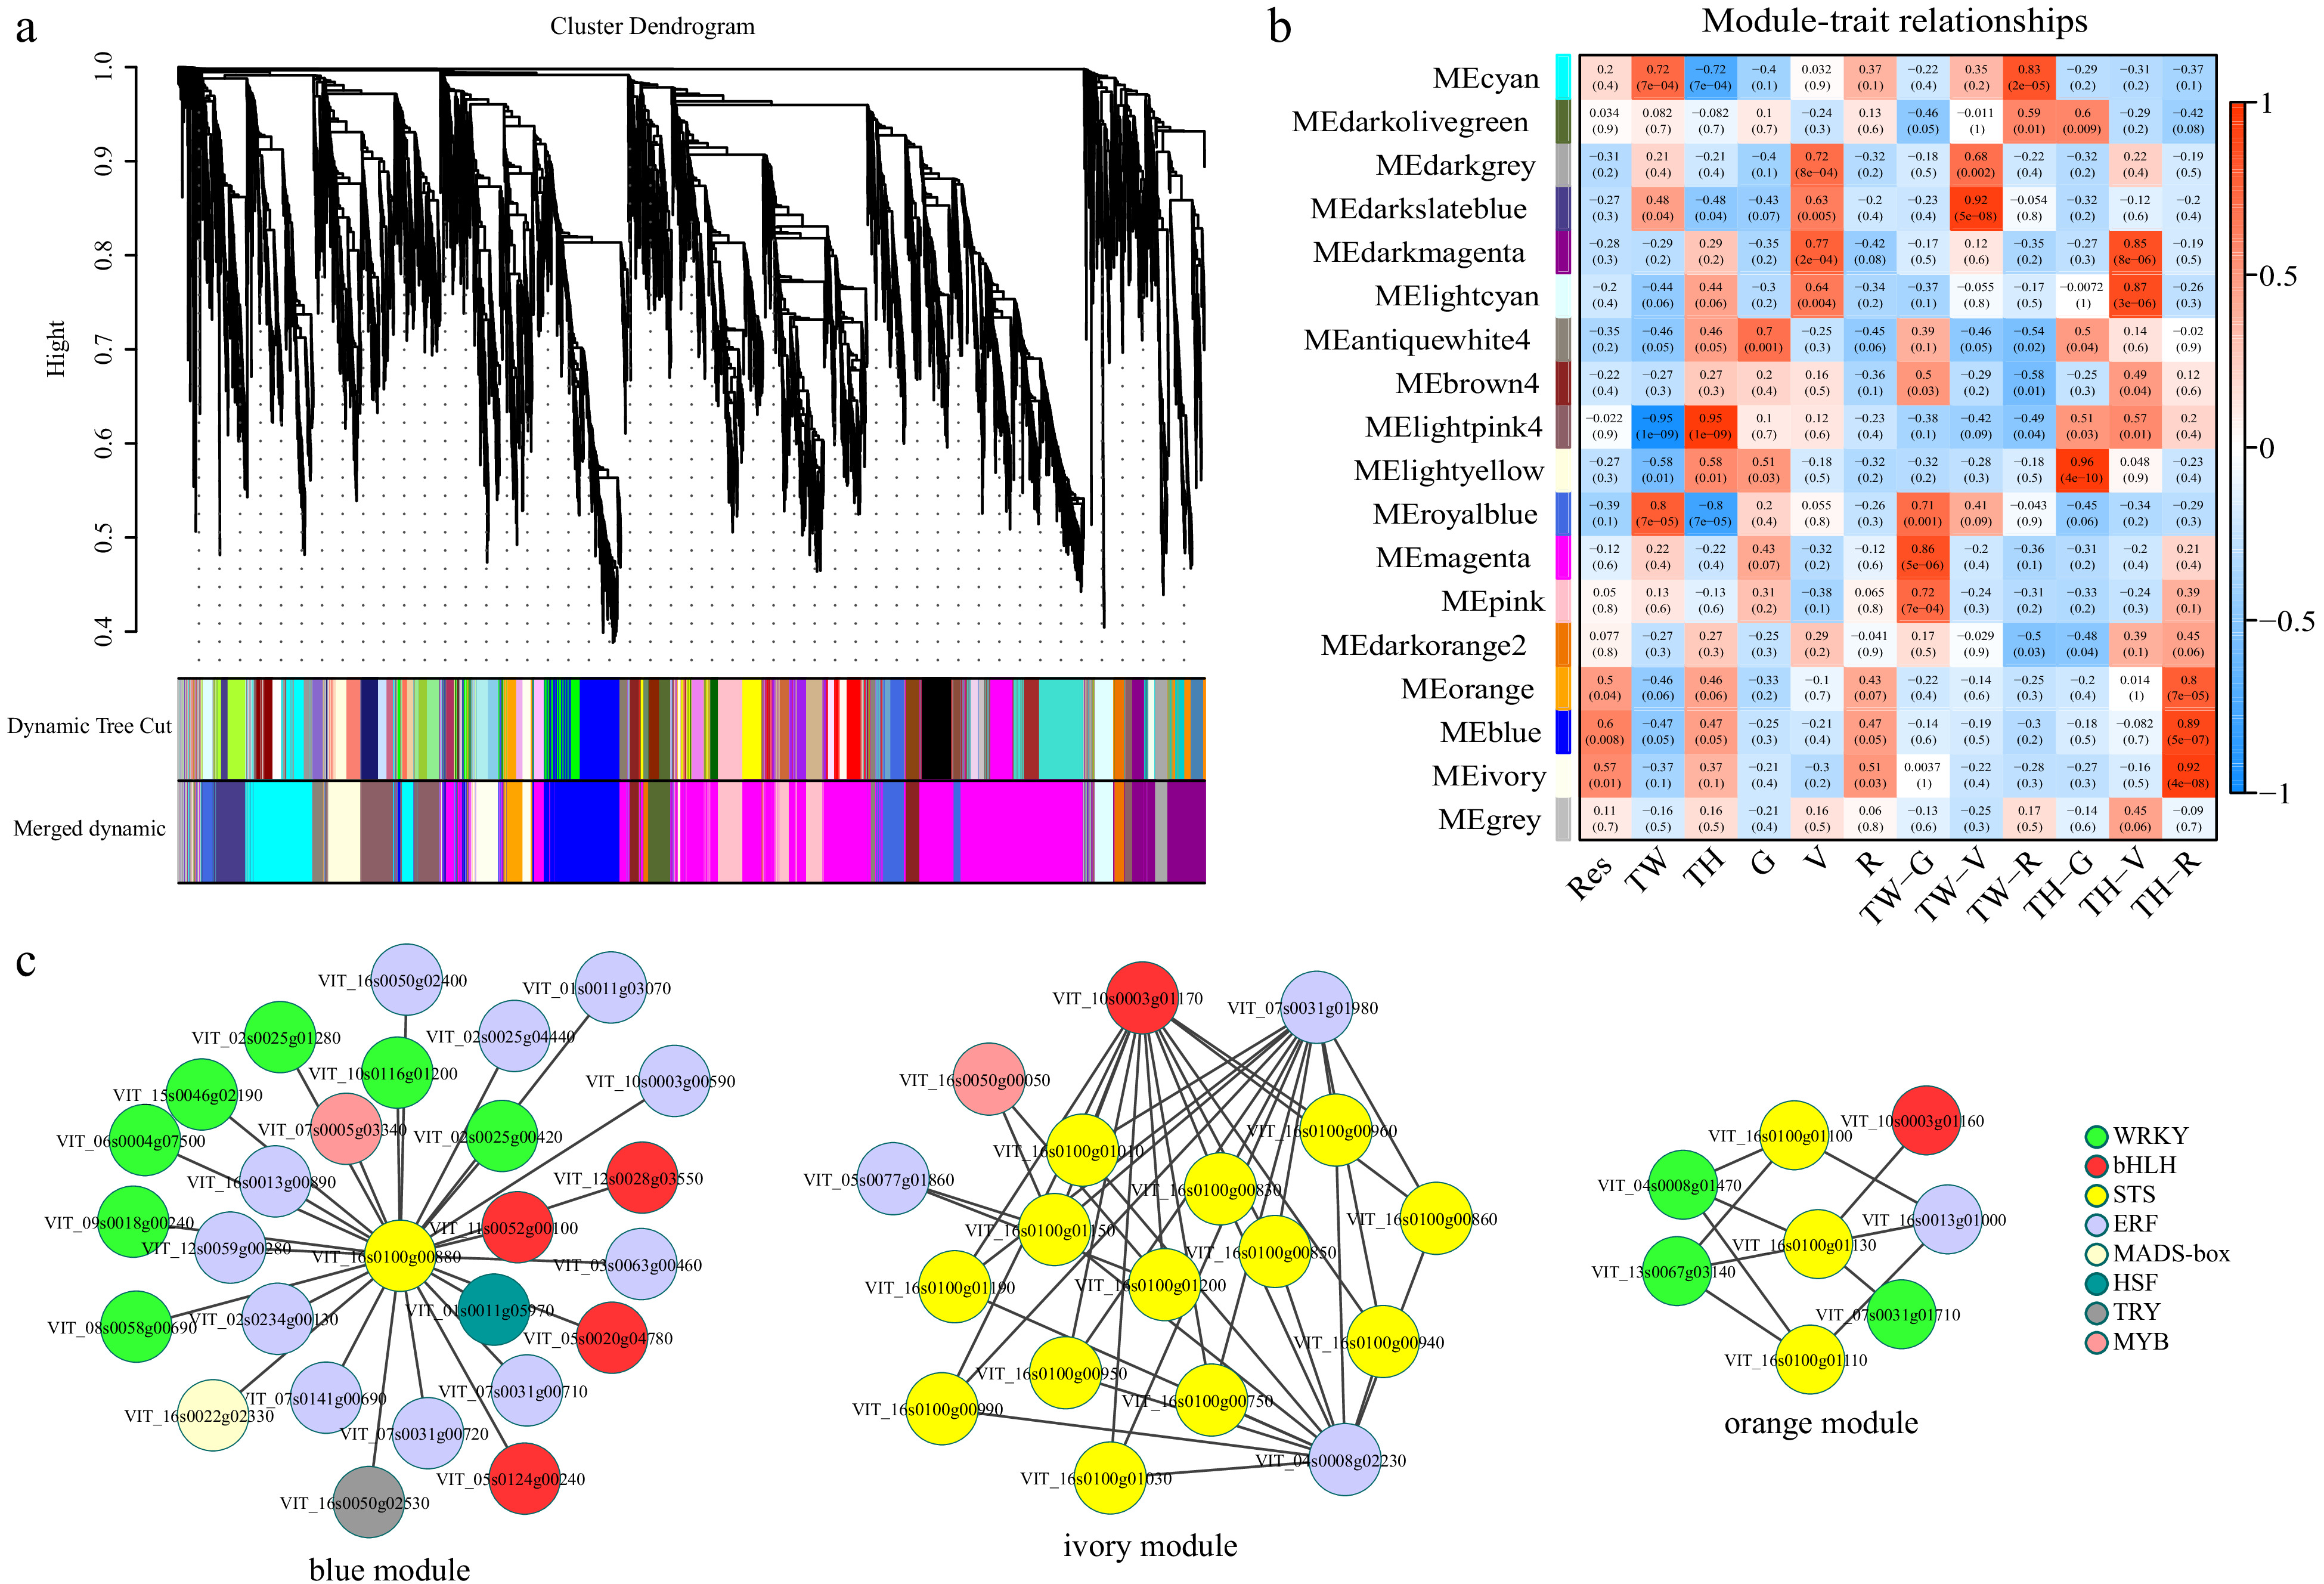
Figure 5. Results of weighted gene co-expression network analysis (WGCNA). (a) Hierarchical clustering tree indicating co-expression modules; (b) Module-trait relationship. Each row represents a module eigengene, and each column represents a trait. The corresponding correlation and p-value are indicated within each module. Res, resveratrol; TW, 'Tangwei'; TH, 'Tonghua-3'; (c) Transcription factors and stilbene synthase gene co-expression networks in the orange, blue and ivory modules.
-
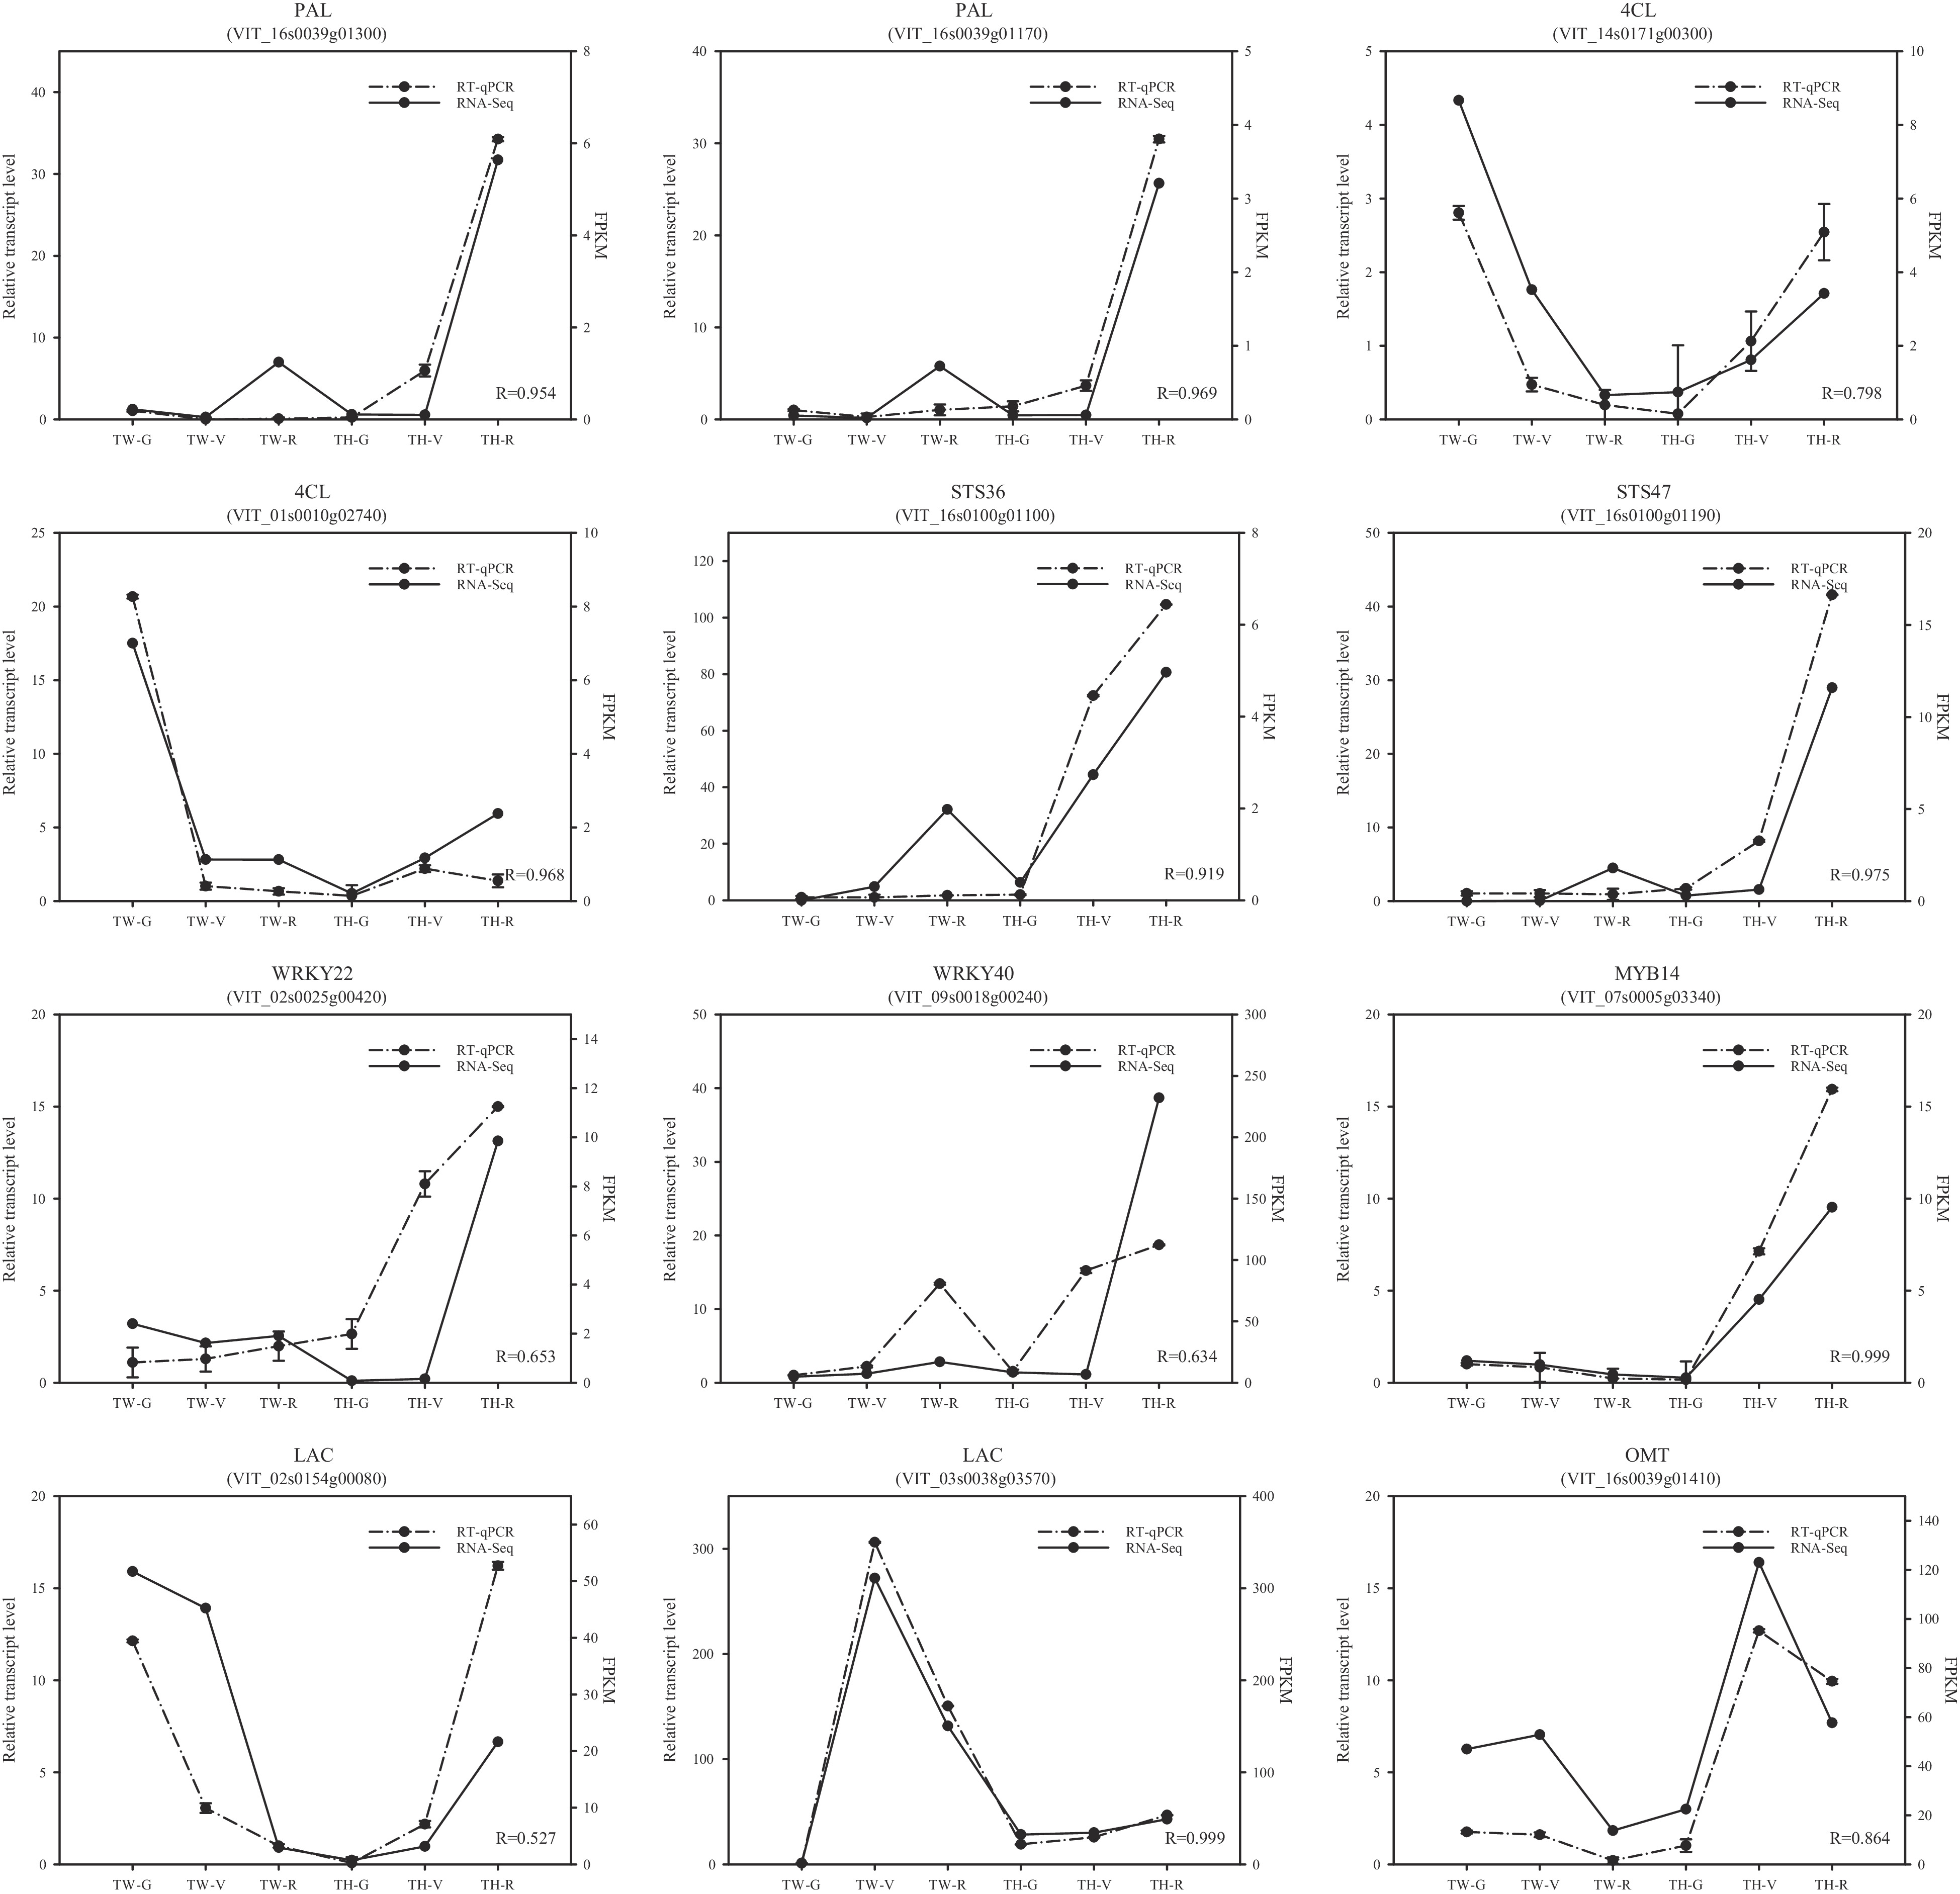
Figure 6. Comparison of the expression patterns of 12 randomly selected differentially expressed genes by RT-qPCR (real-time quantitative PCR) and RNA-seq. R-values are correlation coefficients between RT-qPCR and RNA-seq. FPKM, fragments per kilobase of transcript per million fragments mapped; TW, 'Tangwei'; TH, 'Tonghua-3'; G, green hard; V, véraison; R, ripe.
-
Structures Species Accessions or cultivars Content of trans-resveratrol (μg g−1 FW) Green hard Véraison Ripe Skin V. davidii Tangwei nd nd 2.415 ± 0.220 V. amurensis Tonghua-3 0.216 ± 0.041 0.656 ± 0.043 2.988 ± 0.221 Shuangyou 0.233 ± 0.062 0.313 ± 0.017 2.882 ± 0.052 V. amurensis × V. Vinifera Beibinghong 0.336 ± 0.076 1.486 ± 0.177 1.665 ± 0.100 V. vinifera Red Global 0.252 ± 0.051 0.458 ± 0.057 1.050 ± 0.129 Thompson seedless 0.120 ± 0.025 1.770 ± 0.032 0.431 ± 0.006 V. vinifera × V. labrusca Jumeigui 0.122 ± 0.016 0.170 ± 0.021 0.708 ± 0.135 Pulp V. davidii Tangwei 0.062 ± 0.006 0.088 ± 0.009 nd V. amurensis Tonghua-3 0.151 ± 0.066 0.324 ±0.104 0.032 ± 0.004 Shuangyou 0.053 ± 0.008 0.126 ± 0.044 0.041 ± 0.017 V. amurensis × V. Vinifera Beibinghong 0.057 ± 0.014 0.495 ± 0.068 0.087 ± 0.021 V. vinifera Red Global 0.059 ± 0.018 0.159 ± 0.013 0.027 ± 0.004 Thompson seedless 0.112 ± 0.016 0.059 ± 0.020 nd V. vinifera × V. labrusca Jumeigui 0.072 ± 0.010 0.063 ± 0.017 0.359 ± 0.023 Seed V. davidii Tangwei 0.096 ± 0.014 0.169 ± 0.028 0.049 ± 0.006 V. amurensis Tonghua-3 0.044 ± 0.004 0.221 ± 0.024 0.113 ± 0.027 Shuangyou nd 0.063 ± 0.021 0.116 ± 0.017 V. amurensis × V. Vinifera Beibinghong nd 0.077 ± 0.003 0.400 ± 0.098 V. vinifera Red Global 0.035 ± 0.023 0.142 ± 0.036 0.199 ± 0.009 Thompson seedless − − − V. vinifera × V. labrusca Jumeigui 0.077 ± 0.025 0.017 ± 0.004 0.284 ± 0.021 'nd' indicates not detected in samples, and '−' shows no samples are collected due to abortion. Table 1. Resveratrol concentrations in the skin, pulp and seed of berries from different grapevine genotypes at green hard, véraison and ripe stages.
Figures
(6)
Tables
(1)