-
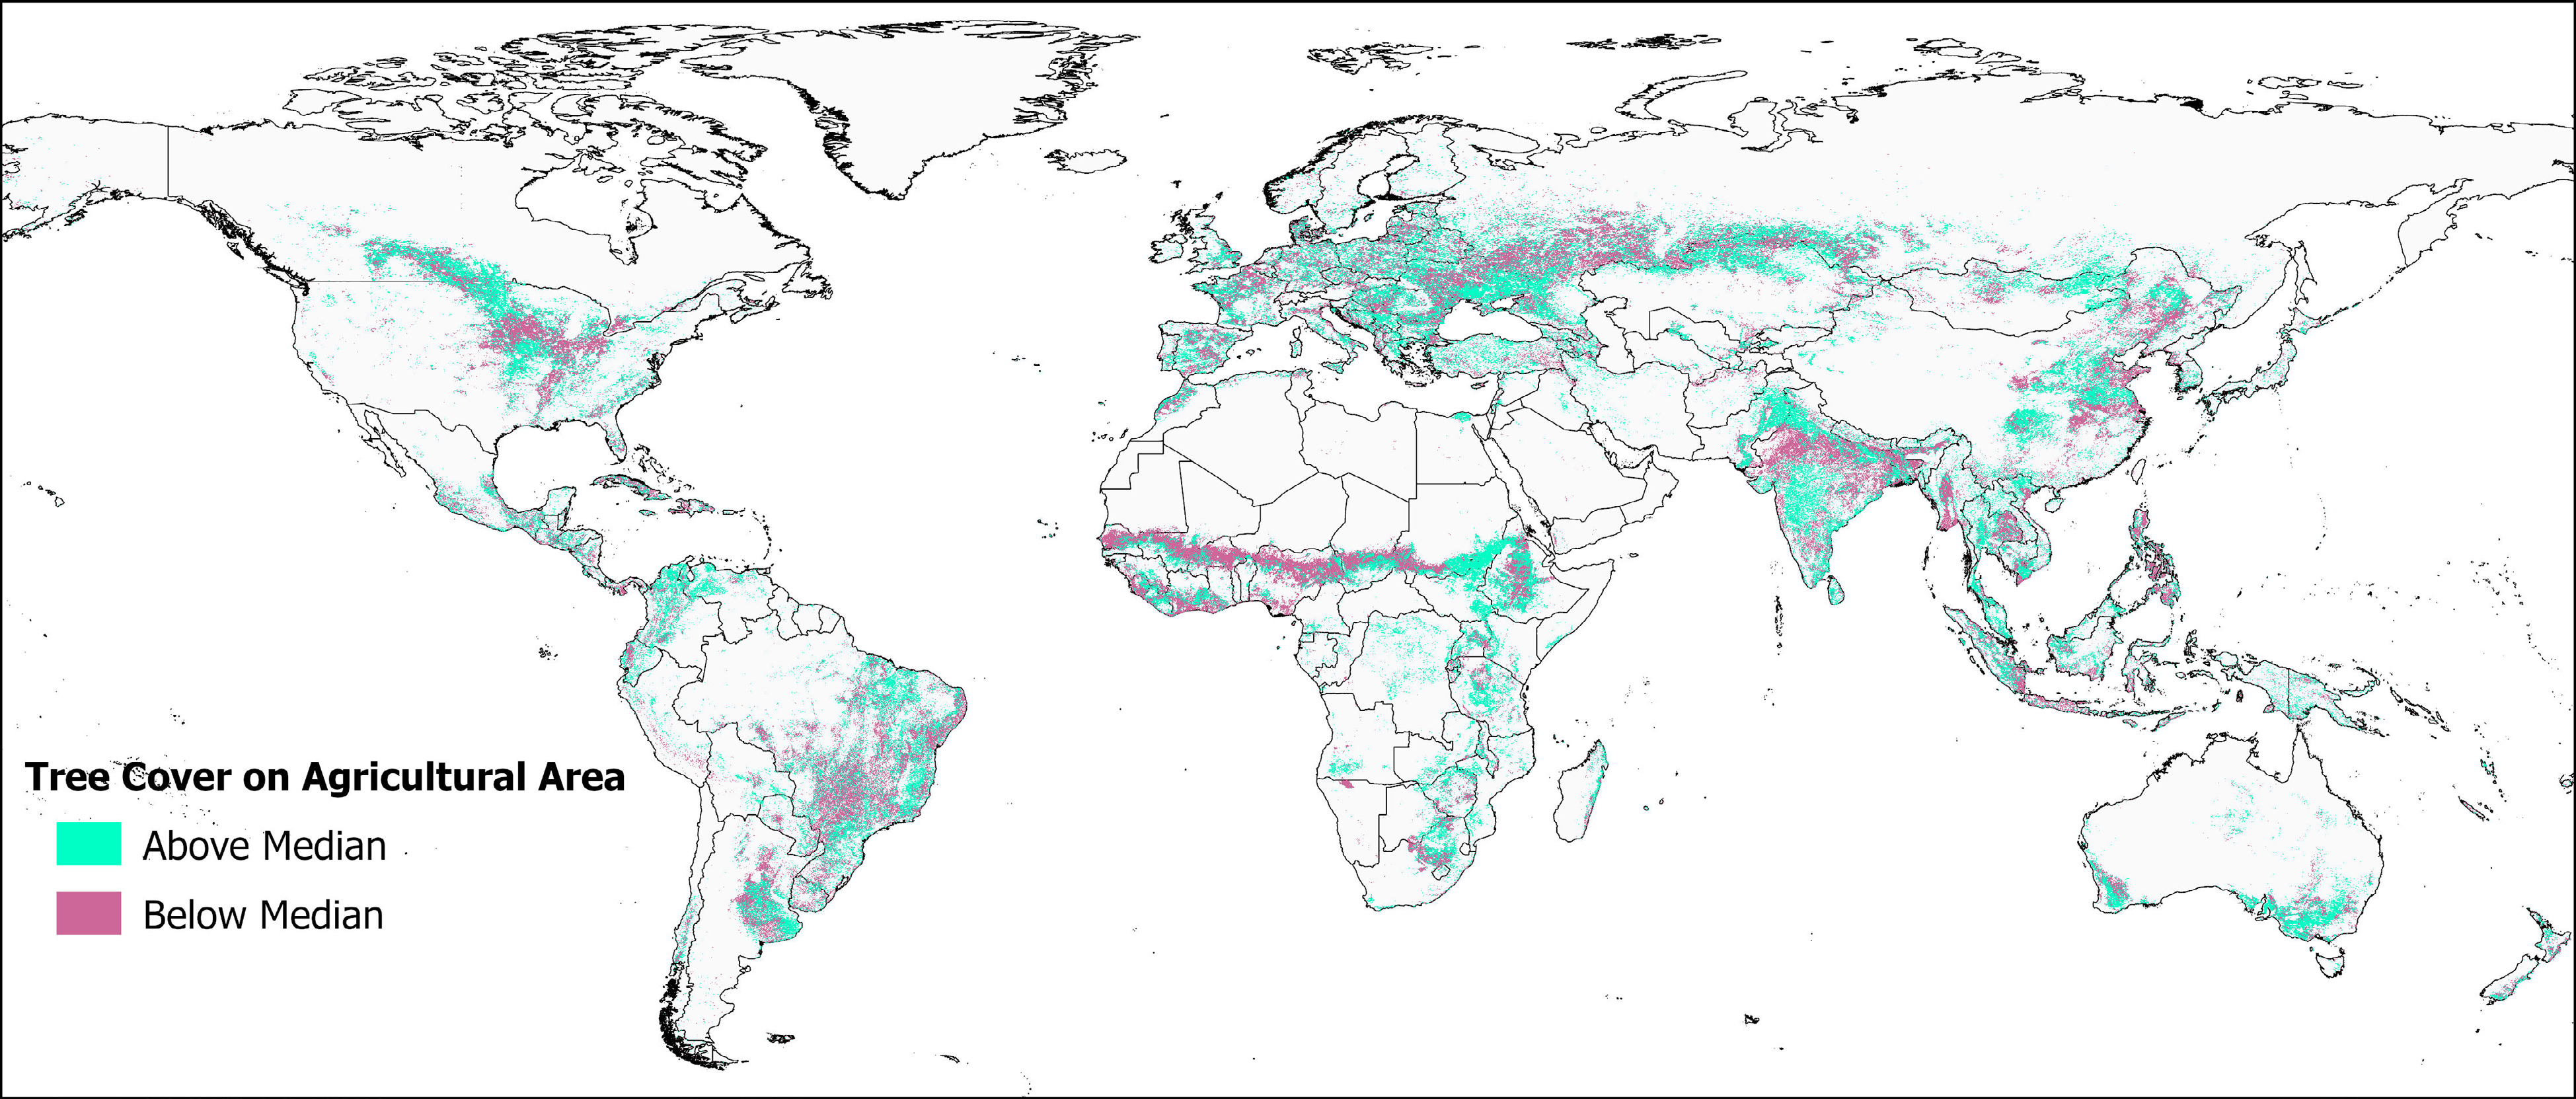
Figure 1.
Agricultural area with tree cover above and below the median tree cover value, within each grid cell's respective bioclimatic strata, i.e., carbon and aridity zone combination (n = 495 strata).
-
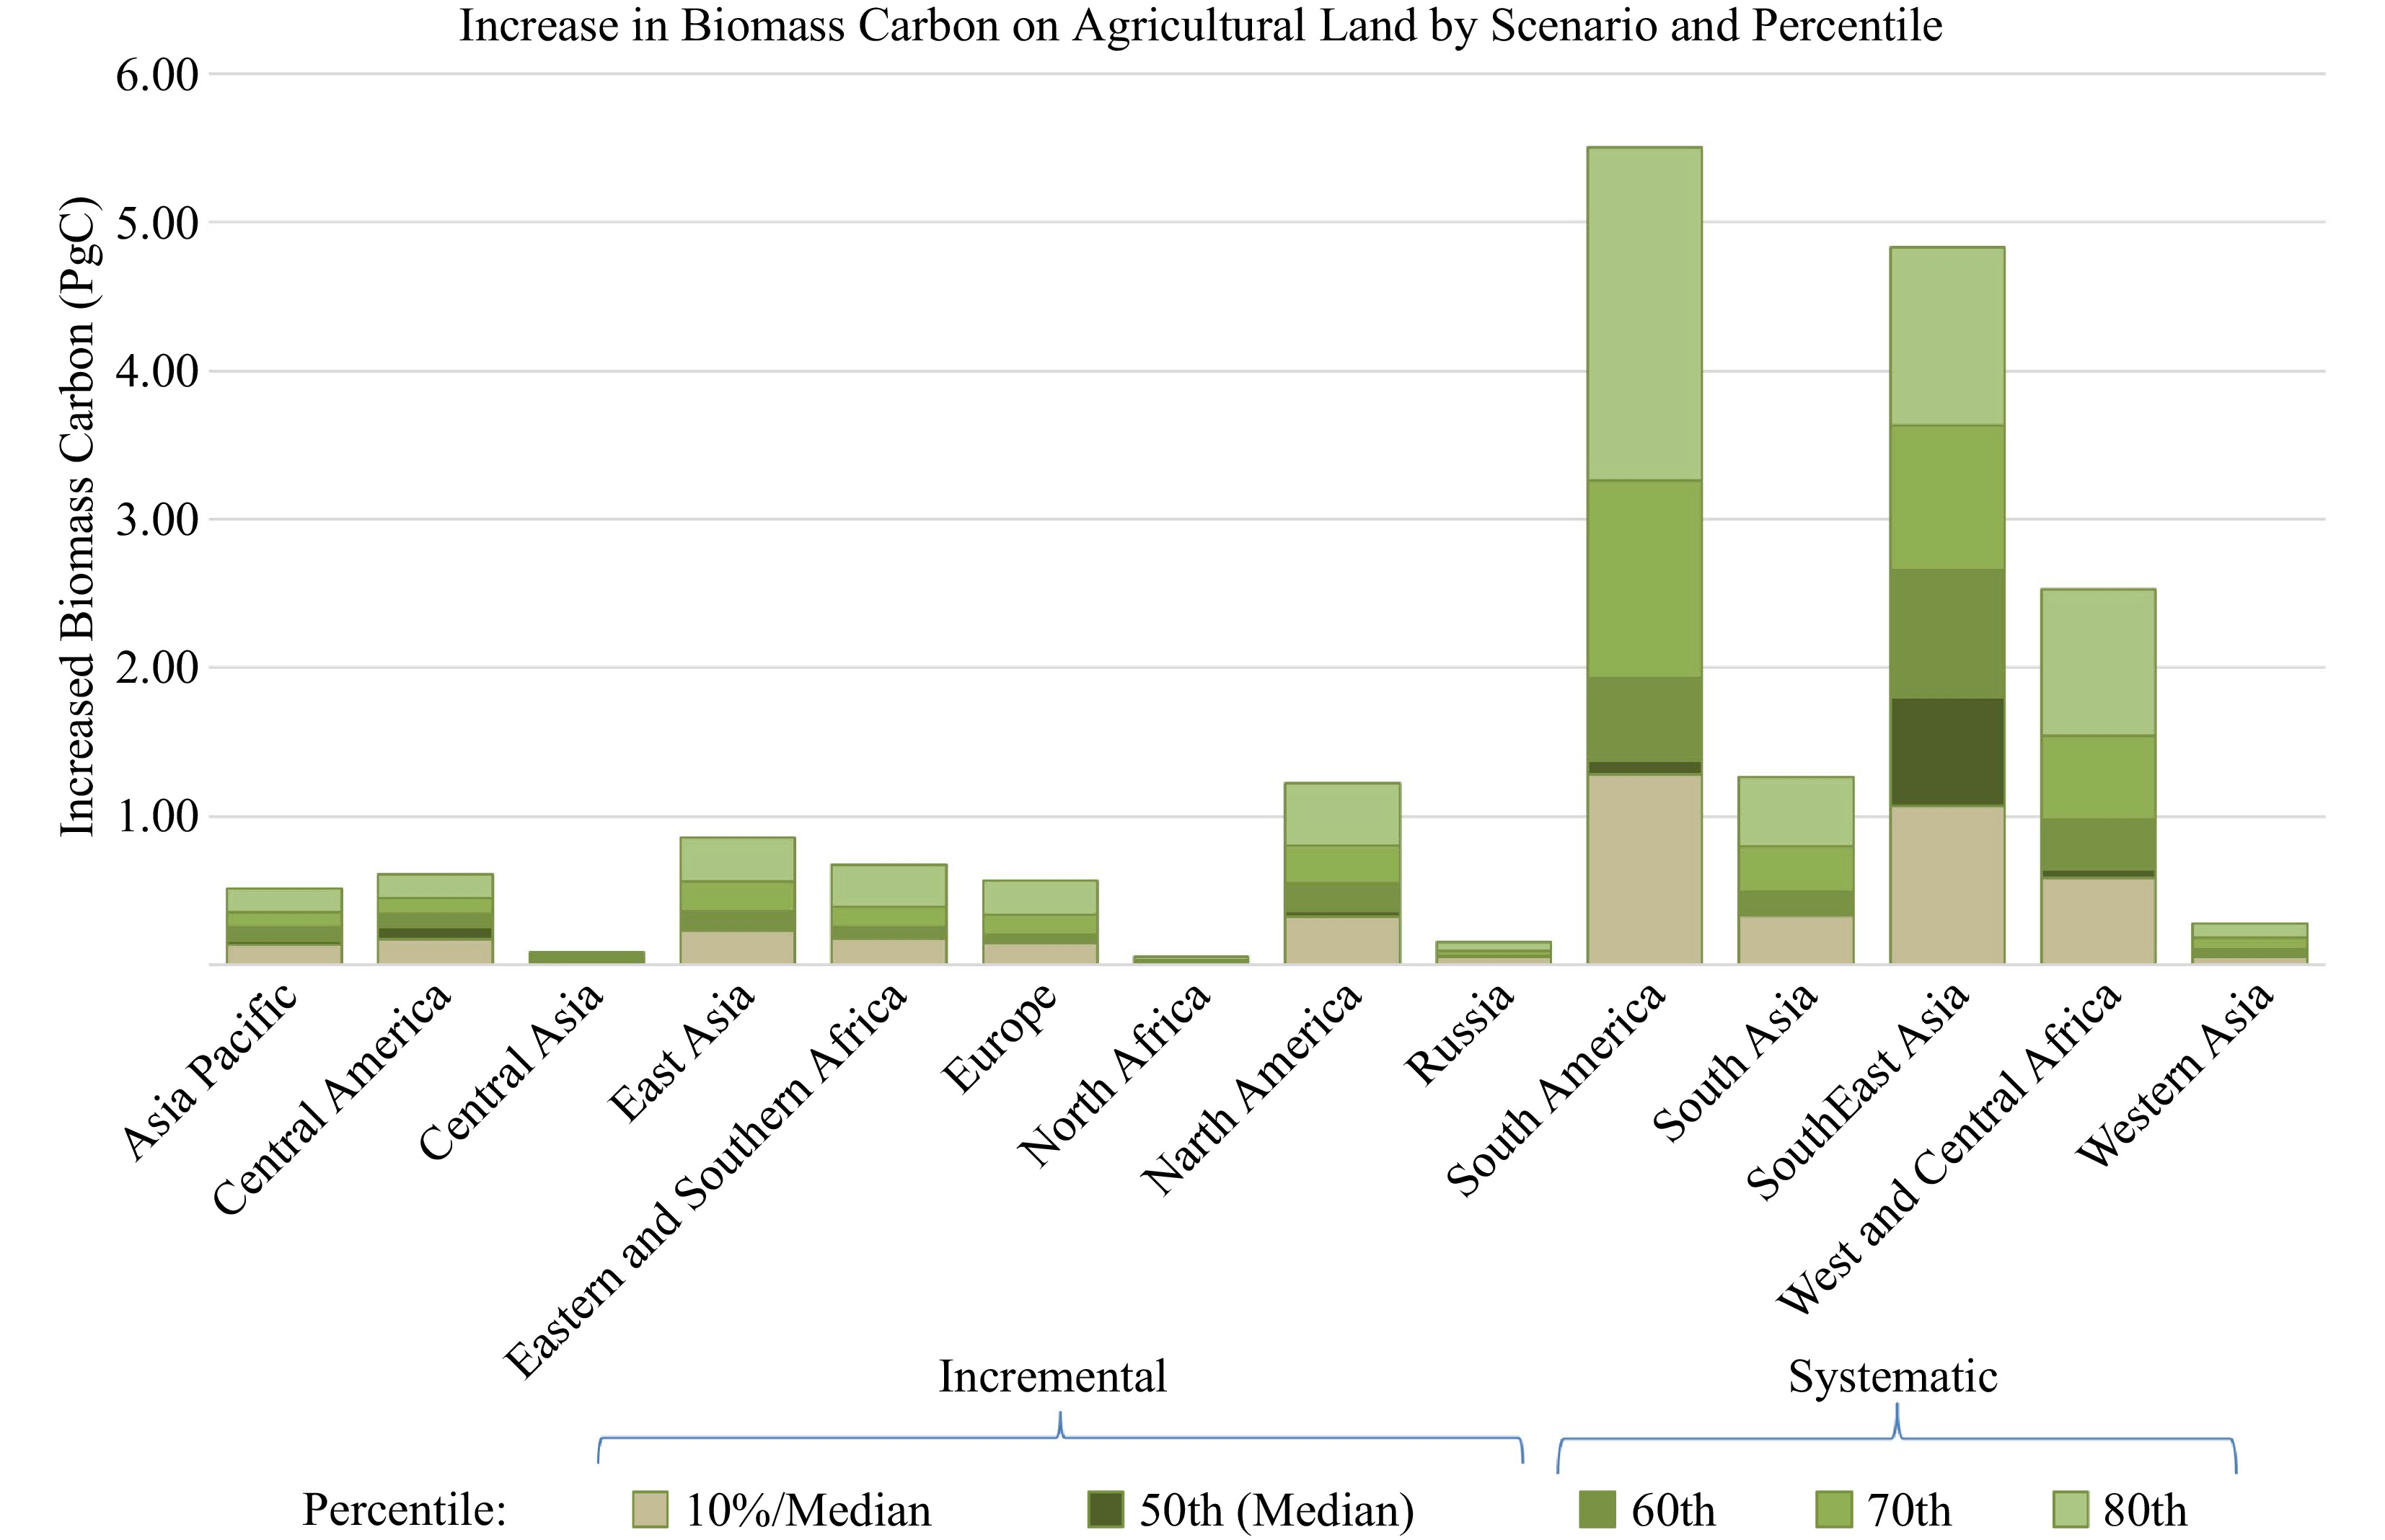
Figure 2.
Increase in above- and below-ground biomass carbon, across the range of adoption scenarios and percentile levels explored in the geospatial modeling of potential carbon sequestration from increased tree cover on agricultural land. Percentiles are calculated based upon the existing tree cover 2010, within each respective carbon/aridity zone combination (n = 495 strata).
-
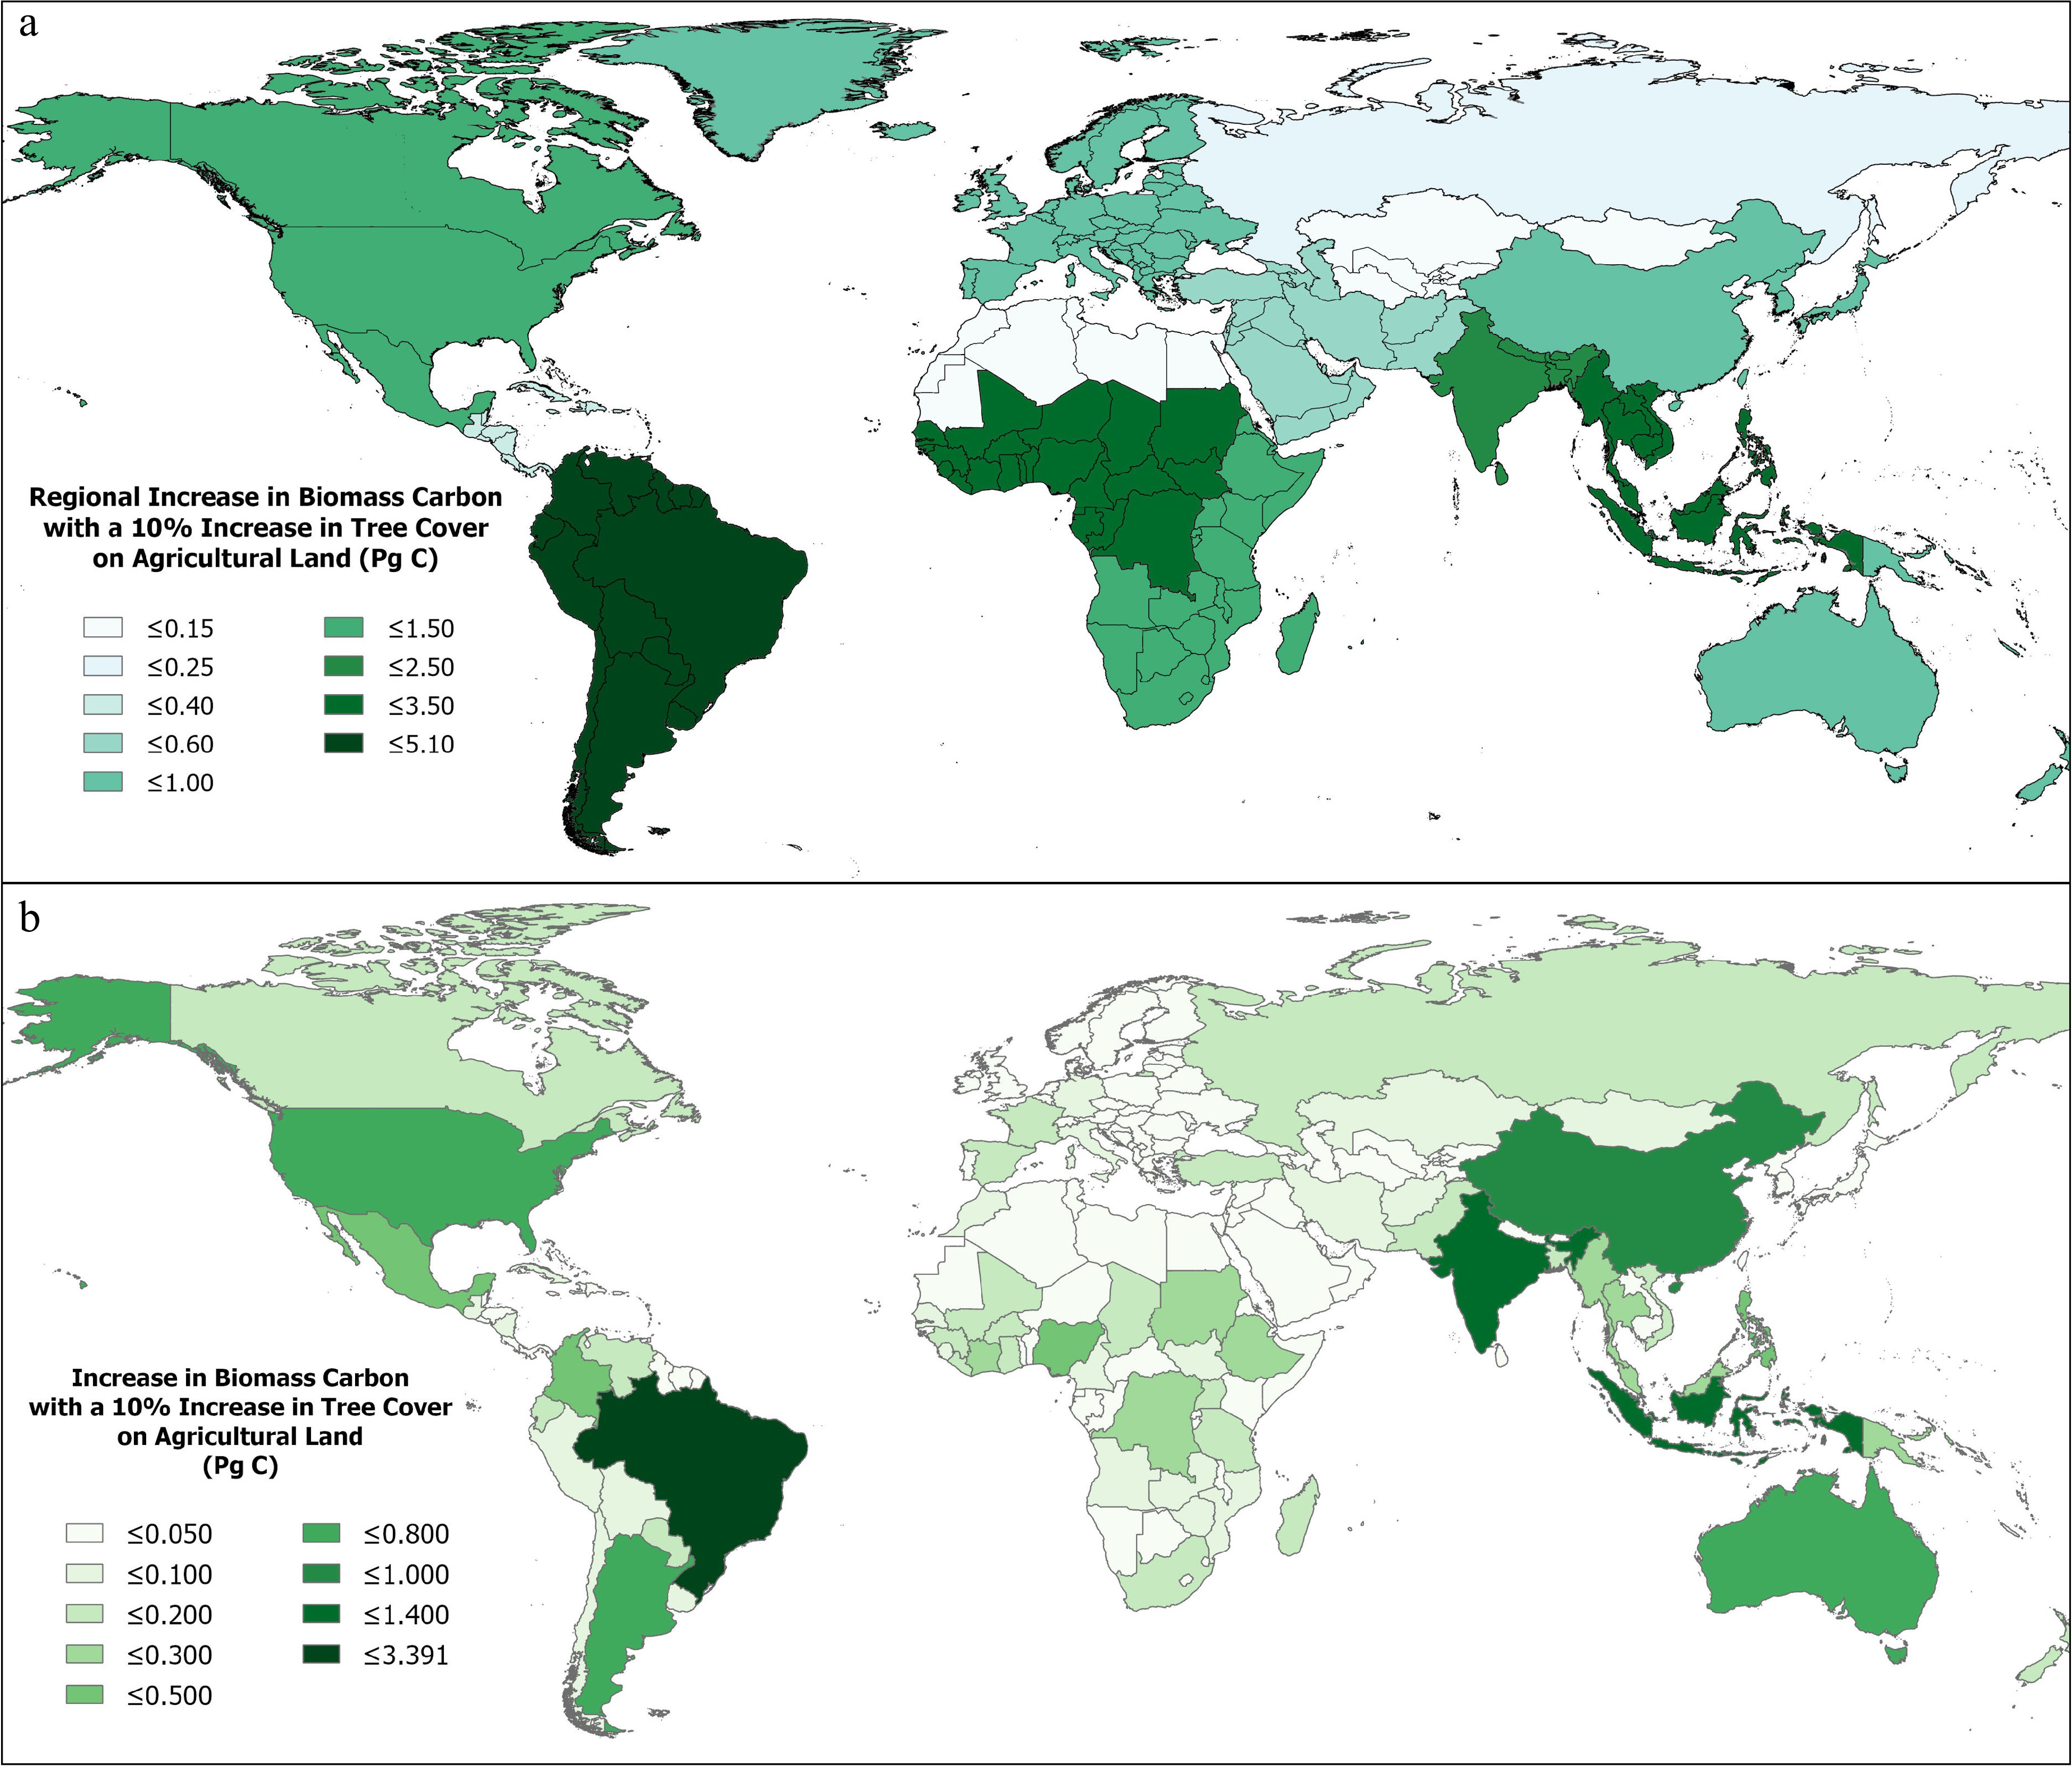
Figure 3.
Increase in above- and below-ground biomass carbon with a 10% increase in tree cover on all agricultural land (a) regionally, (b) by country.
-
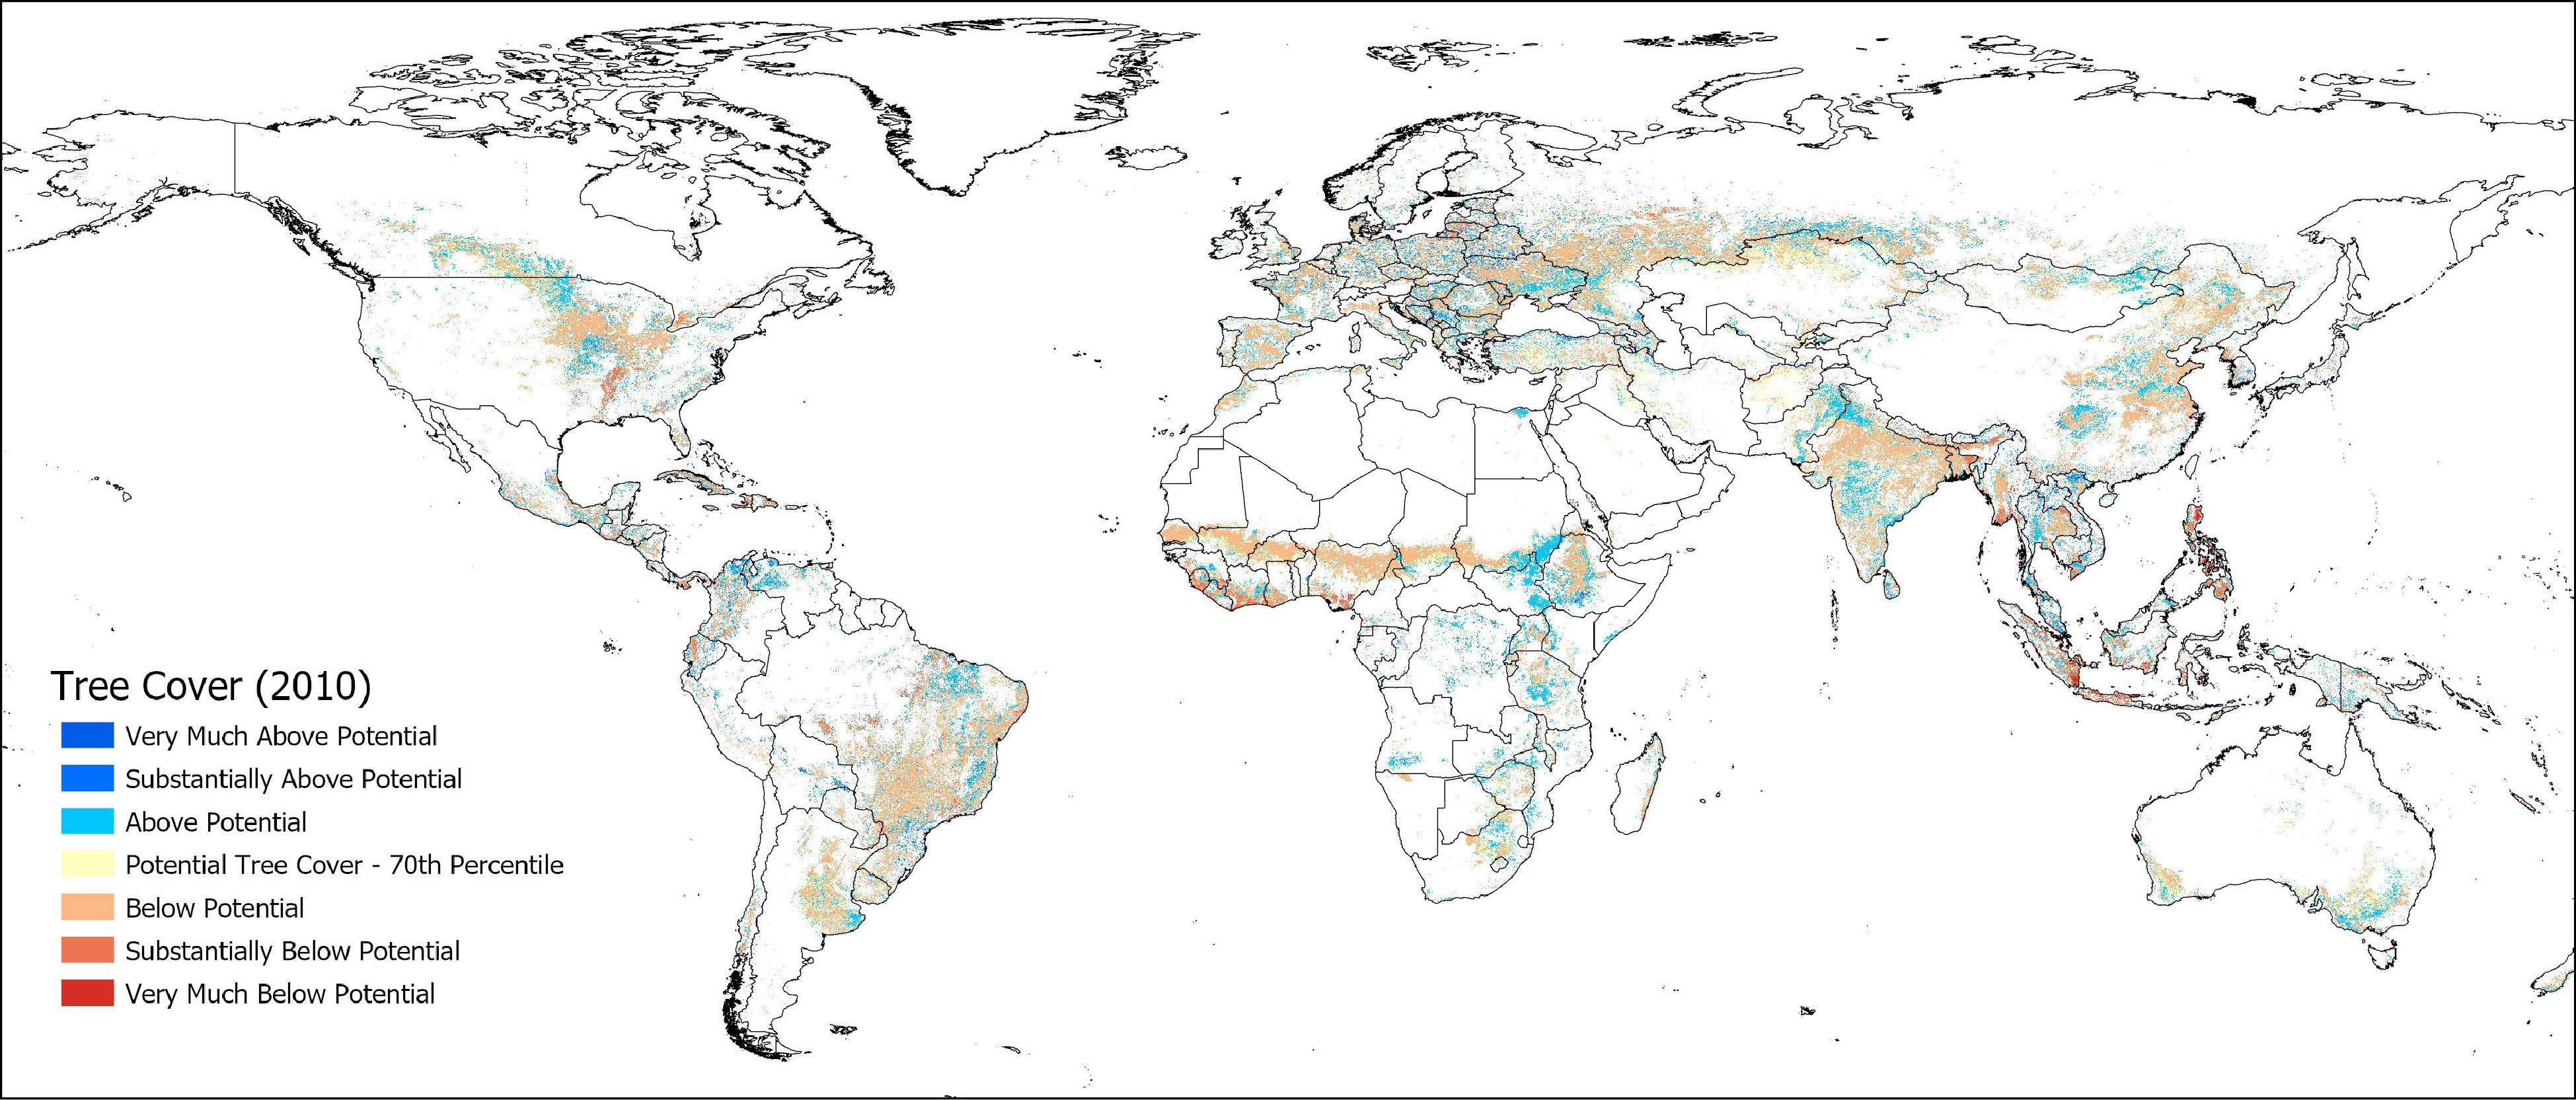
Figure 4.
Tree cover on agricultural land 2010 compared to potential tree cover with systemic change to agroforestry-type agricultural systems estimated at the 70th percentile for adoption.
-
Region Biomass Carbon (PgC) Agricultural area
(km2)IPCC Tier 1 Harmonized Carbon Density Map Difference Total biomass Above-ground Below-ground Total biomass Total biomass Percentage Asia Pacific 2.28 1.32 0.50 1.82 0.47 25.6 790,658 Central America 1.52 0.79 0.22 1.02 0.50 49.0 269,235 Central Asia 0.47 0.20 0.25 0.45 0.02 5.4 830,949 East Asia 2.53 1.52 0.61 2.13 0.40 18.6 1,795,893 Eastern and Southern Africa 2.30 2.48 2.09 4.57 −2.27 −49.7 1,573,527 Europe 2.15 3.18 1.19 4.36 −2.21 −50.7 2,299,766 North Africa 0.11 0.13 0.08 0.22 −0.10 −46.8 155,948 North America 3.40 2.83 1.16 3.99 −0.59 −14.9 2,073,033 Russia 1.07 1.37 0.73 2.10 −1.04 −49.3 1,669,166 South America 12.13 7.87 3.50 11.37 0.76 6.7 3,888,792 South Asia 2.48 1.08 0.35 1.43 1.05 73.2 1,827,025 SouthEast Asia 10.69 6.68 1.76 8.44 2.24 26.5 1,648,268 West and Central Africa 5.45 3.99 1.91 5.91 −0.45 −7.7 2,390,980 Western Asia 0.79 0.43 0.20 0.63 0.15 24.4 955,689 Global 47.37 33.88 14.57 48.45 −1.08 −2.22 22,168,929 -
Increased biomass Carbon (PgC) by percent increase on all agricultural land Region 1% 5% 10% Country 1% 5% 10% PgC PgC Asia Pacific 0.09 0.46 0.91 Brazil 0.339 1.696 3.391 Central America 0.04 0.19 0.39 Indonesia 0.136 0.662 1.319 Central Asia 0.01 0.07 0.14 India 0.133 0.662 1.323 East Asia 0.09 0.43 0.86 China 0.081 0.407 0.814 Eastern and Southern Africa 0.13 0.63 1.25 United States 0.072 0.359 0.719 Europe 0.08 0.39 0.79 Argentina 0.060 0.299 0.597 North Africa 0.01 0.06 0.12 Australia 0.056 0.282 0.563 North America 0.12 0.60 1.20 Nigeria 0.050 0.248 0.495 Russia 0.02 0.09 0.18 Philippines 0.043 0.197 0.388 South America 0.51 2.55 5.10 Colombia 0.040 0.197 0.394 South Asia 0.15 0.77 1.53 Mexico 0.034 0.169 0.337 SouthEast Asia 0.27 1.34 2.67 Thailand 0.029 0.143 0.286 West and Central Africa 0.26 1.28 2.55 Ethiopia 0.029 0.145 0.289 Western Asia 0.06 0.29 0.58 Côte d'Ivoire 0.028 0.143 0.286 Sudan 0.024 0.119 0.237 Global 1.83 9.13 18.27 Table 2.
Increase in above and below-ground biomass carbon with an increase of tree cover by 1%, 5%, and 10% on all agricultural land, regionally, and showing the top 15 countries with the highest potential increase.
-
Region Biomass Carbon Increase in biomass Carbon by scenario and percentile Incremental Systematic 2000 2010 10% / Median Median (50th) 60th 70th 80th PgC PgC PgC Asia Pacific 1.42 1.52 0.14 0.16 0.26 0.36 0.52 Central America 0.48 0.47 0.17 0.25 0.34 0.45 0.61 Central Asia 2.37 2.53 0.02 0.02 0.06 0.07 0.09 East Asia 2.31 2.30 0.23 0.23 0.36 0.56 0.86 Eastern and Southern Africa 2.13 2.15 0.18 0.19 0.25 0.39 0.68 Europe 0.11 0.11 0.15 0.15 0.20 0.34 0.57 North Africa 3.31 3.40 0.01 0.01 0.01 0.03 0.05 North America 2.11 2.28 0.33 0.36 0.55 0.81 1.22 Russia 1.07 1.07 0.06 0.06 0.06 0.10 0.16 South America 11.34 12.13 1.28 1.38 1.93 3.26 5.50 South Asia 2.30 2.48 0.33 0.35 0.49 0.80 1.27 SouthEast Asia 10.03 10.69 1.07 1.80 2.66 3.63 4.83 West and Central Africa 5.57 5.45 0.58 0.64 0.98 1.54 2.53 Western Asia 0.75 0.79 0.06 0.07 0.11 0.18 0.28 Global 45.30 47.37 4.60 5.29 8.27 12.51 19.15 Table 3.
Increase in above- and below-ground biomass carbon on agricultural land, across the range of adoption scenarios and percentile levels explored in the geospatial modeling of potential carbon sequestration from increased tree cover on agricultural land. Percentiles are calculated based upon the existing tree cover 2010 with each respective carbon/aridity zone combination n = 495 global strata.
Figures
(4)
Tables
(3)