-
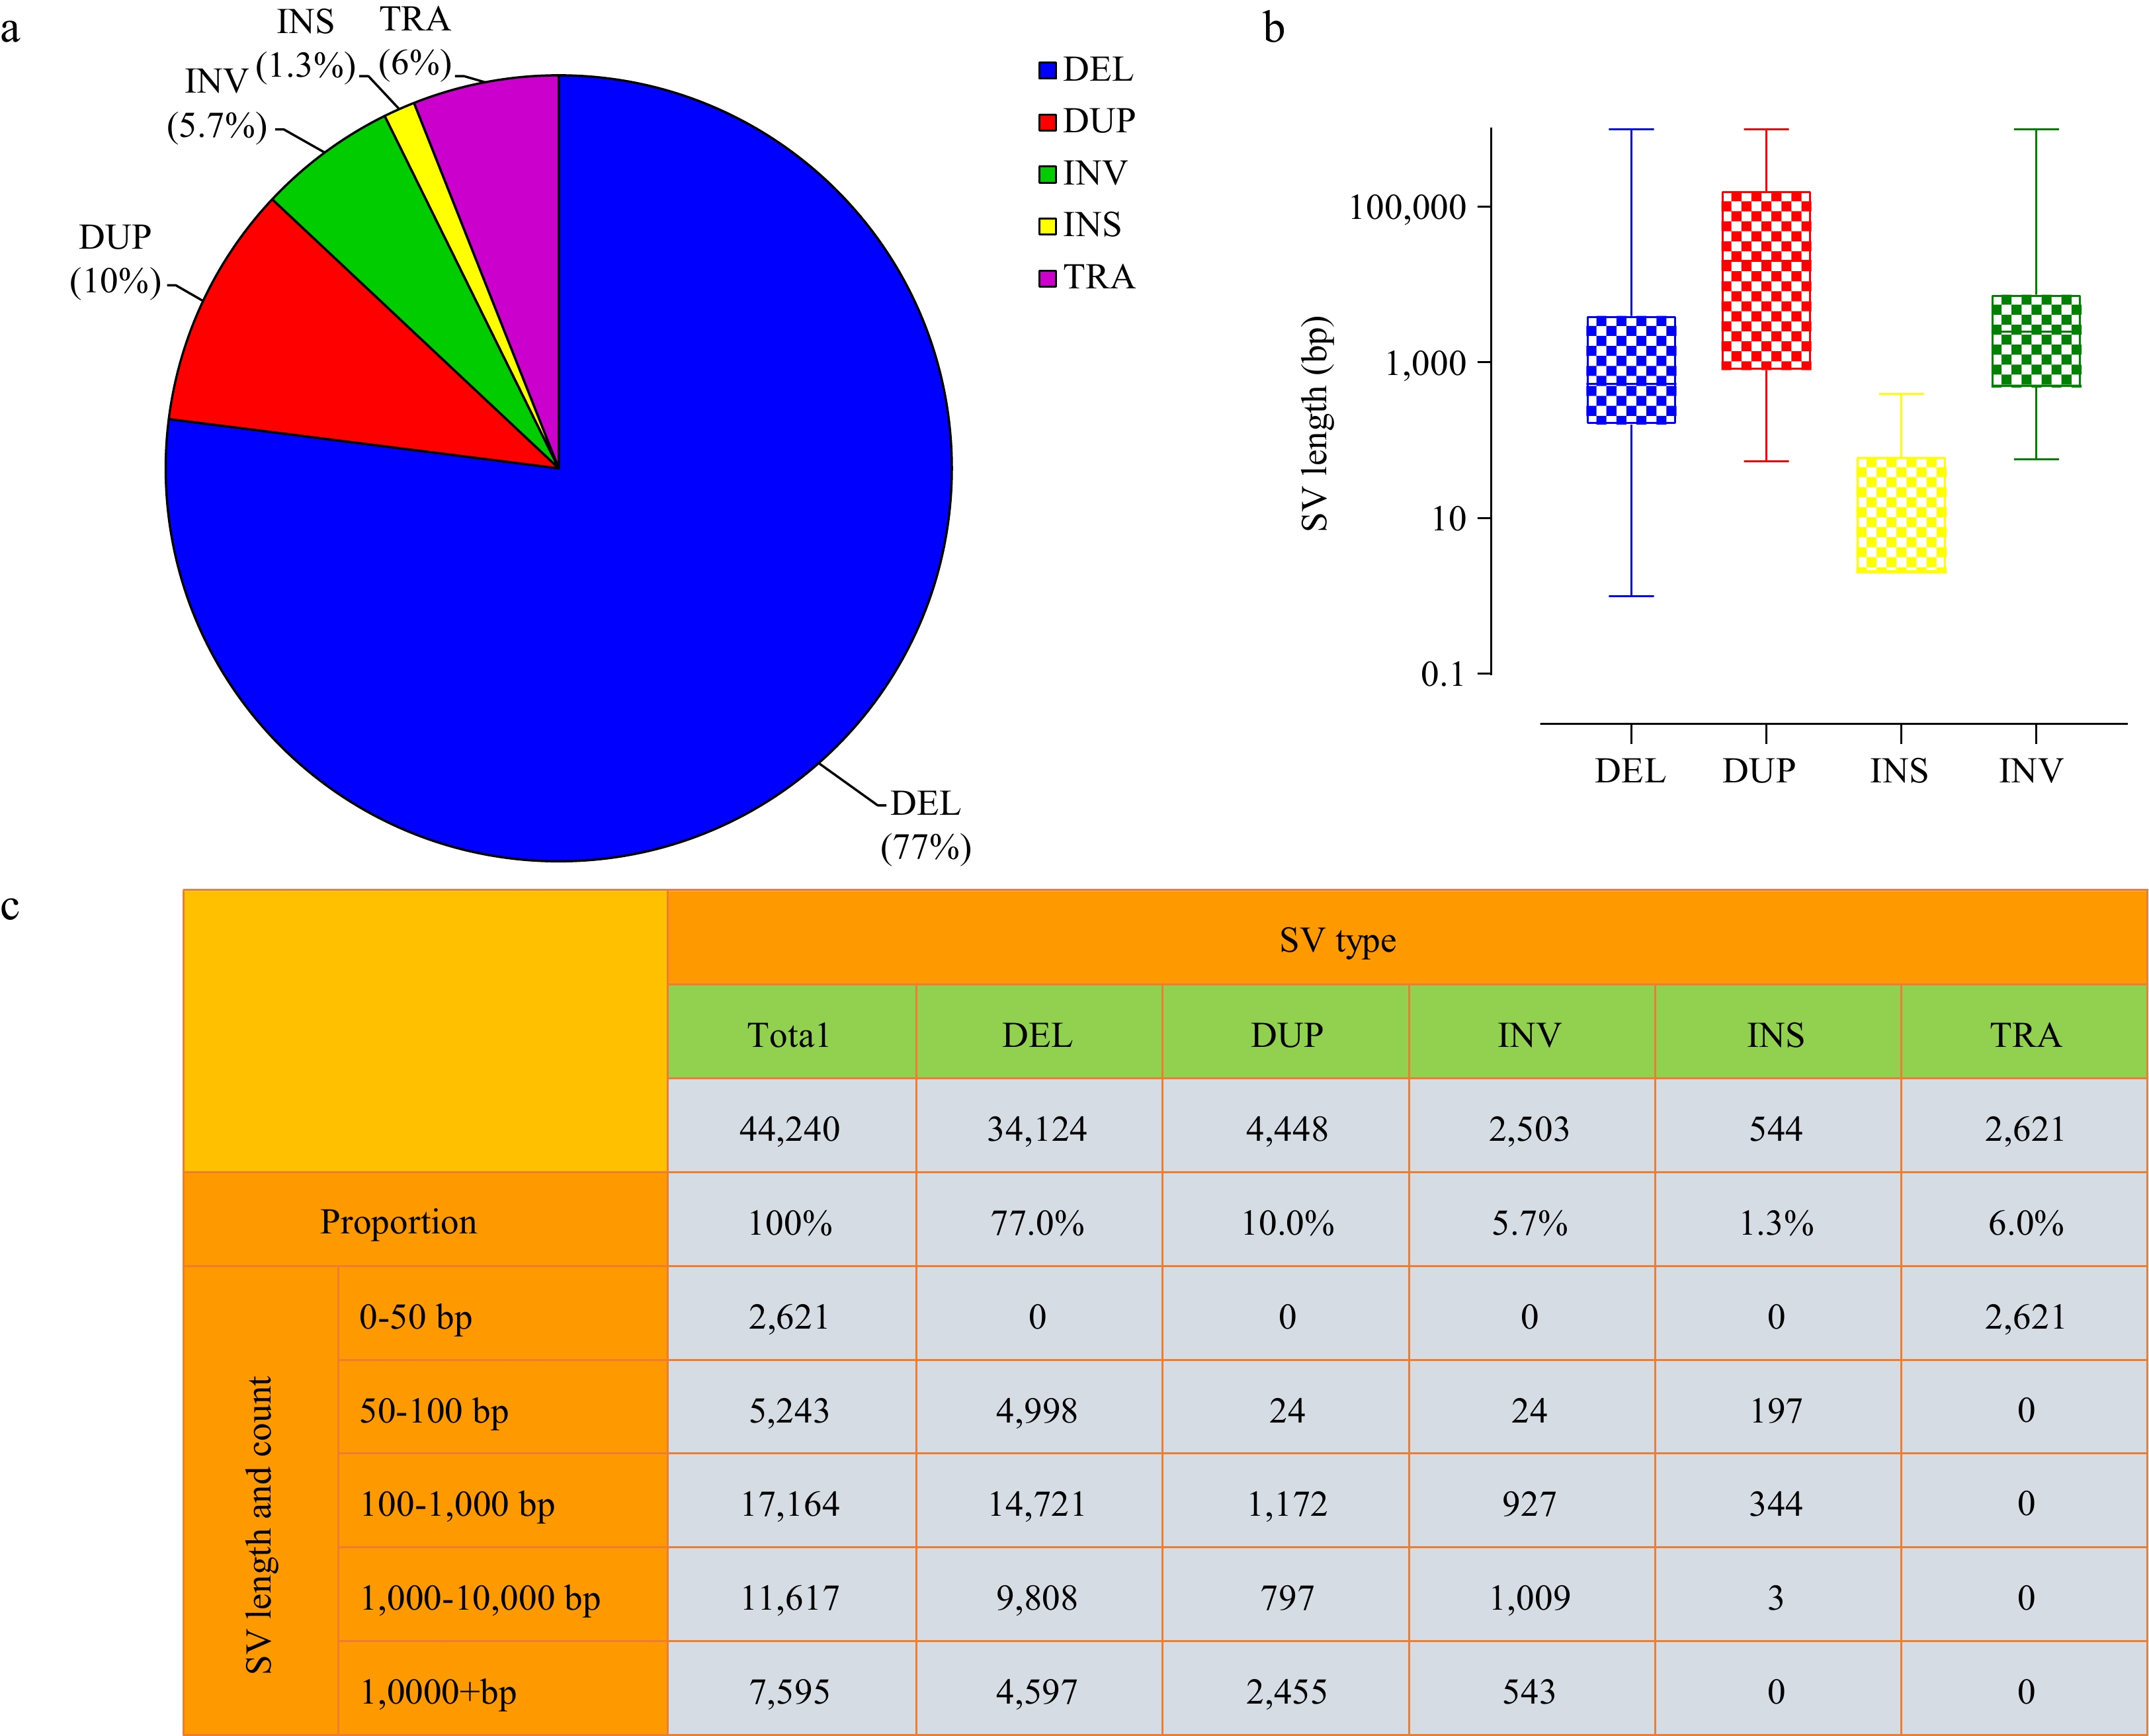
Figure 1.
Characteristics of SVs in tea plant genome. (a) Relative proportions of SVs identified. (b) Length distributions of SVs (log10 scale). (c) Statistics of complete SVs information.
-
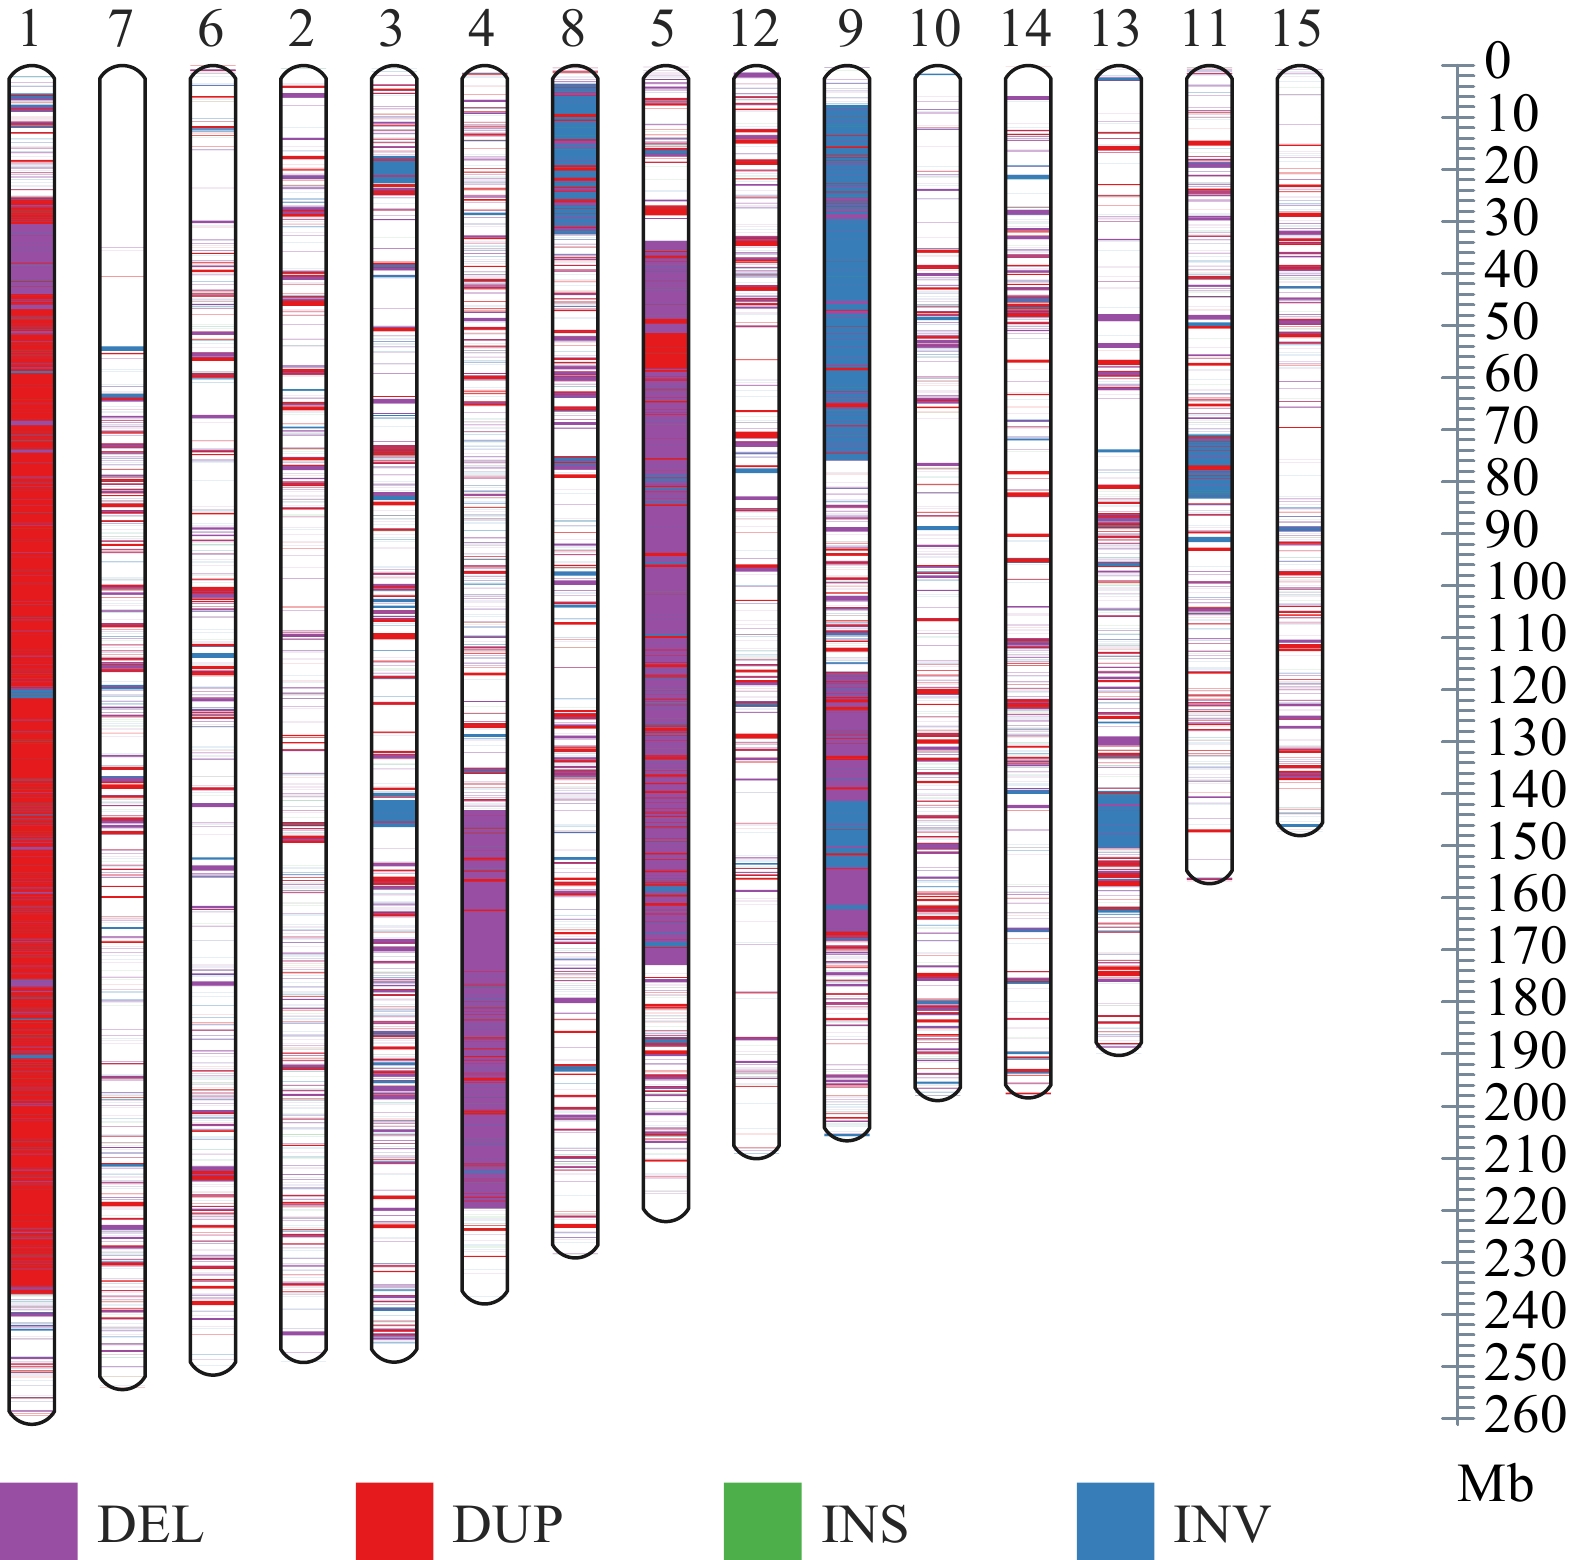
Figure 2.
Distribution of SV on different chromosomes.
-
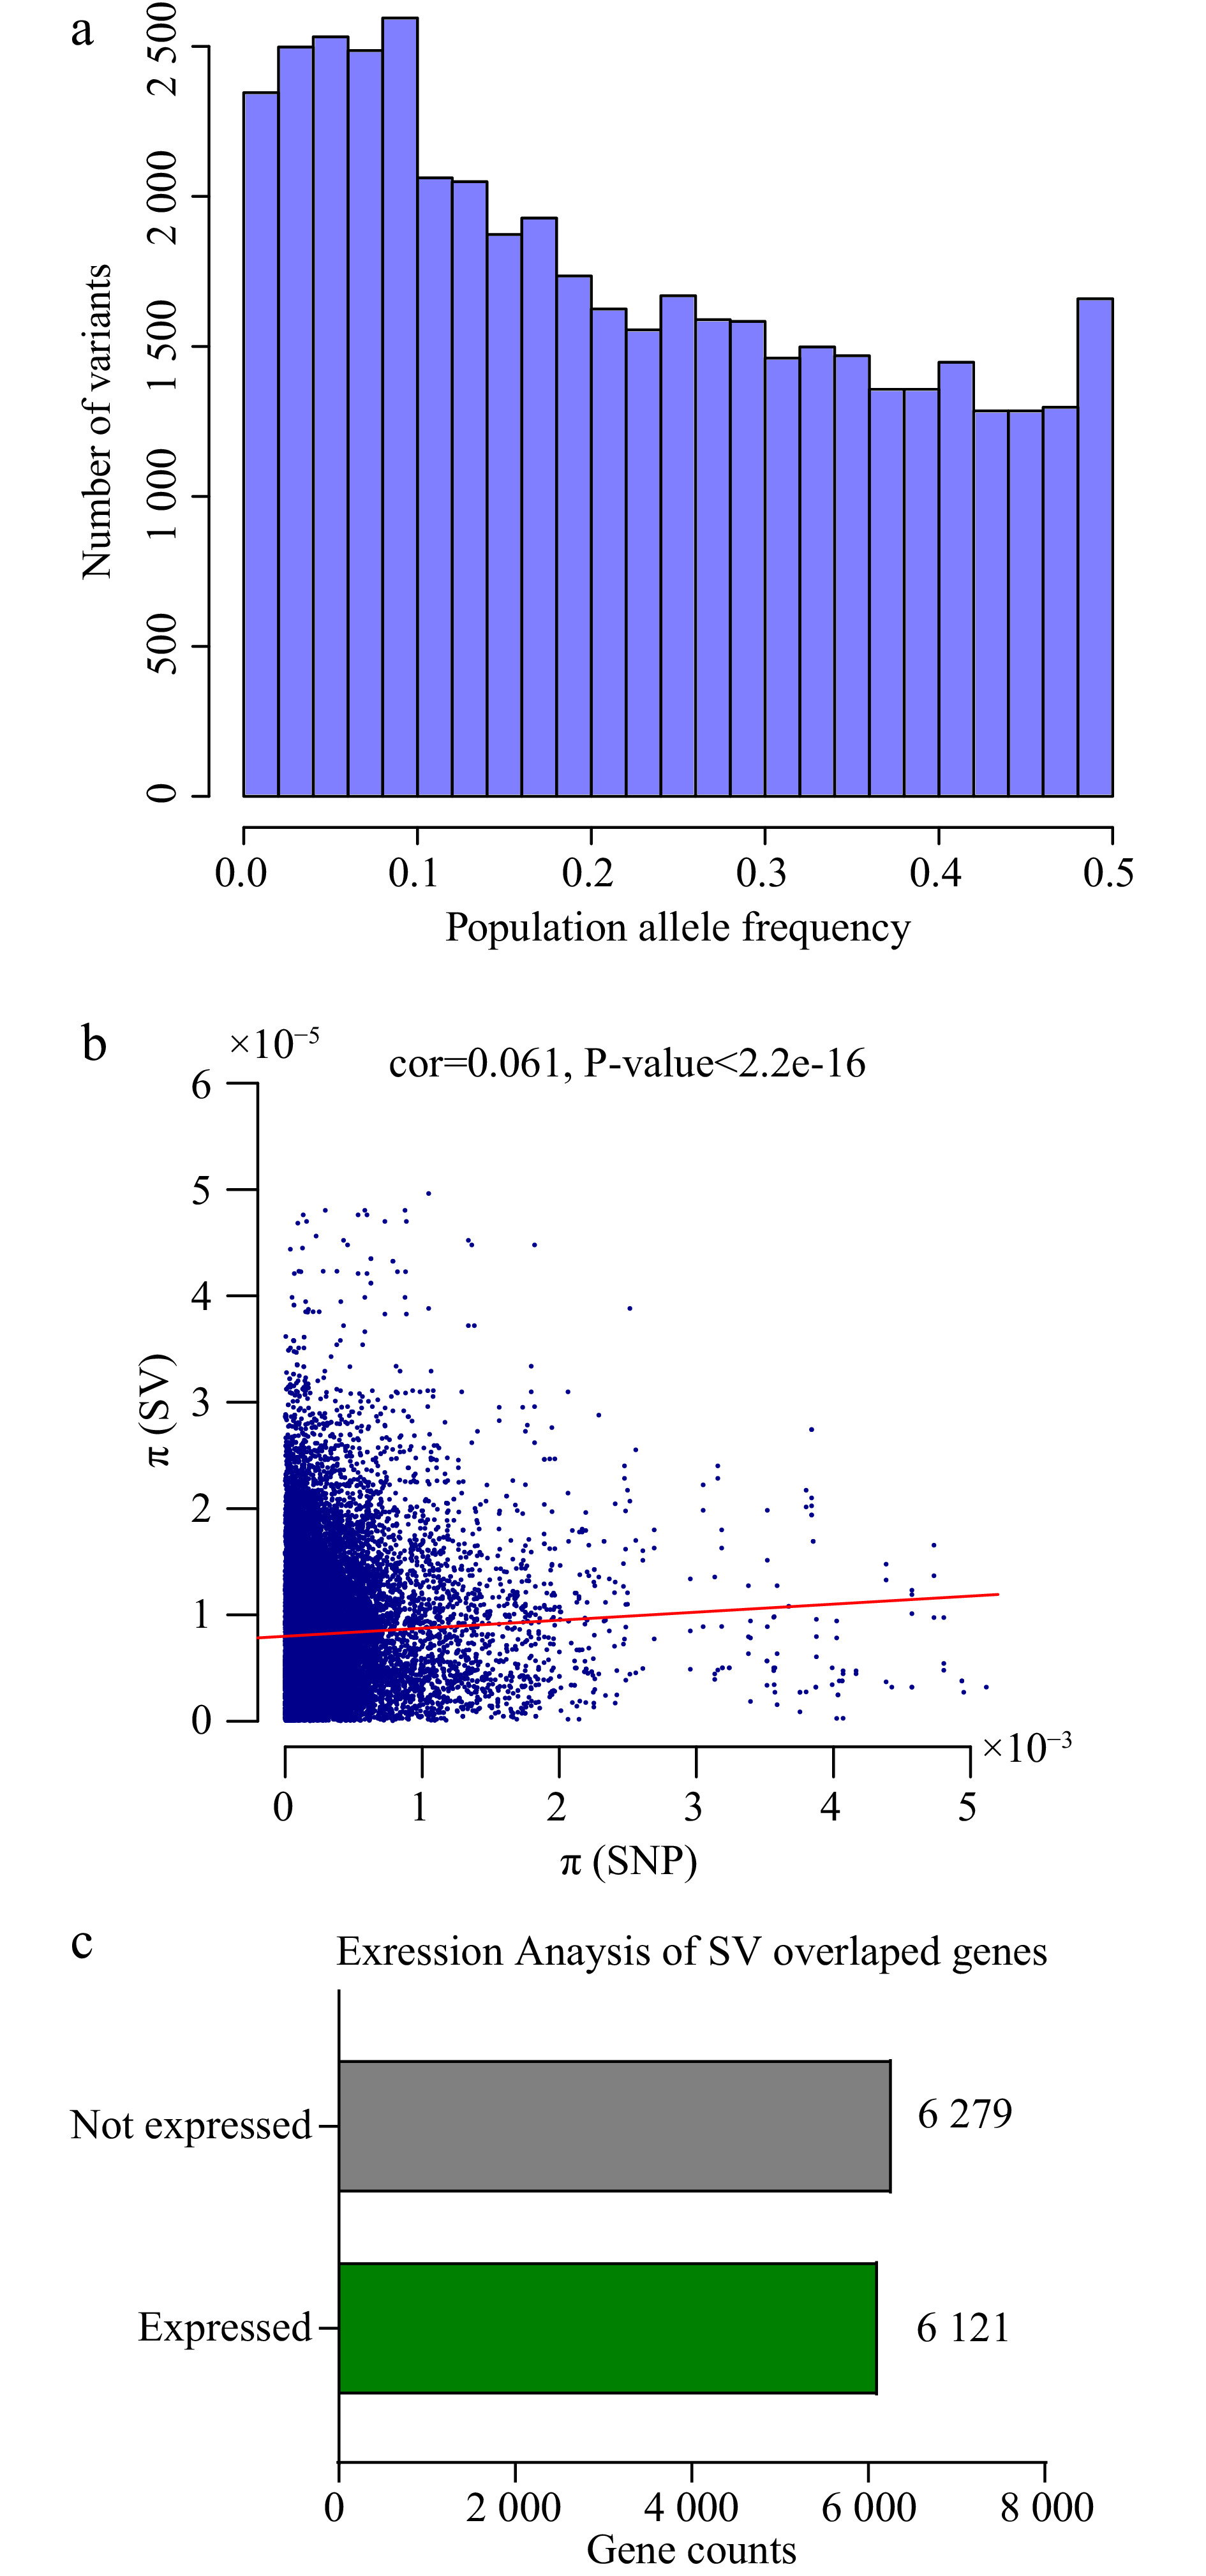
Figure 3.
Population information and expression level of SVs. (a) The barplot shows population allele frequency distribution of SVs. (b) The dotplot of SNPs and SVs genetic diversity (π) with 100kb windows of the genome, the red line accounts for the correlation (cor = 0.061, P < 2.2e-16). (c) Expression levels of SV overlapping genes (at least in one tissue) in six tissues of tea plant: root, stem, apical bud, young leaf, mature leaf and flower.
-
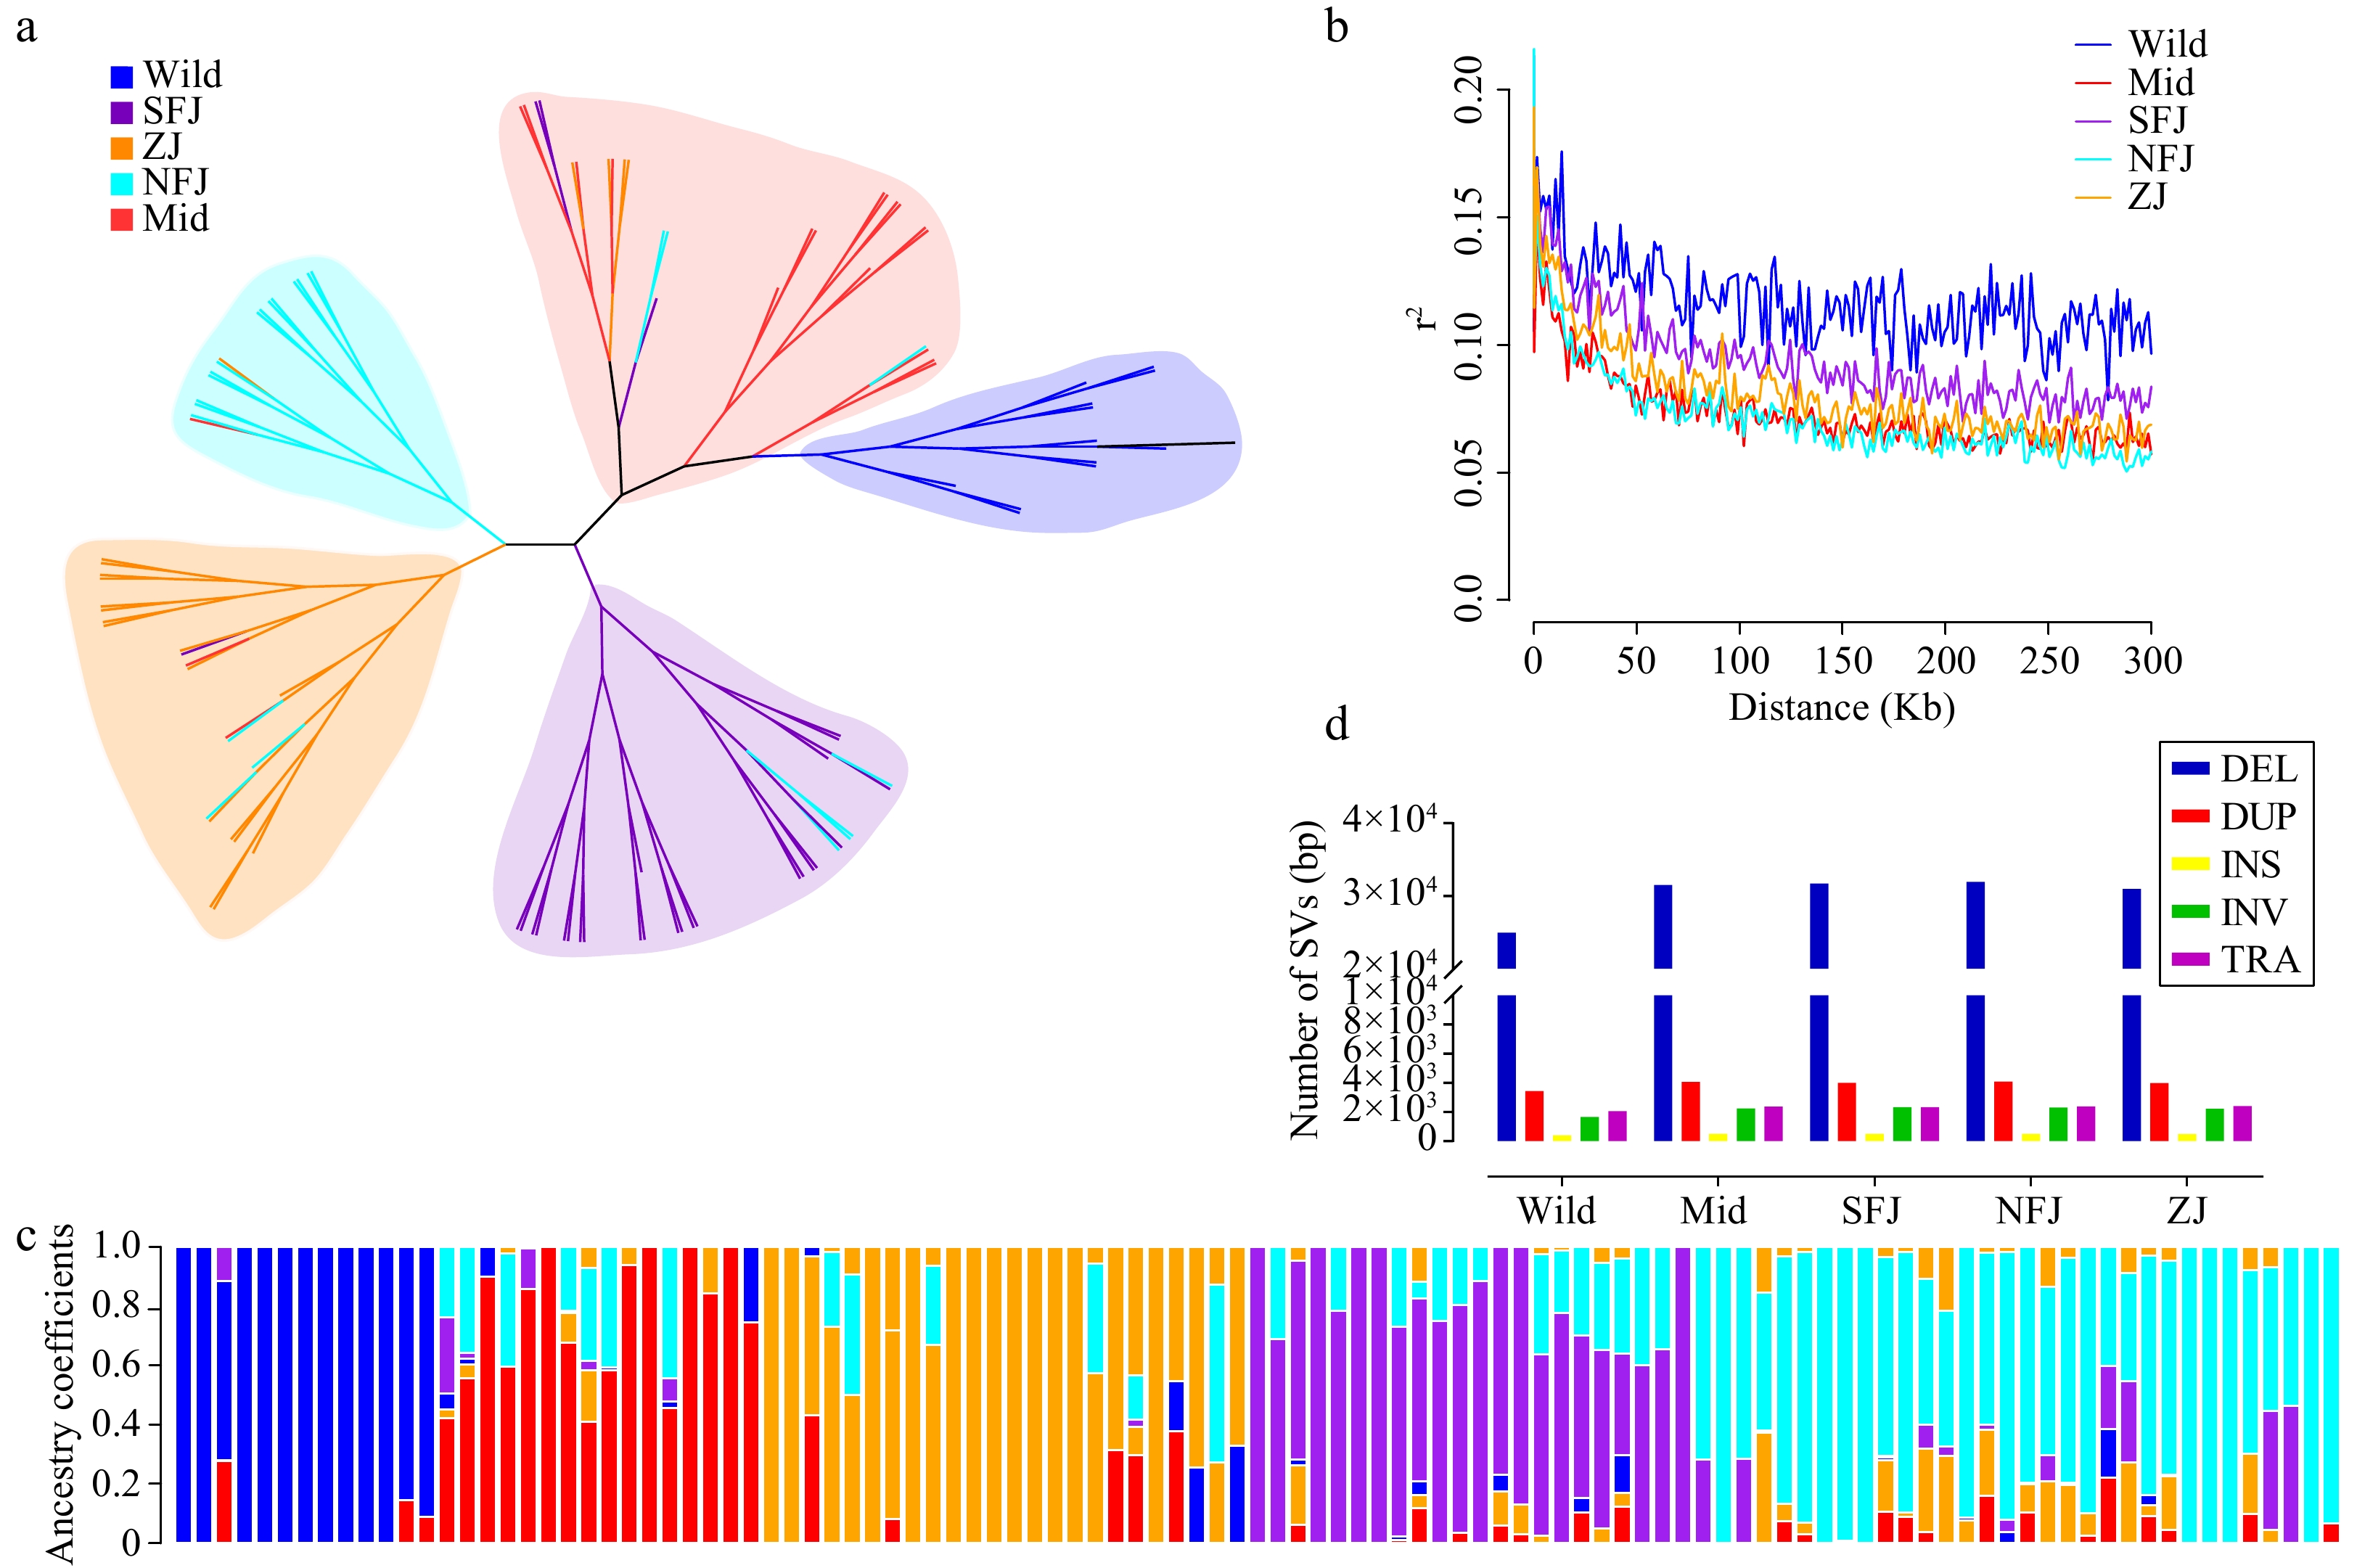
Figure 4.
Population structure analysis based on SVs. (a) The maximum likelihood phylogentic tree using 107 Camellia accessions (divided into five groups, different legend colors represent different sub populations, blue→ancient, red→Mid, orange→ZJ, cyan→NFJ, purple→SFJ). (b) Population LD decay anaysis. (c) Population structure inference based on SVs (K = 5). (d) Statistics of SVs in different sub populations.
-
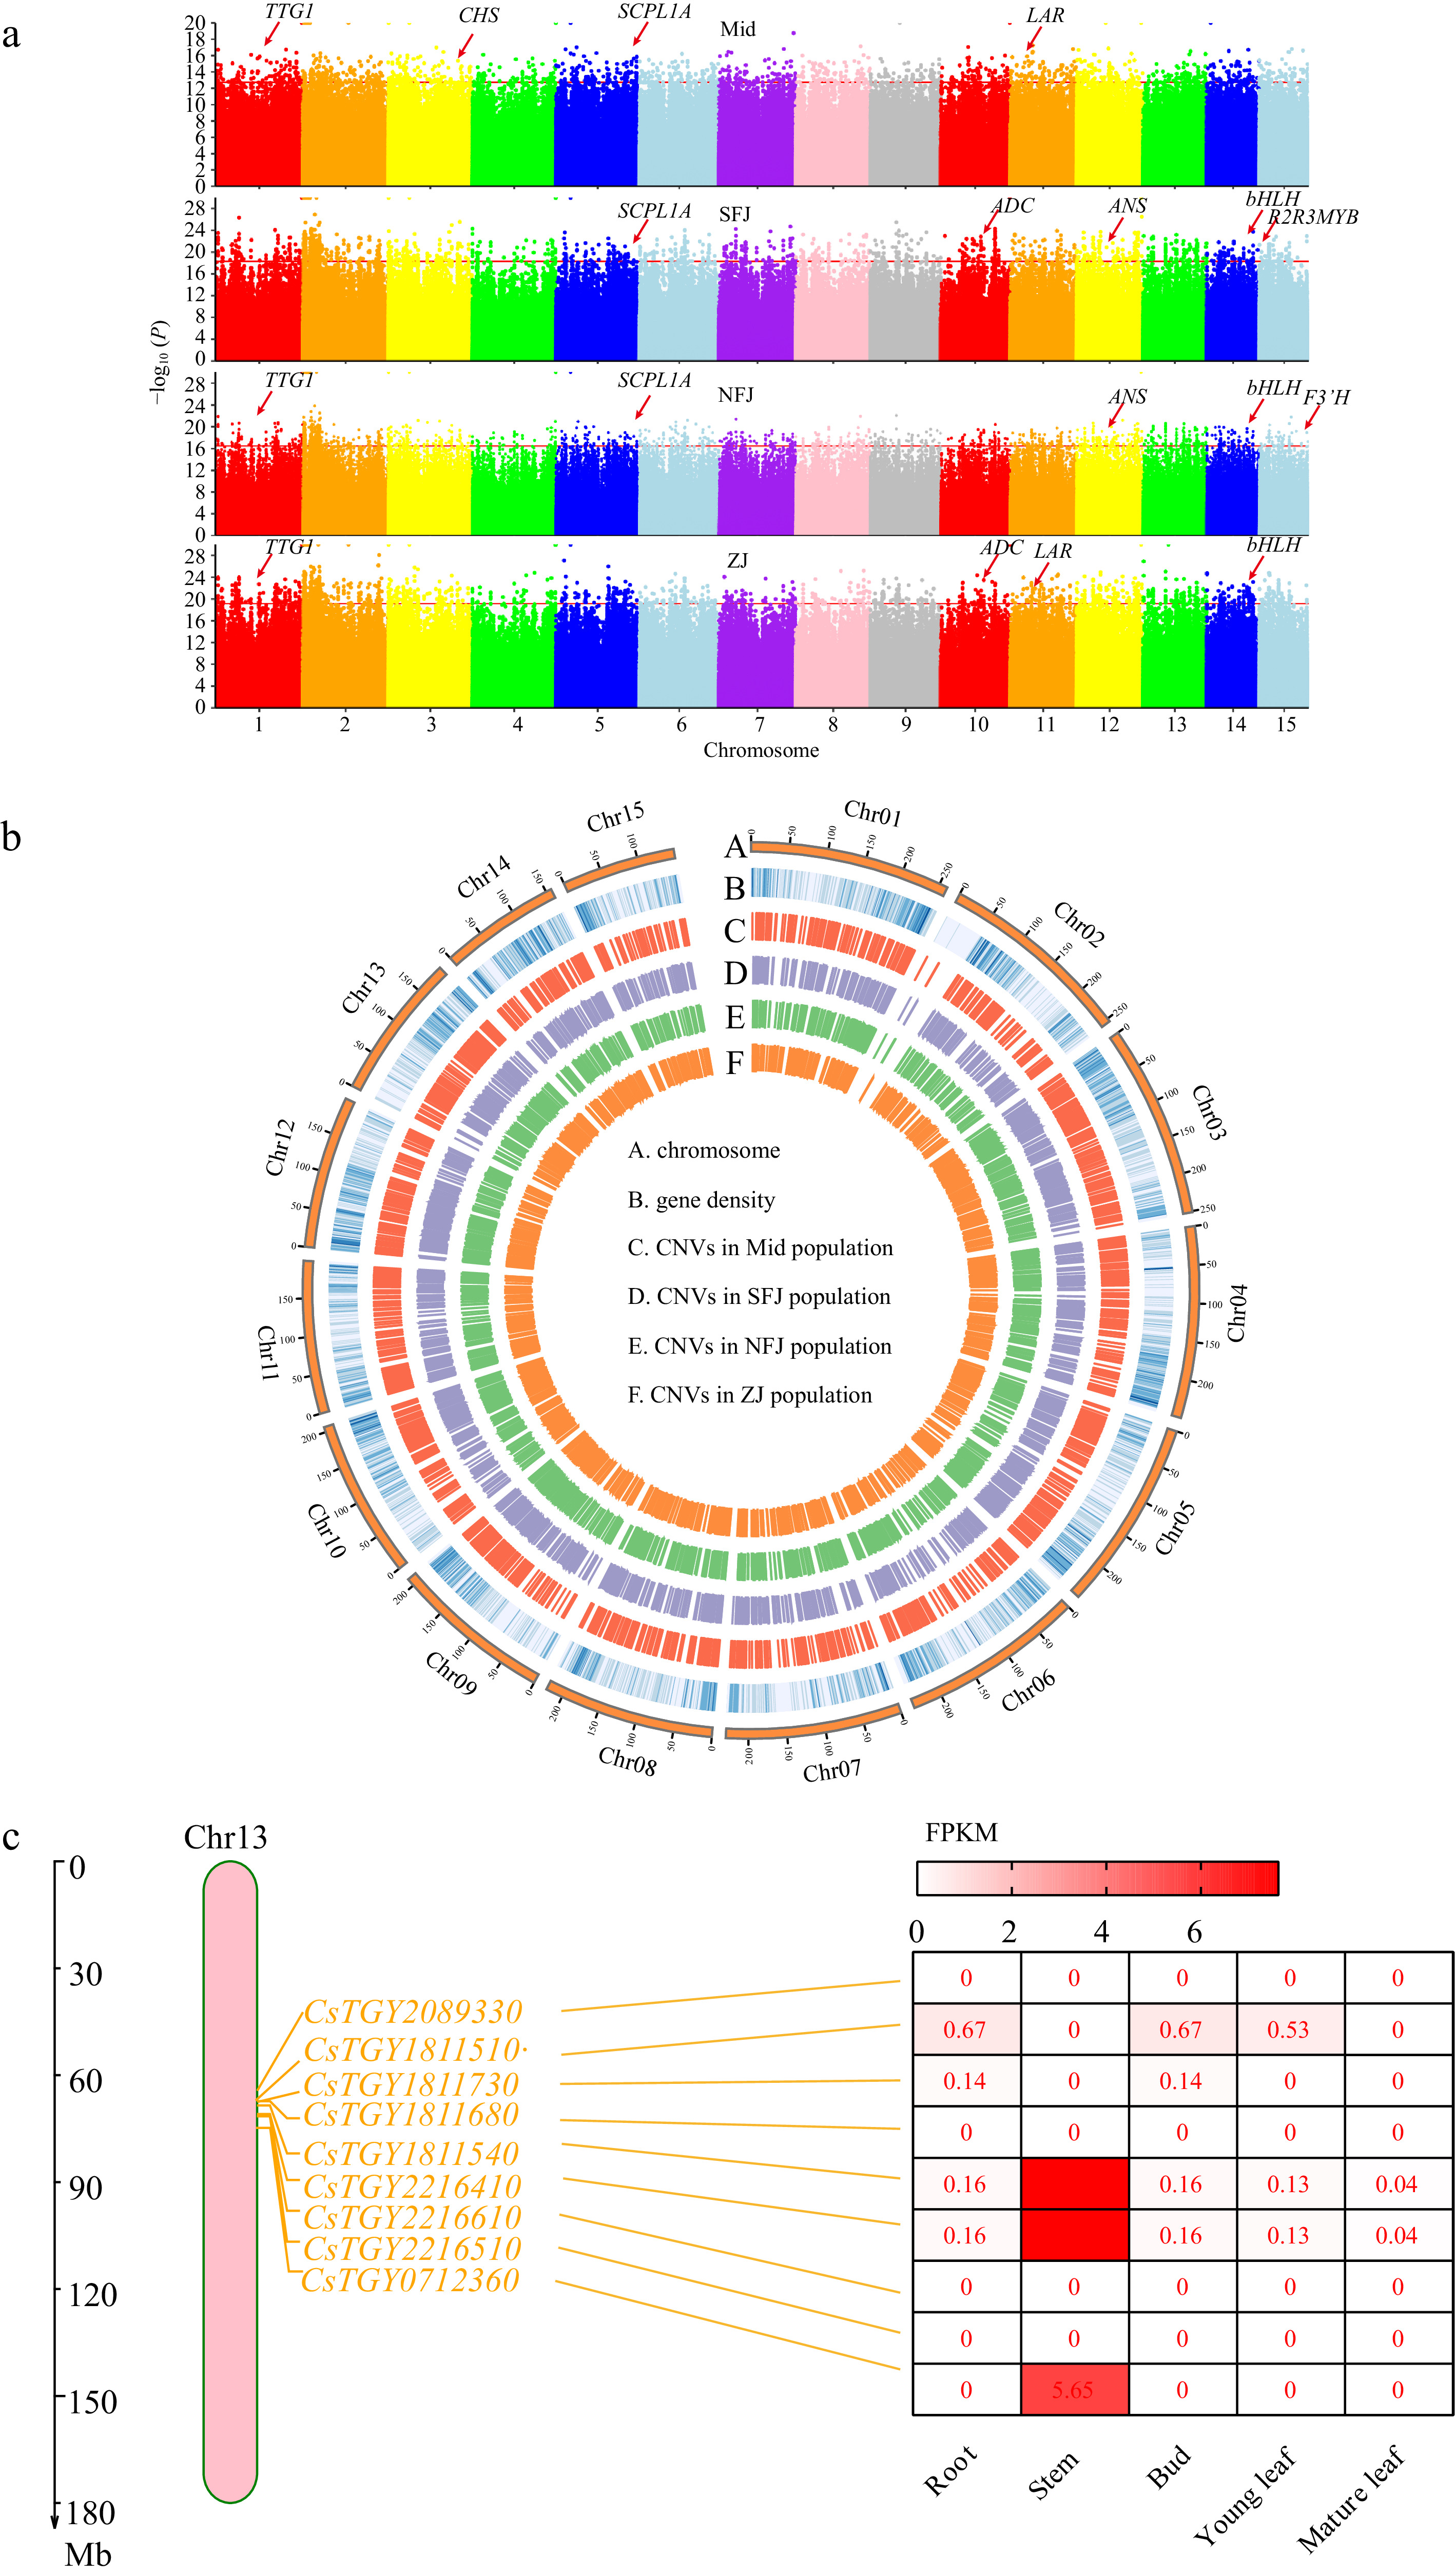
Figure 5.
Feature of CNVs associated with selection signals. (a) Manhattan plots of domesticated CNV sites based on 1kb windows in four sub populations (Mid, SFJ, NFJ and ZJ), genes associated with important functions of tea plant are highlighted in the Manhattan plots. (b) Distribution of CNVs across whole genome, circos plots represent CNV locations among four sub populations from the outside to the inside. (c) Under selected TPS family genes and these expression analysis on chromosome 13.
Figures
(5)
Tables
(0)