-

Figure 1.
Effect of biostimulants on (a) plant height, (b) stem diameter, (c) shoot dry weight, and (d) root dry weight. Each of the values is the mean of four independent replicates ± SE (n = 4). Values with different letters differ significantly at p ≤ 0.05. LSD = Least Significant Difference.
-

Figure 2.
Effect of biostimulants on (a) photosynthetic activity, and (b) leaf greenness (SPAD reading). Each of the values is the mean of four independent replicates ± SE (n = 4). Values with different letters differ significantly at p ≤ 0.05. LSD = Least Significant Difference.
-
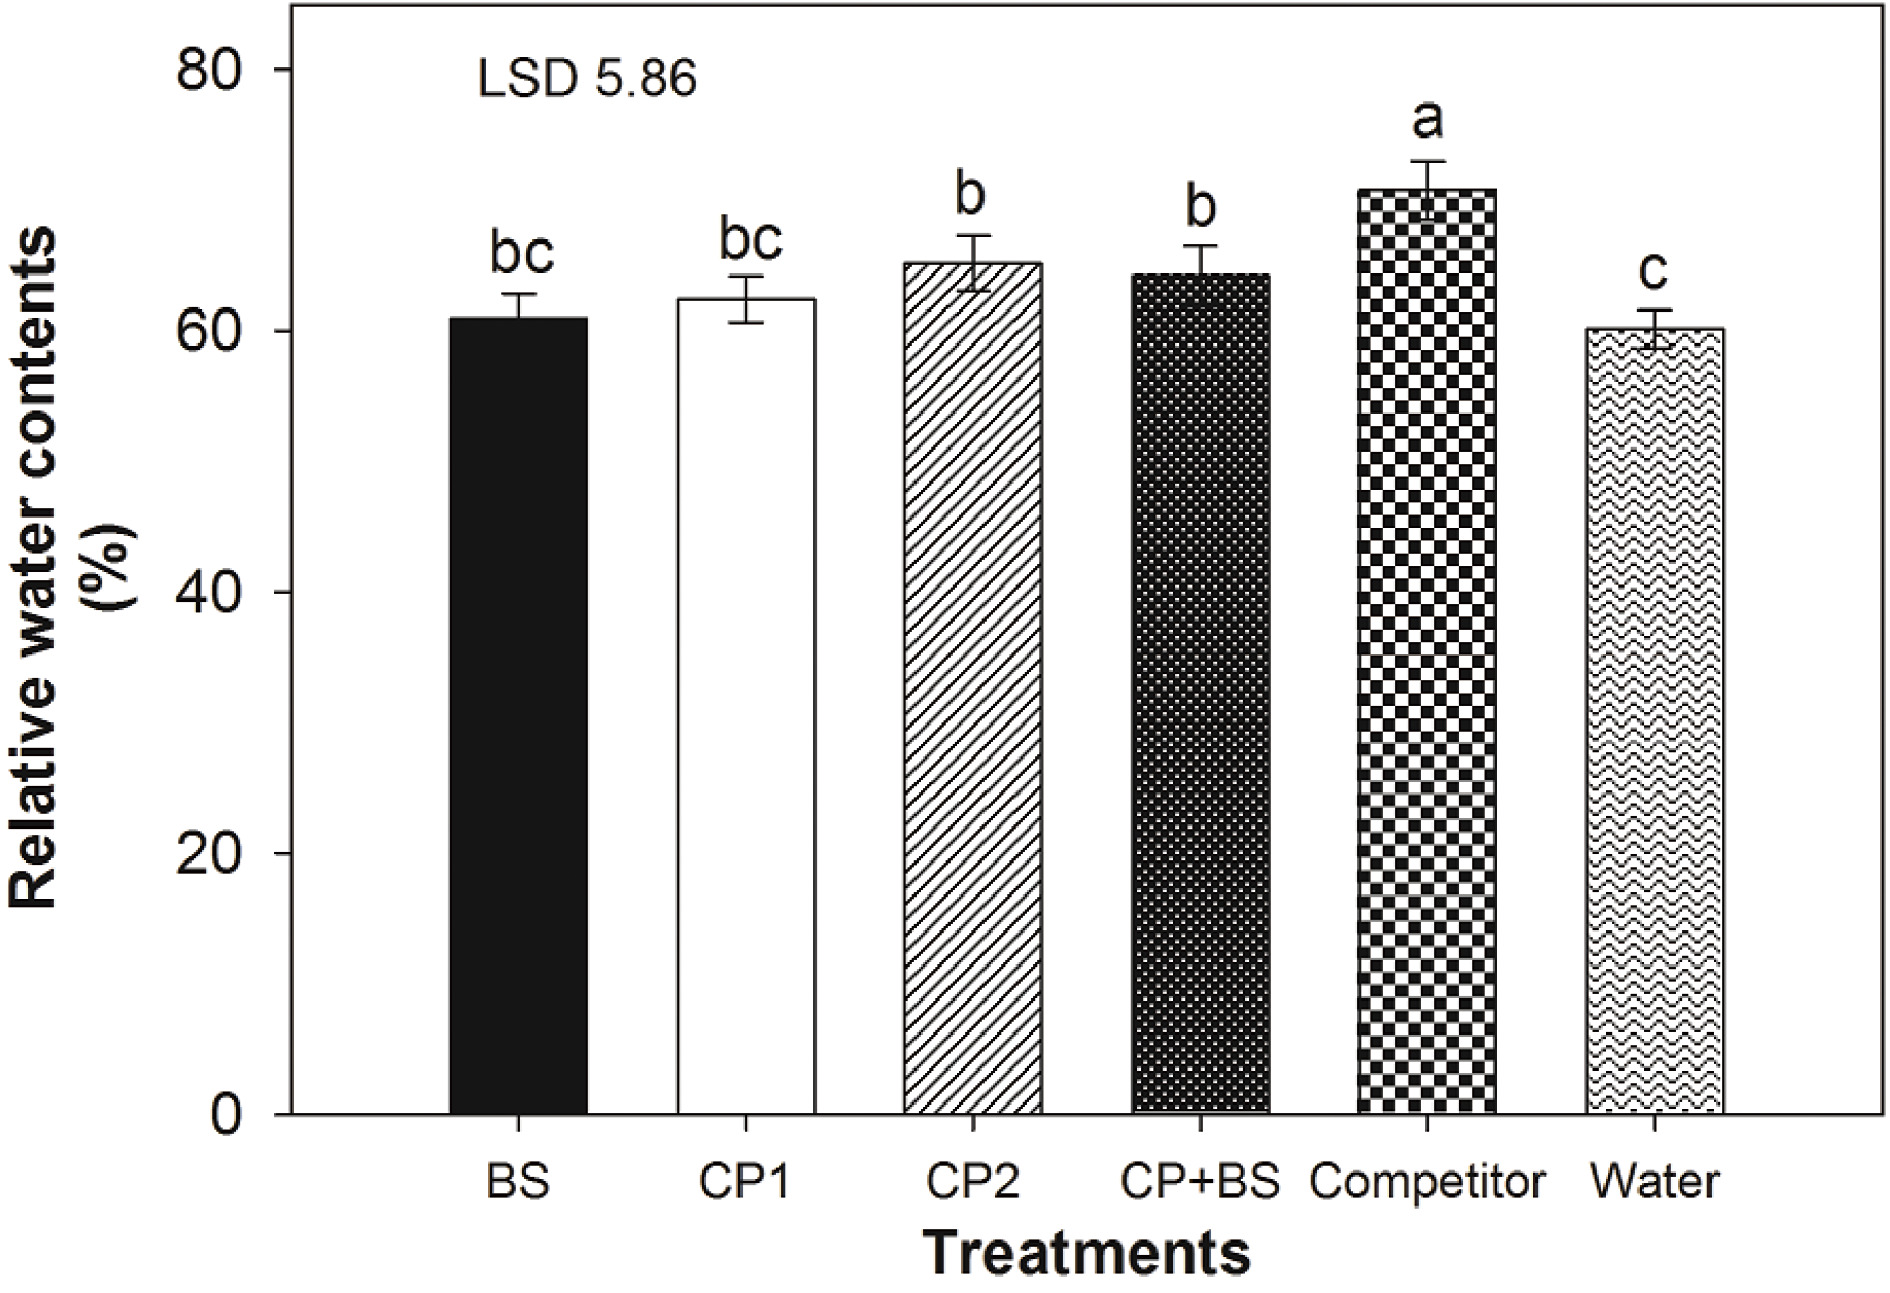
Figure 3.
Effect of biostimulants on relative water content (RWC). Each of the values is the mean of four independent replicates ± SE (n = 4). Values with different letters differ significantly at p ≤ 0.05. LSD = Least Significant Difference.
-

Figure 4.
Effect of biostimulants on the concentration of Ca, K, Mg, and P both in leaves (left side) and roots (right side). Each of the values is the mean of four independent replicates ± SE (n = 4). Values with different letters differ significantly at p ≤ 0.05. LSD = Least Significant Difference.
-

Figure 5.
Effect of biostimulants on nitrate concentration in leaf petioles. Each of the values is the mean of four independent replicates ± SE (n = 4). Values with different letters differ significantly at p ≤ 0.05. LSD = Least Significant Difference
-

Figure 6.
Effect of biostimulants on (a) nitrate reductase activity, and (b) nitrite reductase activity. Each of the values is the mean of four independent replicates ± SE (n = 4). Values with different letters differ significantly at p ≤ 0.05. LSD = Least Significant Difference.
-
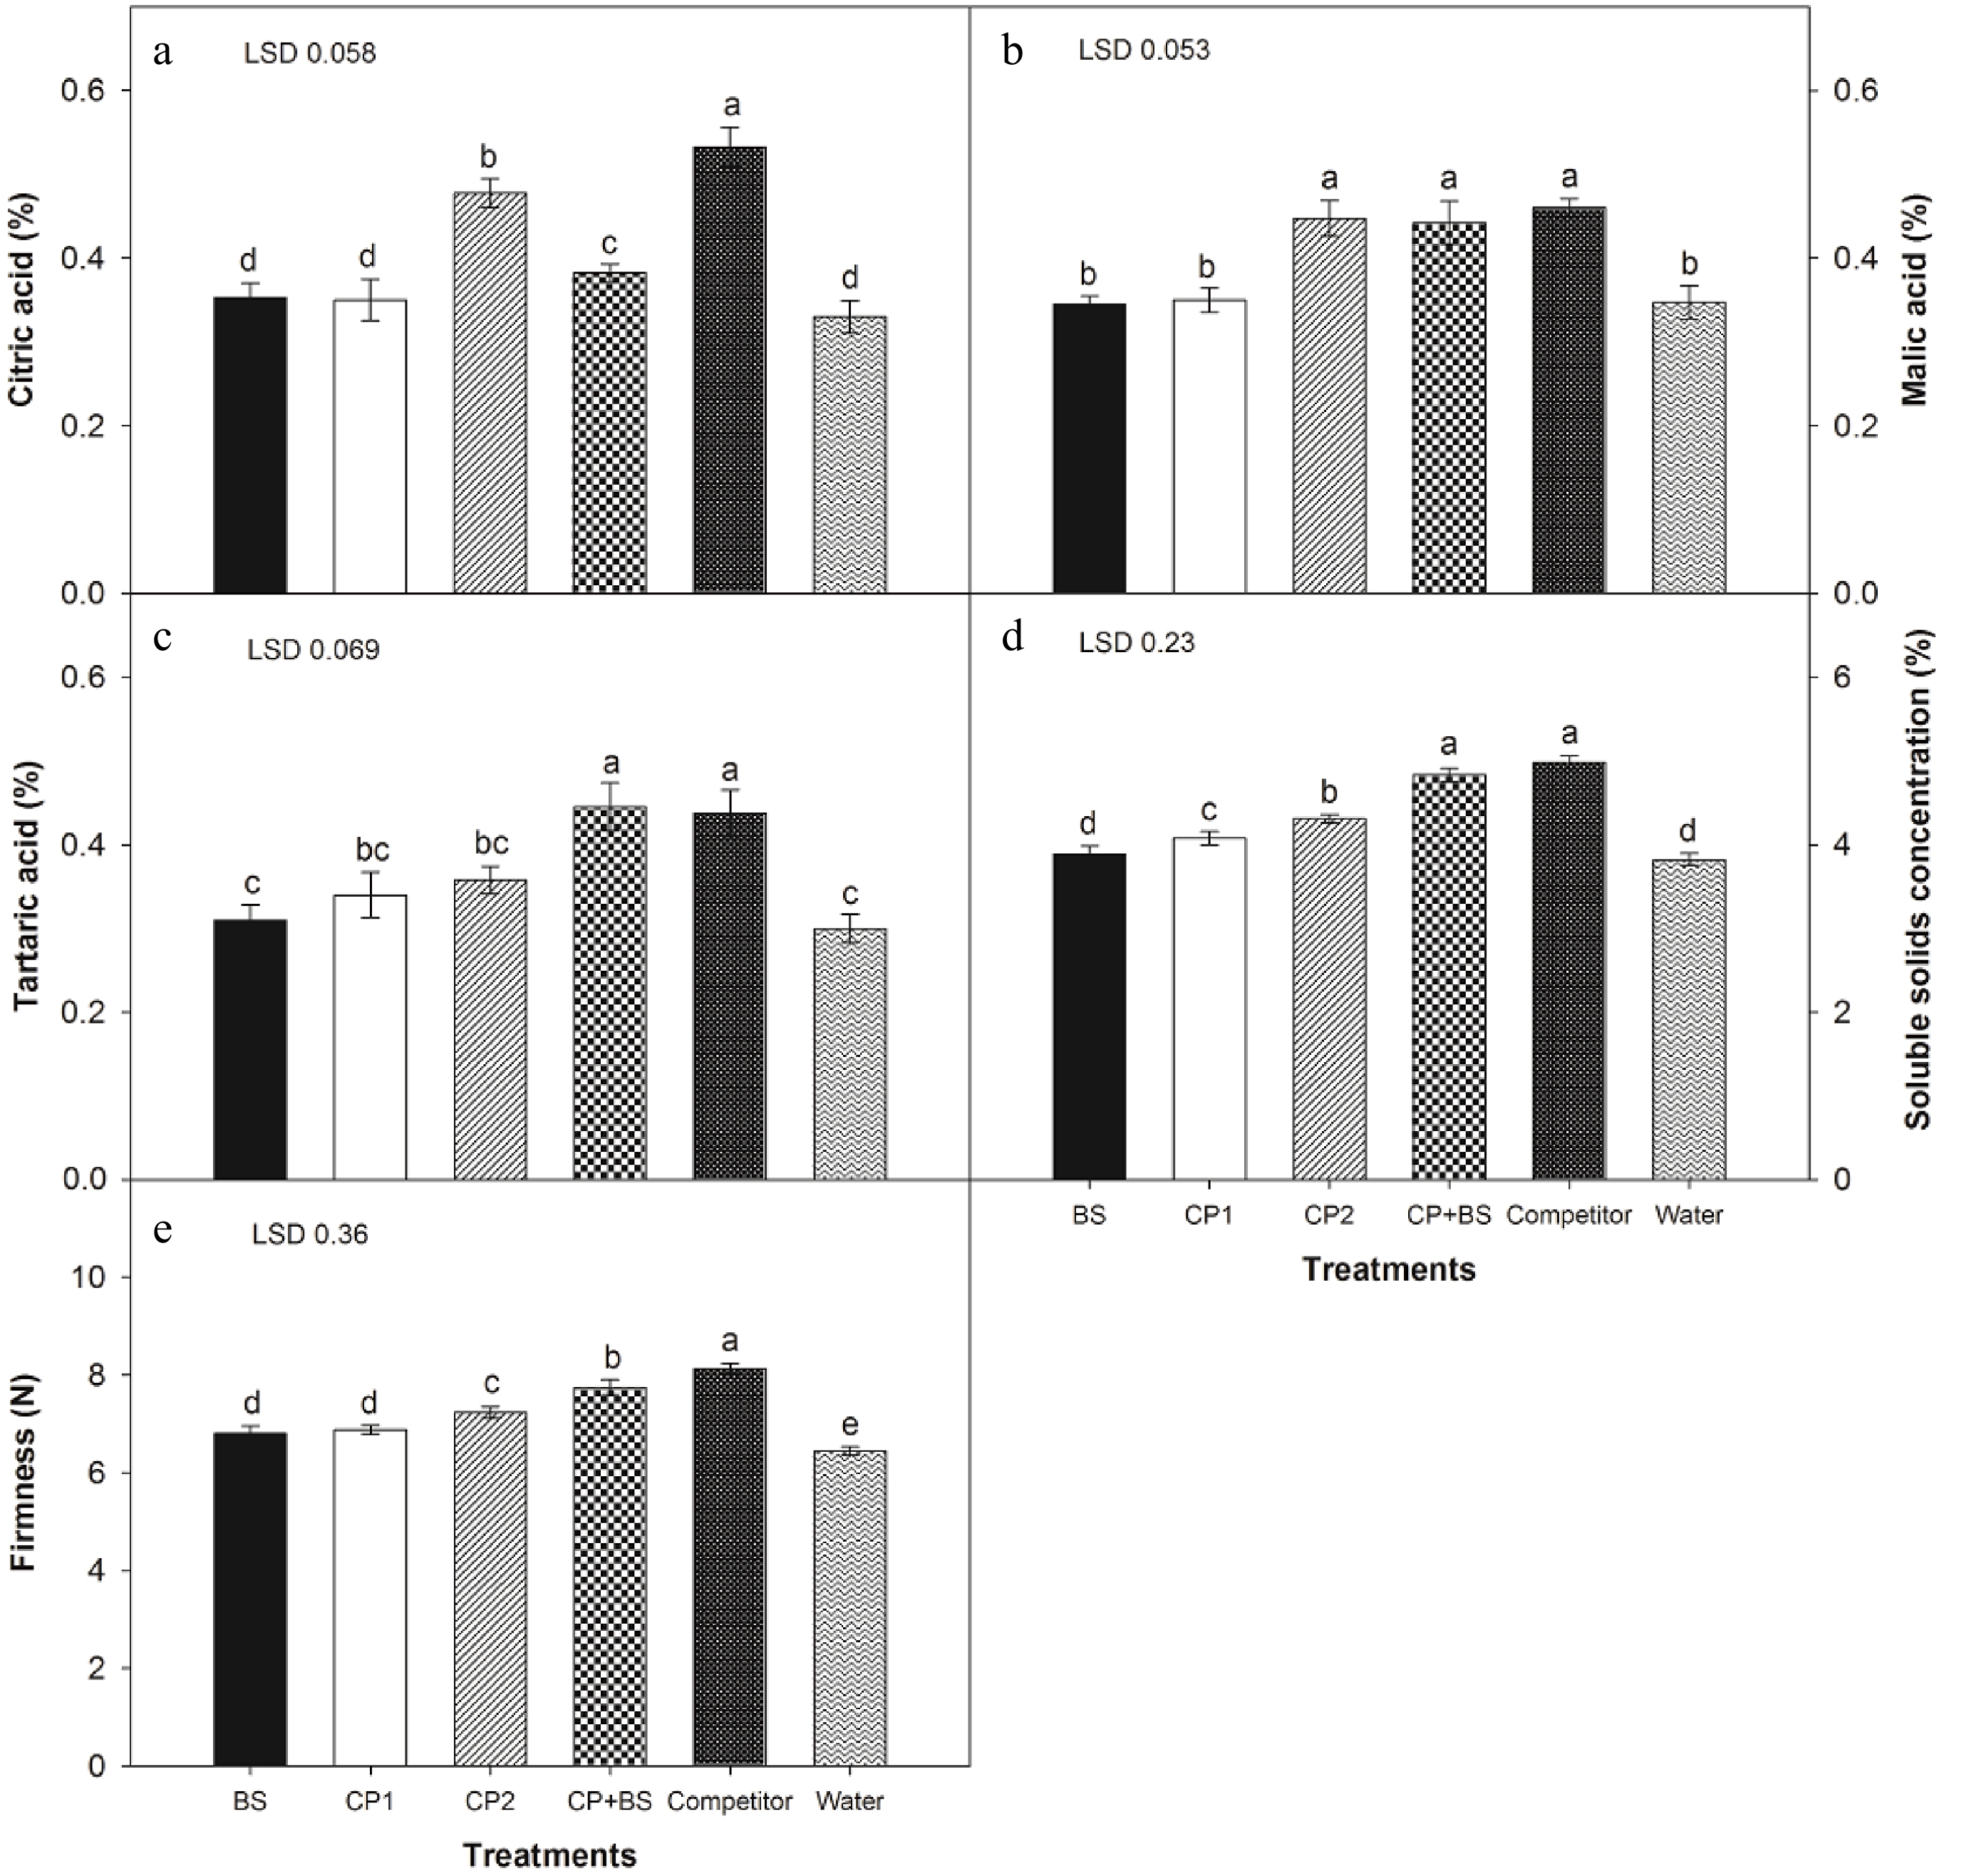
Figure 7.
Effect of biostimulants on (a) citric acid, (b) malic acid, (c) tartaric acid, (d) soluble solid concentration, and (e) fruit firmness. Each of the values is the mean of four independent replicates ± SE (n = 4). Values with different letters differ significantly at p ≤ 0.05. LSD = Least Significant Difference.
-
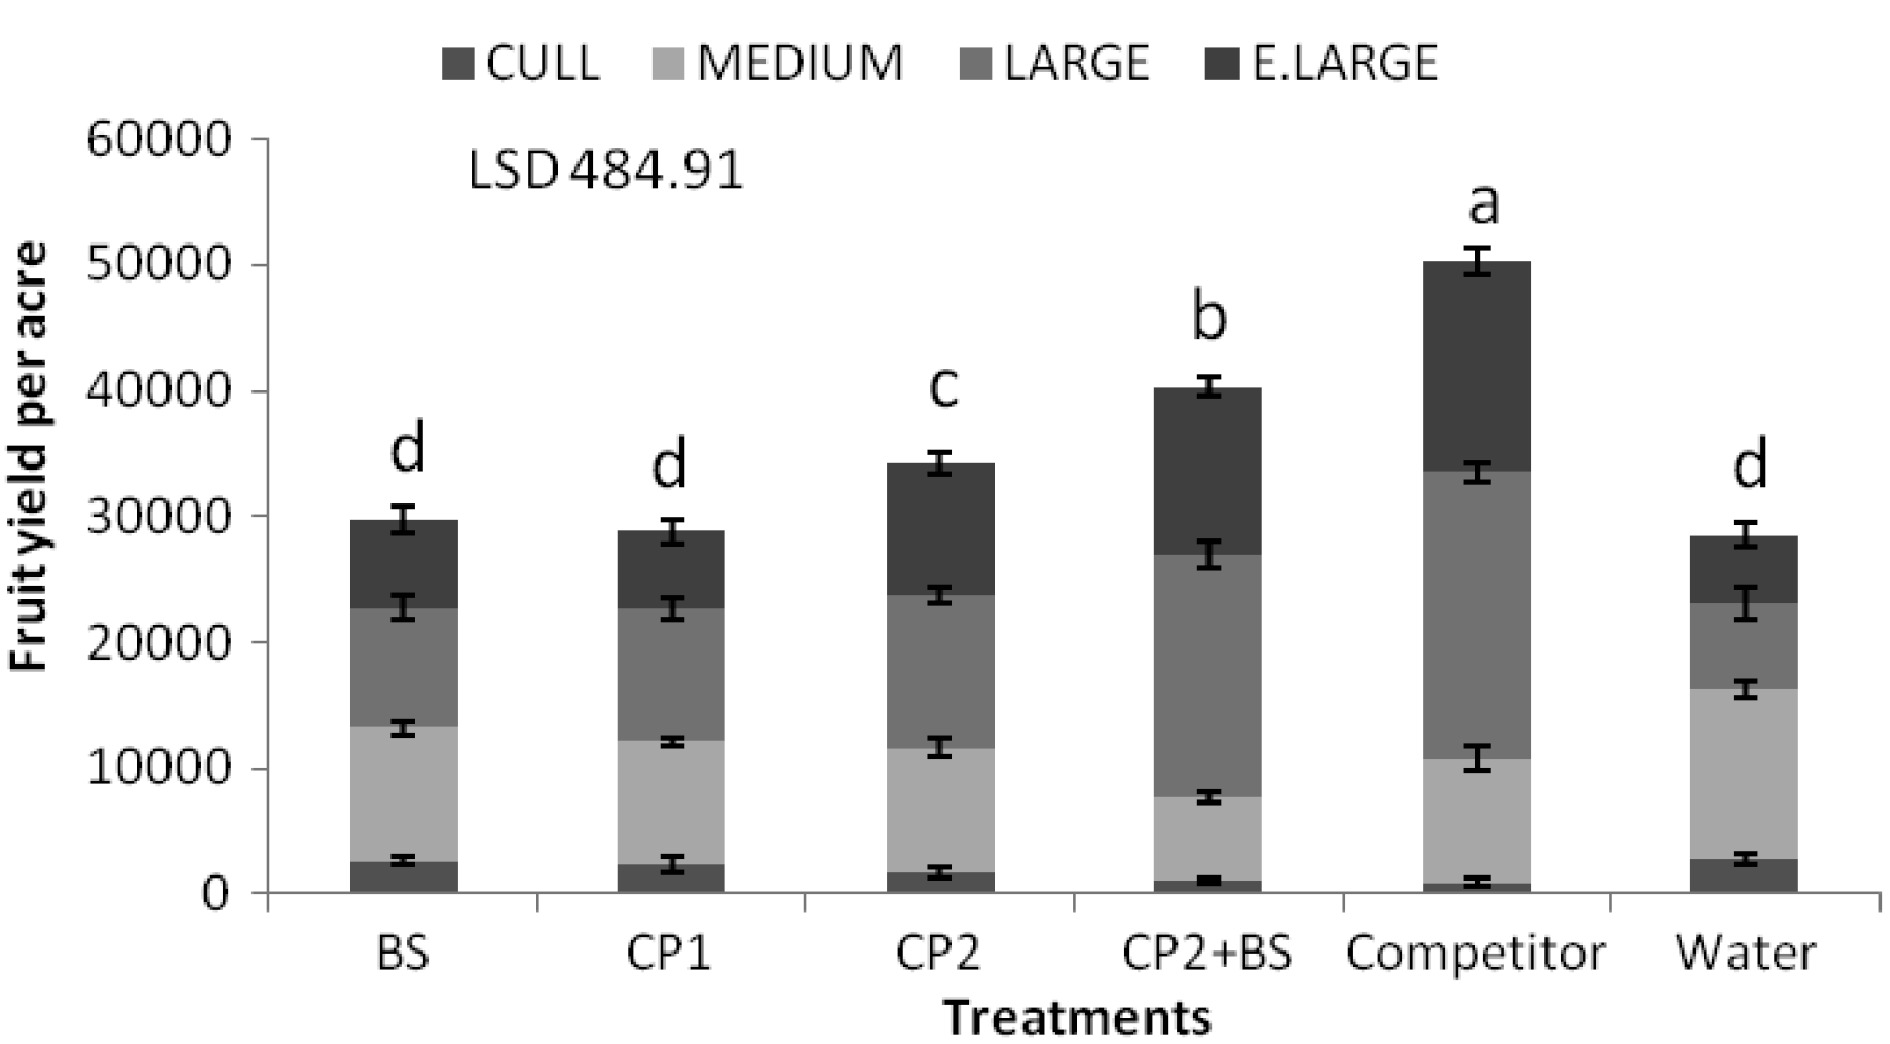
Figure 8.
Effect of biostimulants on fruit yield. Each of the values is the mean of four independent replicates ± SE (n=4). Values with different letters differ significantly at p ≤ 0.05. LSD = Least Significant Difference.
Figures
(8)
Tables
(0)