-

Figure 1.
Description of the leaf, root and litter N and P stoichiometry (n = 21). N, nitrogen; P, phosphorus; N:P ratio, the ratio of nitrogen and phosphorus.
-

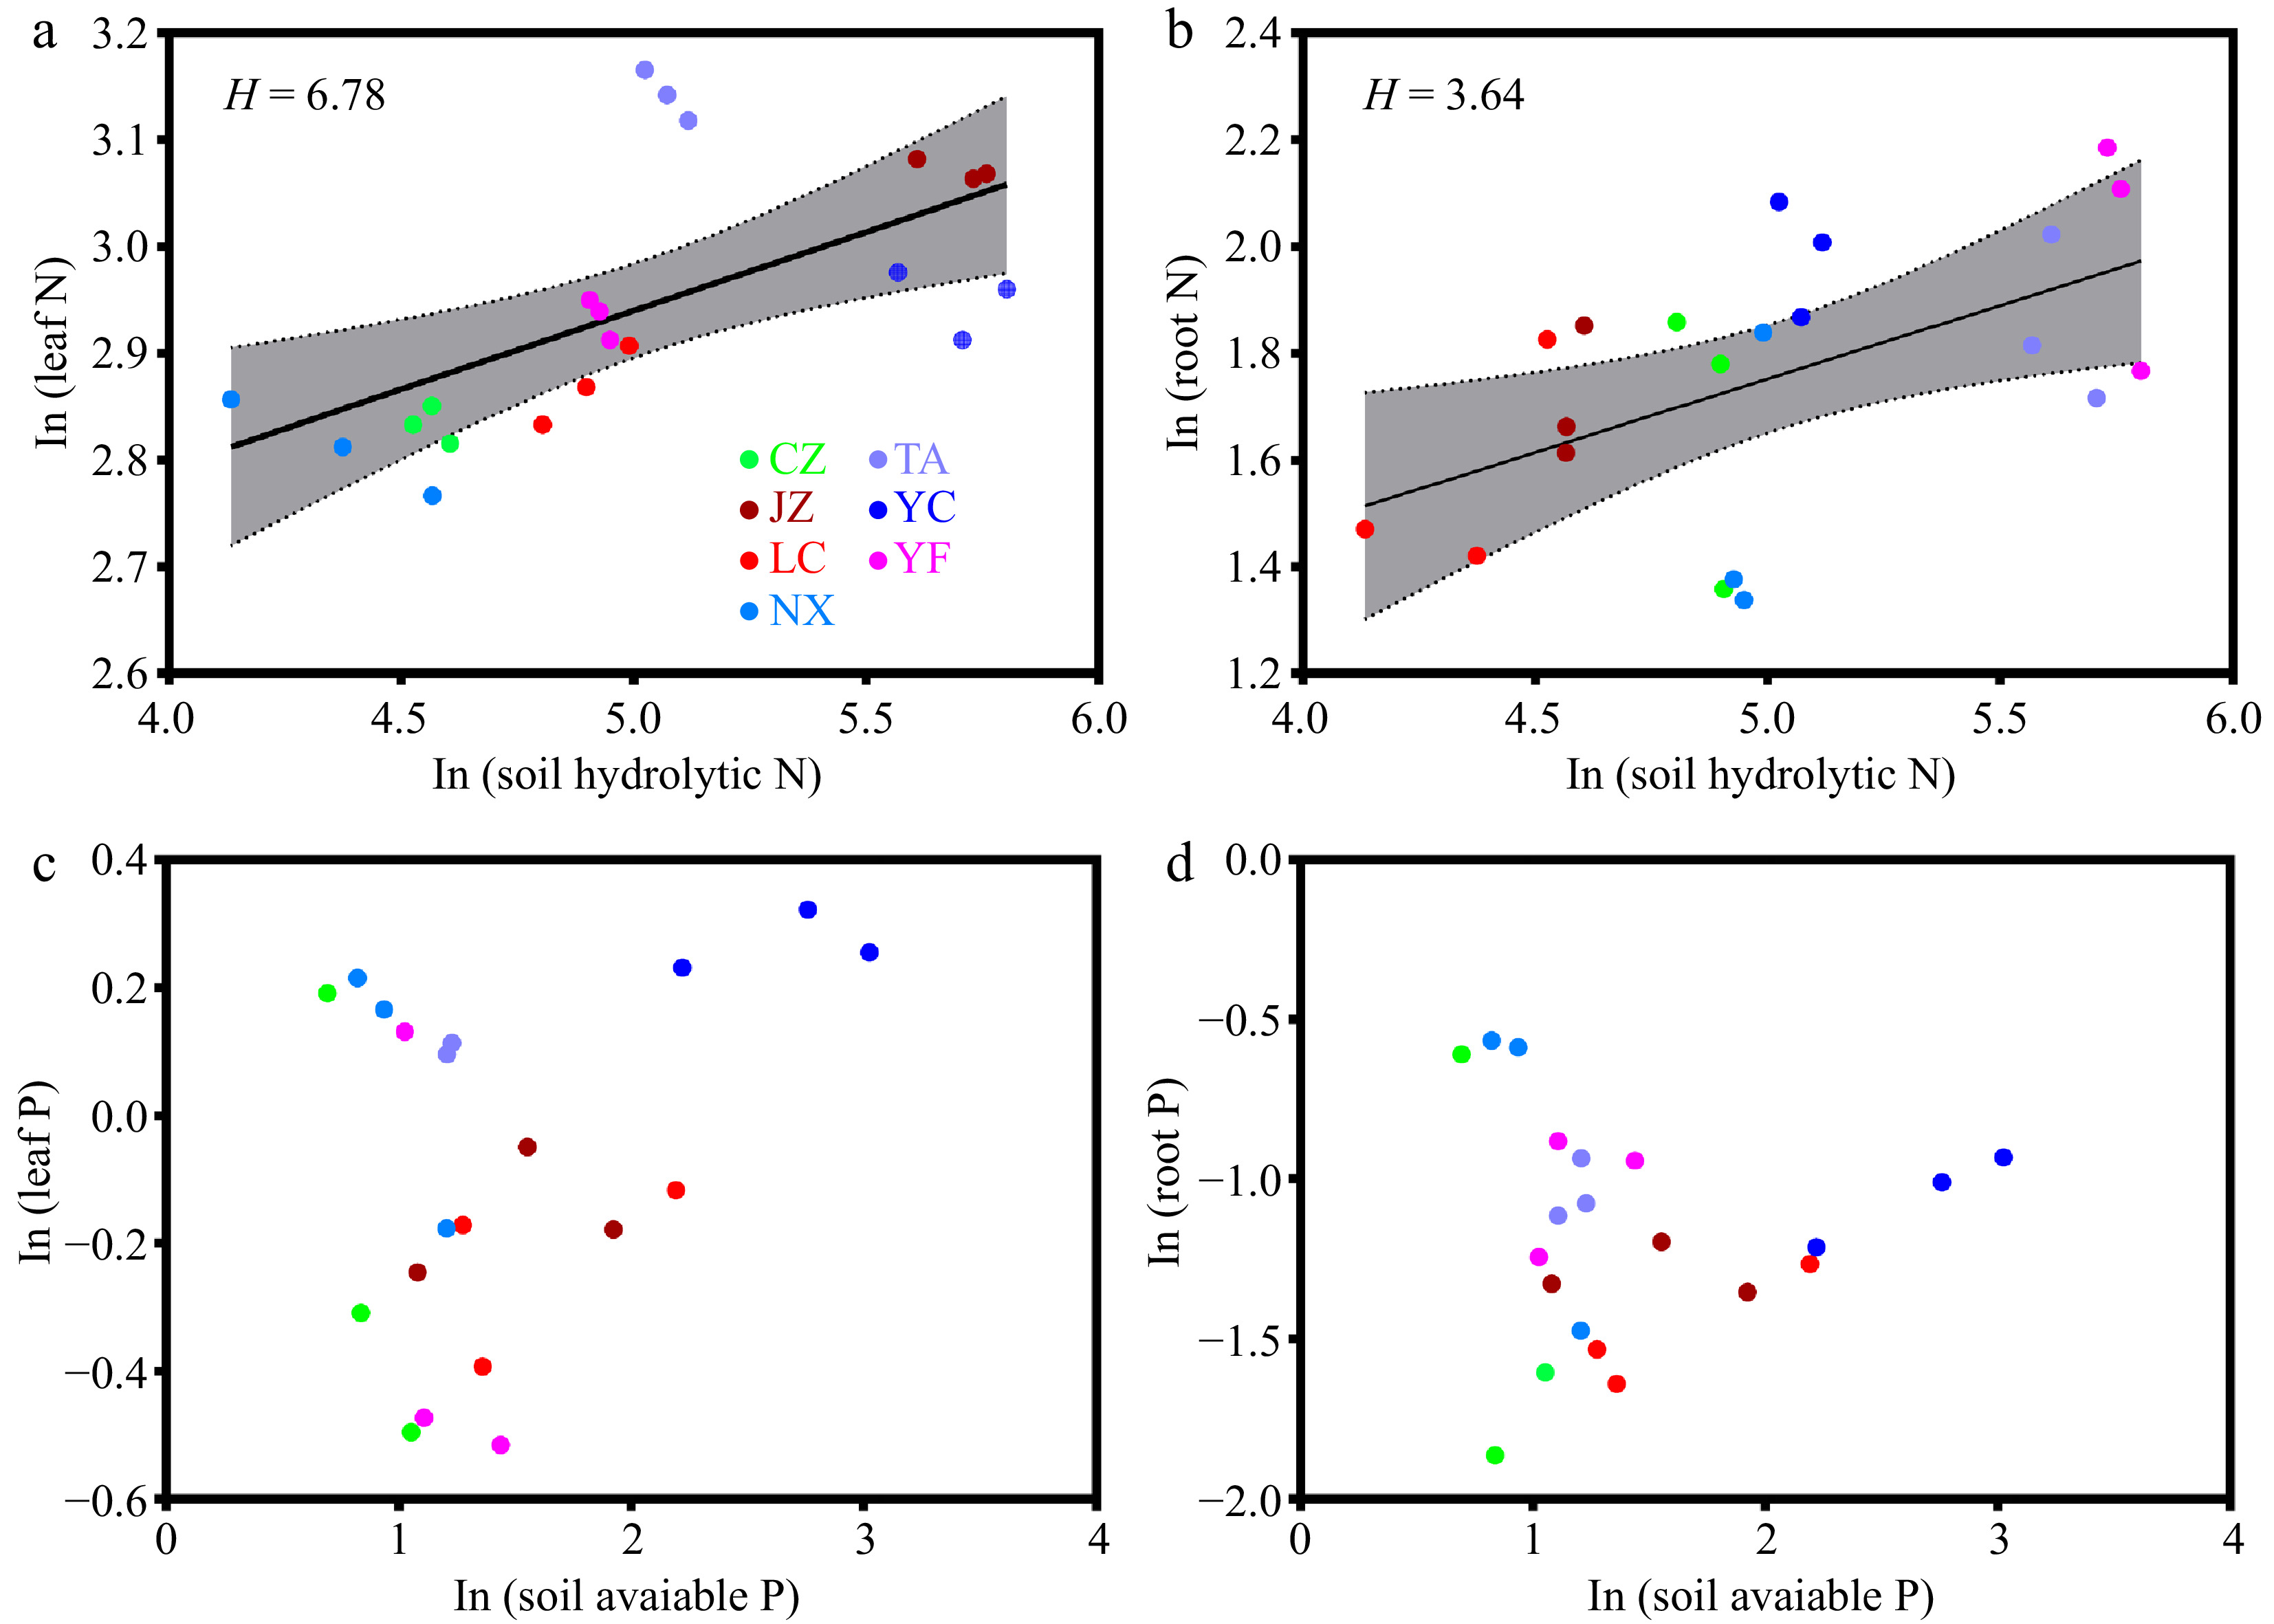
Figure 2.
Relationships between N and P in the leaf and root, and soil available nutrient values (n = 21). Different color dots represent samples from different sampling sites. More specifically, LC, Lechang, Guangdong Province; JZ, Jingzhou, Hunan Province; YF, Yifeng, Jiangxi Province; CZ, Chuzhou, Anhui Province; YC, Yichang, Hubei Province; NX, Neixiang, Henan Province; TA, Tai'an, Shandong Province.
-

Figure 3.
Trends of nutrient limitation and nutrient acquisition with latitude (n = 21). NRE, nitrogen resorption efficiency; PRE, phosphorus resorption efficiency; RSAF-N, root-soil accumulation factor of nitrogen; RSAF-P, root-soil accumulation factor of phosphorus.
-

Figure 4.
Predicted partial least squares path modeling (PLS-PM) for the direct and indirect associations between latitude and nutrient acquisition (n = 21). Ellipses represent the structural model, and boxes represent corresponding measurement models. In the structural model, the lines indicate paths, and the values adjacent to the lines denote the magnitude of the path coefficients calculated by PLS regression. R2 values are shown for all endogenous latent variables in the ellipses. Values in the measurement model represent the loadings between a latent variable and its indicators. The figure shows the final models after model diagnostic processes. All values in the measurement model exceeded 0.70. The pseudo goodness-of-fit (GoF) of the model was 0.6698 for the association between latitude and NuRE and 0.7274 for the association between latitude and RSAF, implying that the predicted models fit well. LAT, latitude; LON, longitude; ALT, altitude; MAP, mean annual precipitation; MAT, mean annual temperature; UVB, type B ultraviolet radiation; SOC, soil organic carbon; SHN, soil hydrolytic nitrogen; SAP, soil available phosphorus; SN:P, soil hydrolytic nitrogen to soil available phosphorus ratio. DBH, diameter at breast height; H, height; SLA, specific leaf area.
Figures
(4)
Tables
(0)