-

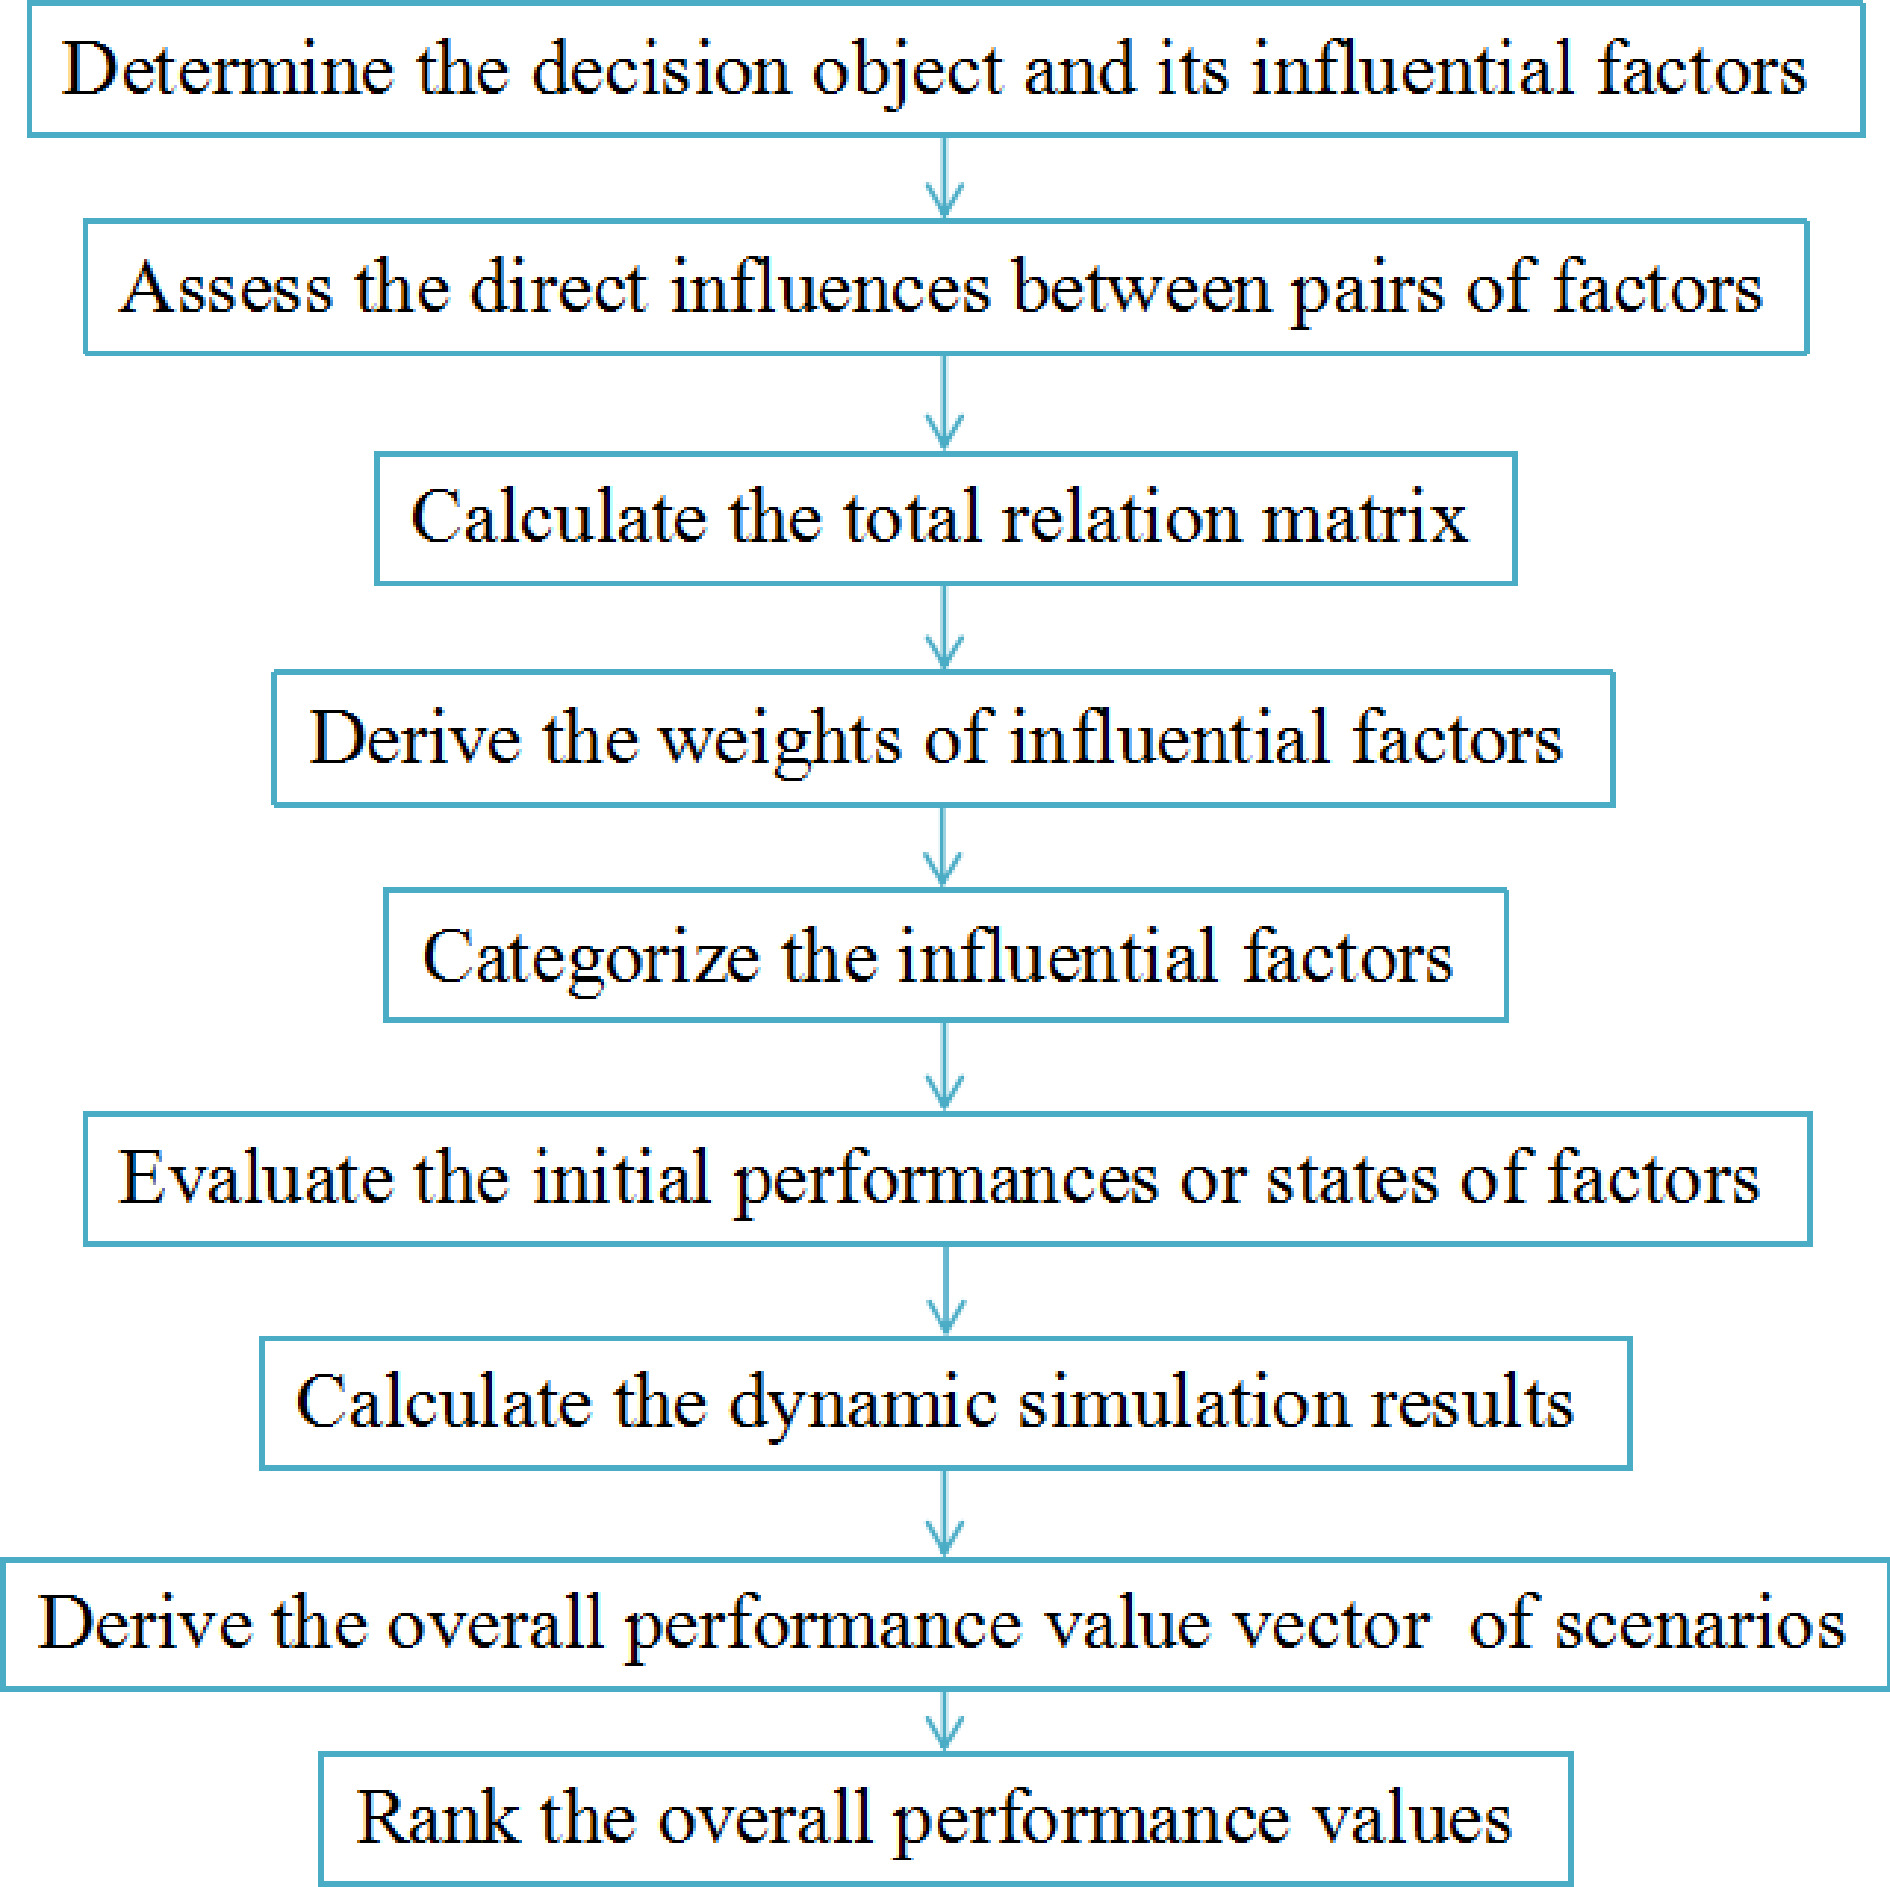
Figure 1.
Flowchart of the suggested method.
-

Figure 2.
Causal diagrams of factors of emergency scenarios
$ {{\hat e}}_1^{{{{t}}_1}} $ $ {{\hat e}}_2^{{{{t}}_1}} $ $ {{\hat e}}_1^{{{{t}}_1}} $ $ {{\hat e}}_2^{{{{t}}_1}} $ -

Figure 3.
Evolutions of simulation performance or state values of factors of emergency scenarios
$ {{\hat e}}_1^{{{{t}}_1}} $ $ {{\hat e}}_2^{{{{t}}_1}} $ $ {{\hat e}}_1^{{{{t}}_1}} $ $ {{\hat e}}_2^{{{{t}}_1}} $ -

Figure 4.
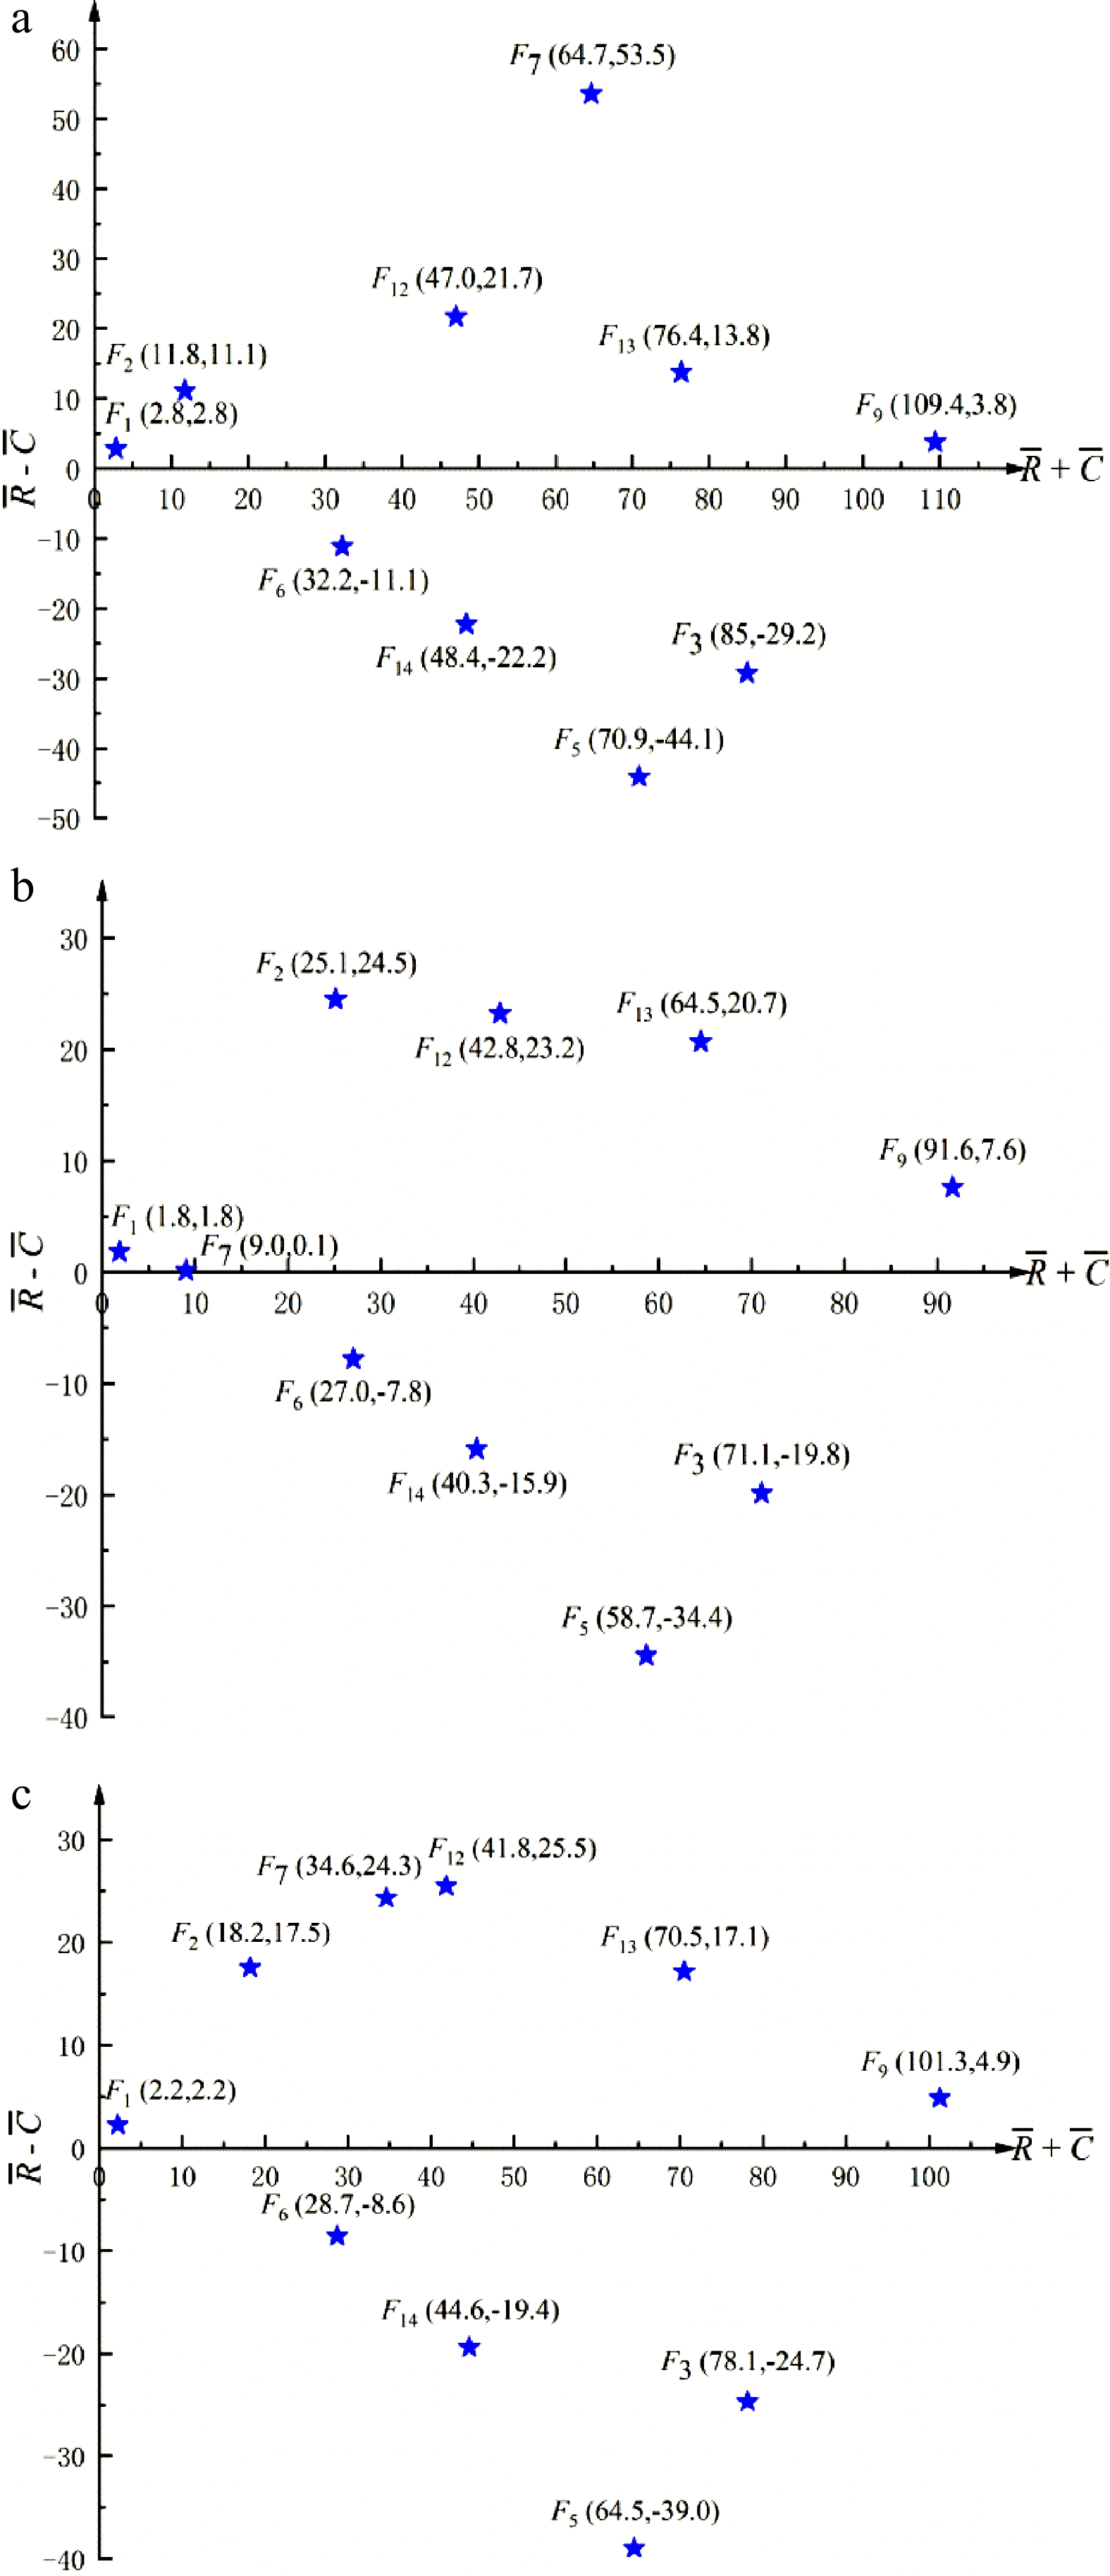
Causal diagrams of factors of emergency scenarios
$ {{\hat e}}_1^{{{{t}}_2}} $ $ {{\hat e}}_2^{{{{t}}_2}} $ $ {{\hat e}}_3^{{{{t}}_2}} $ $ {{\hat e}}_1^{{{{t}}_2}} $ $ {{\hat e}}_2^{{{{t}}_2}} $ $ {{\hat e}}_3^{{{{t}}_2}} $ -

Figure 5.
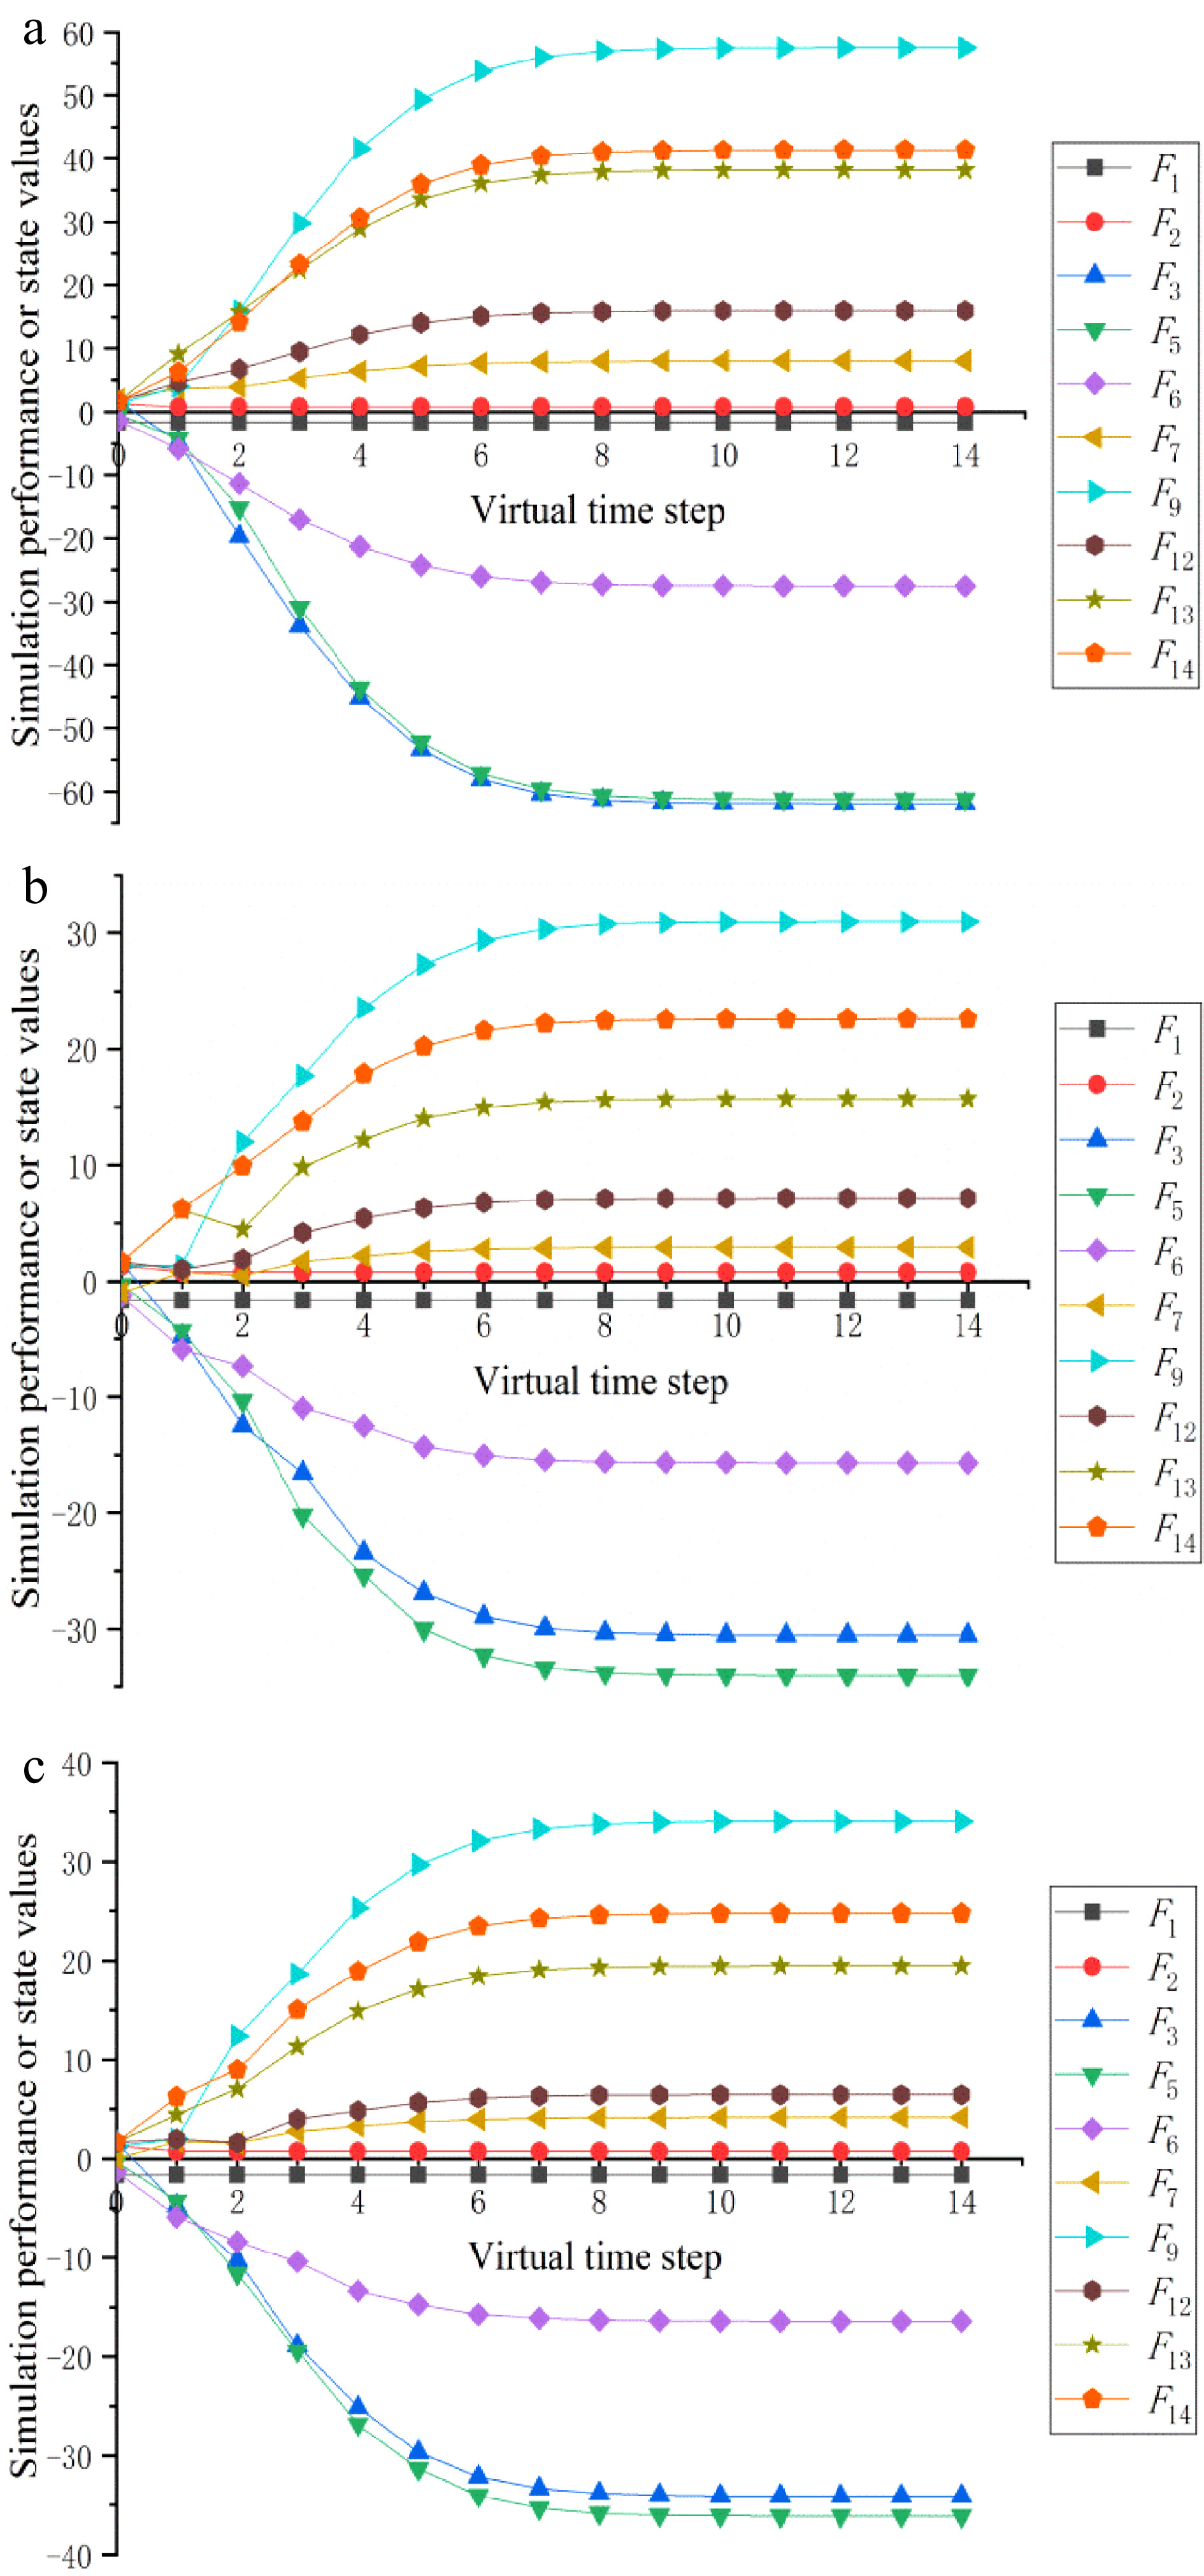
Evolutions of simulation performance or state values of factors of emergency scenarios
$ {{\hat e}}_1^{{{{t}}_2}} $ $ {{\hat e}}_2^{{{{t}}_2}} $ $ {{\hat e}}_3^{{{{t}}_2}} $ $ {{\hat e}}_1^{{{{t}}_2}} $ $ {{\hat e}}_2^{{{{t}}_2}} $ $ {{\hat e}}_3^{{{{t}}_2}} $ -
Factor Description F1 (C) Typhoon Mujigae with estimated maximum sustained winds of 175 km/h near its centre at its peak intensity F2 (C) Checking ladder of tank destroyed and a leaking hole with a diameter of about 60 mm at the top of the tank F3 (C) Liquefied petroleum gas leakage with pressure of about 0.6 MPa F4 (C) Roads blocked by fallen trees, billboards and overturned cars etc. F5 (C) Hazardous chemicals nearby may be ignited if the leaking tank explodes F6 (C) Rescue workers and the surrounding people threatened by the explosion risk F7 (B) Releasing gas pressure with the leaking hole without human intervention F8 (B) Diluting the leakage gas by virtue of natural conditions such as wind and rain F9 (B) Disaster relief teams travelling and rescuing F10 (B) Evacuate the masses and set up security cordons F11 (B) Clearing roadblocks and evacuating traffic F12 (B) Diluting the air in the leaking area using fire fighting hoses F13 (B) Plugging the leaking hole with cork F14 (B) Transferring the remaining liquefied petroleum gas to a safety zone from the tank Table 1.
Influential factors of emergency scenarios at time point
$ {{{t}}_1} $ $ {{{t}}_2} $ -
F1 F2 F3 F4 F5 F6 F7 F8 F9 F10 F11 $ {{\text{R}}_{{t_1}}} $ F1 (s0,0) (s1,−0.333) (s0,0) (s3,−0.333) (s0,0) (s0,0) (s0,0) (s2,−0.333) (s-1,0) (s-1,0) (s-2,−0.333) (a1,0.333) F2 (s0,0) (s0,0) (s1,−0.333) (s0,0) (s0,0) (s0,0) (s1,0) (s0,0) (s0,0) (s0,0) (s0,0) (b2,−0.333) F3 (s0,0) (s0,0) (s0,0) (s0,0) (s2,-0.333) (s1,0.333) (s0,0) (s0,−0.333) (s0,−0.333) (s0,0) (s0,0) (b2,0) F4 (s0,0) (s0,0) (s0,0) (s0,0) (s0,0) (s0,0) (s0,0) (s0,0) (s2,−0.333) (s-1,0) (s0,0) (b0,0.333) F5 (s0,0) (s0,0) (s0,0) (s0,0) (s0,0) (s1,−0.333) (s0,0) (s0,0) (s0,−0.333) (s0,0) (s0,0) (b0,0.333) F6 (s0,0) (s0,0) (s0,0) (s0,0) (s0,0) (s0,0) (s0,0) (s0,0) (s0,−0.333) (s-1,−0.333) (s0,0) (b1,−0.333) F7 (s0,0) (s0,0) (s0,0) (s0,0) (s0,0) (s0,0) (s0,0) (s0,0) (s1,0) (s0,0) (s0,0) (c0,0.333) F8 (s0,0) (s0,0) (s0,0) (s0,0) (s-2,0) (s0,−0.333) (s0,0) (s0,0) (s2,−0.333) (s1,0) (s0,0) (c1,−0.333) F9 (s0,0) (s0,0) (s-1,−0.333) (s-2,0) (s-1,−0.333) (s-1,−0.333) (s0,0) (s1,0) (s0,0) (s1,0.333) (s0,0) (c1,0.333) F10 (s0,0) (s0,0) (s0,0) (s0,0) (s0,0) (s-2,−0.333) (s0,0) (s0,0) (s1,0) (s0,0) (s0,0) (c1,−0.333) F11 (s0,0) (s0,0) (s0,0) (s0,0) (s0,0) (s1,0.333) (s1,0) (s0,0) (s3,−0.333) (s1,−0.333) (s0,0) (c2,−0.333) Table 2.
Collective BTLDRM
$ {A_{{t_1}}} $ $ {{{R}}_{{t_1}}} $ $ {{{t}}_1} $ -
F1 F2 F3 F5 F6 F7 F9 F12 F13 F14 F1 (s0,0) (s0,0.333) (s0,0) (s0,0) (s0,0) (s0,0) (s0,0) (s0,0.333) (s0,0) (s0,0) F2 (s0,0) (s0,0) (s1,0) (s0,0) (s0,0) (s1,0) (s0,0) (s0,0) (s-1,−0.333) (s0,0) F3 (s0,0) (s0,0) (s0,0) (s1,0.333) (s0,0.333) (s0,0) (s-1,−0.333) (s0,0) (s0,0) (s0,0) F5 (s0,0) (s0,0) (s0,0) (s0,0) (s-1,0.333) (s0,0) (s-1,0) (s0,0) (s0,0) (s0,0) F6 (s0,0) (s0,0) (s0,0) (s0,0) (s0,0) (s0,0) (s-1,0.333) (s0,0) (s0,0) (s0,0) F7 (s0,0) (s0,0) (s0,0) (s0,0) (s0,0) (s0,0) (s1,0) (s1,0.333) (s2,0.333) (s0,0) F9 (s0,0) (s0,0) (s-2,0.333) (s-1,−0.333) (s-1,0.333) (s0,0.333) (s0,0) (s1,−0.333) (s1,0.333) (s1,0.333) F12 (s0,0) (s0,0) (s0,0) (s-2,0.333) (s-2,0.333) (s0,0) (s0,0) (s0,0) (s2,−0.333) (s0,0) F13 (s0,0) (s0,0) (s-3,−0.333) (s0,0) (s0,0) (s0,0) (s1,−0.333) (s0,0) (s0,0) (s2,−0.333) F14 (s0,0) (s0,0) (s0,0) (s-1,0) (s-1,0) (s0,0) (s0,0.333) (s0,0) (s0,0) (s0,0) Table 3.
Collective BTLDRM
$ {A_{{t_2}}} $ $ {{{t}}_2} $ -
Time point Emergency scenario Factor weight Cause-effect classification Overall performance value Cause factor Effect factor $ {{{t}}_1} $ $ {{\hat e}}_1^{{{{t}}_1}} $ F1:0.126; F2:0.057; F3:0.114; F4:0.081; F5:0.083;
F6:0.102; F7:0.048; F8:0.101; F9:0.192; F10:0.097F1; F2; F3 F4; F5; F6; F7; F8; F9; F10 0.389 $ {{\hat e}}_2^{{{{t}}_1}} $ F1:0.134; F2:0.046; F3:0.096; F4:0.070; F5:0.071; F6:0.100;
F7:0.049; F8:0.089; F9:0.185; F10:0.089; F11:0.074F1; F2; F3; F11 F4; F5; F6; F7; F8; F9; F10 0.640 $ {{{t}}_2} $ $ {{\hat e}}_1^{{{{t}}_2}} $ F1:0.013; F2:0.072; F3:0.138; F5:0.115; F6:0.085;
F7:0.109; F9:0.165; F12:0.088; F13:0.138; F14:0.077F1; F2; F7; F9; F12; F13 F3; F5; F6; F14 0.663 $ {{\hat e}}_2^{{{{t}}_2}} $ F1:0.014; F2:0.072; F3:0.141; F5:0.119; F6:0.088;
F7:0.084; F9:0.171; F12:0.093; F13:0.140; F14:0.079F1; F2; F7; F9; F12; F13 F3; F5; F6; F14 0.348 $ {{\hat e}}_3^{{{{t}}_2}} $ F1:0.014; F2:0.072; F3:0.141; F5:0.118; F6:0.087;
F7:0.085; F9:0.173; F12:0.091; F13:0.139; F14:0.080F1; F2; F7; F9; F12; F13 F3; F5; F6; F14 0.410 Table 4.
Results obtained by the DEMATEL method.
Figures
(5)
Tables
(4)