-

Figure 1.
Summary of the de novo genome assembly and sequencing analysis of V. bracteatum. (a) Morphological features of the fruit of V. bracteatum. (b) Circos plot showing GC content, gene density, repeat coverage, collinearity between chromosomes of V. bracteatum. I, chromosome number; II, GC content; III, gene density; IV, numbers of repeat sequences per megabase pair; V, paralogous relationships between chromosomes.
-

Figure 2.
Gene family analysis among the seven plant species. (a) Gene family clustering petal map. The middle circle is the number of gene families common to all species, and the edge is the number of gene families unique to each species. (b) Gene family clustering Venn diagram. The number below the species name is the total number of gene families, and the corresponding number of genes are in parentheses; the number in the Venn diagram is the number of gene families.
-
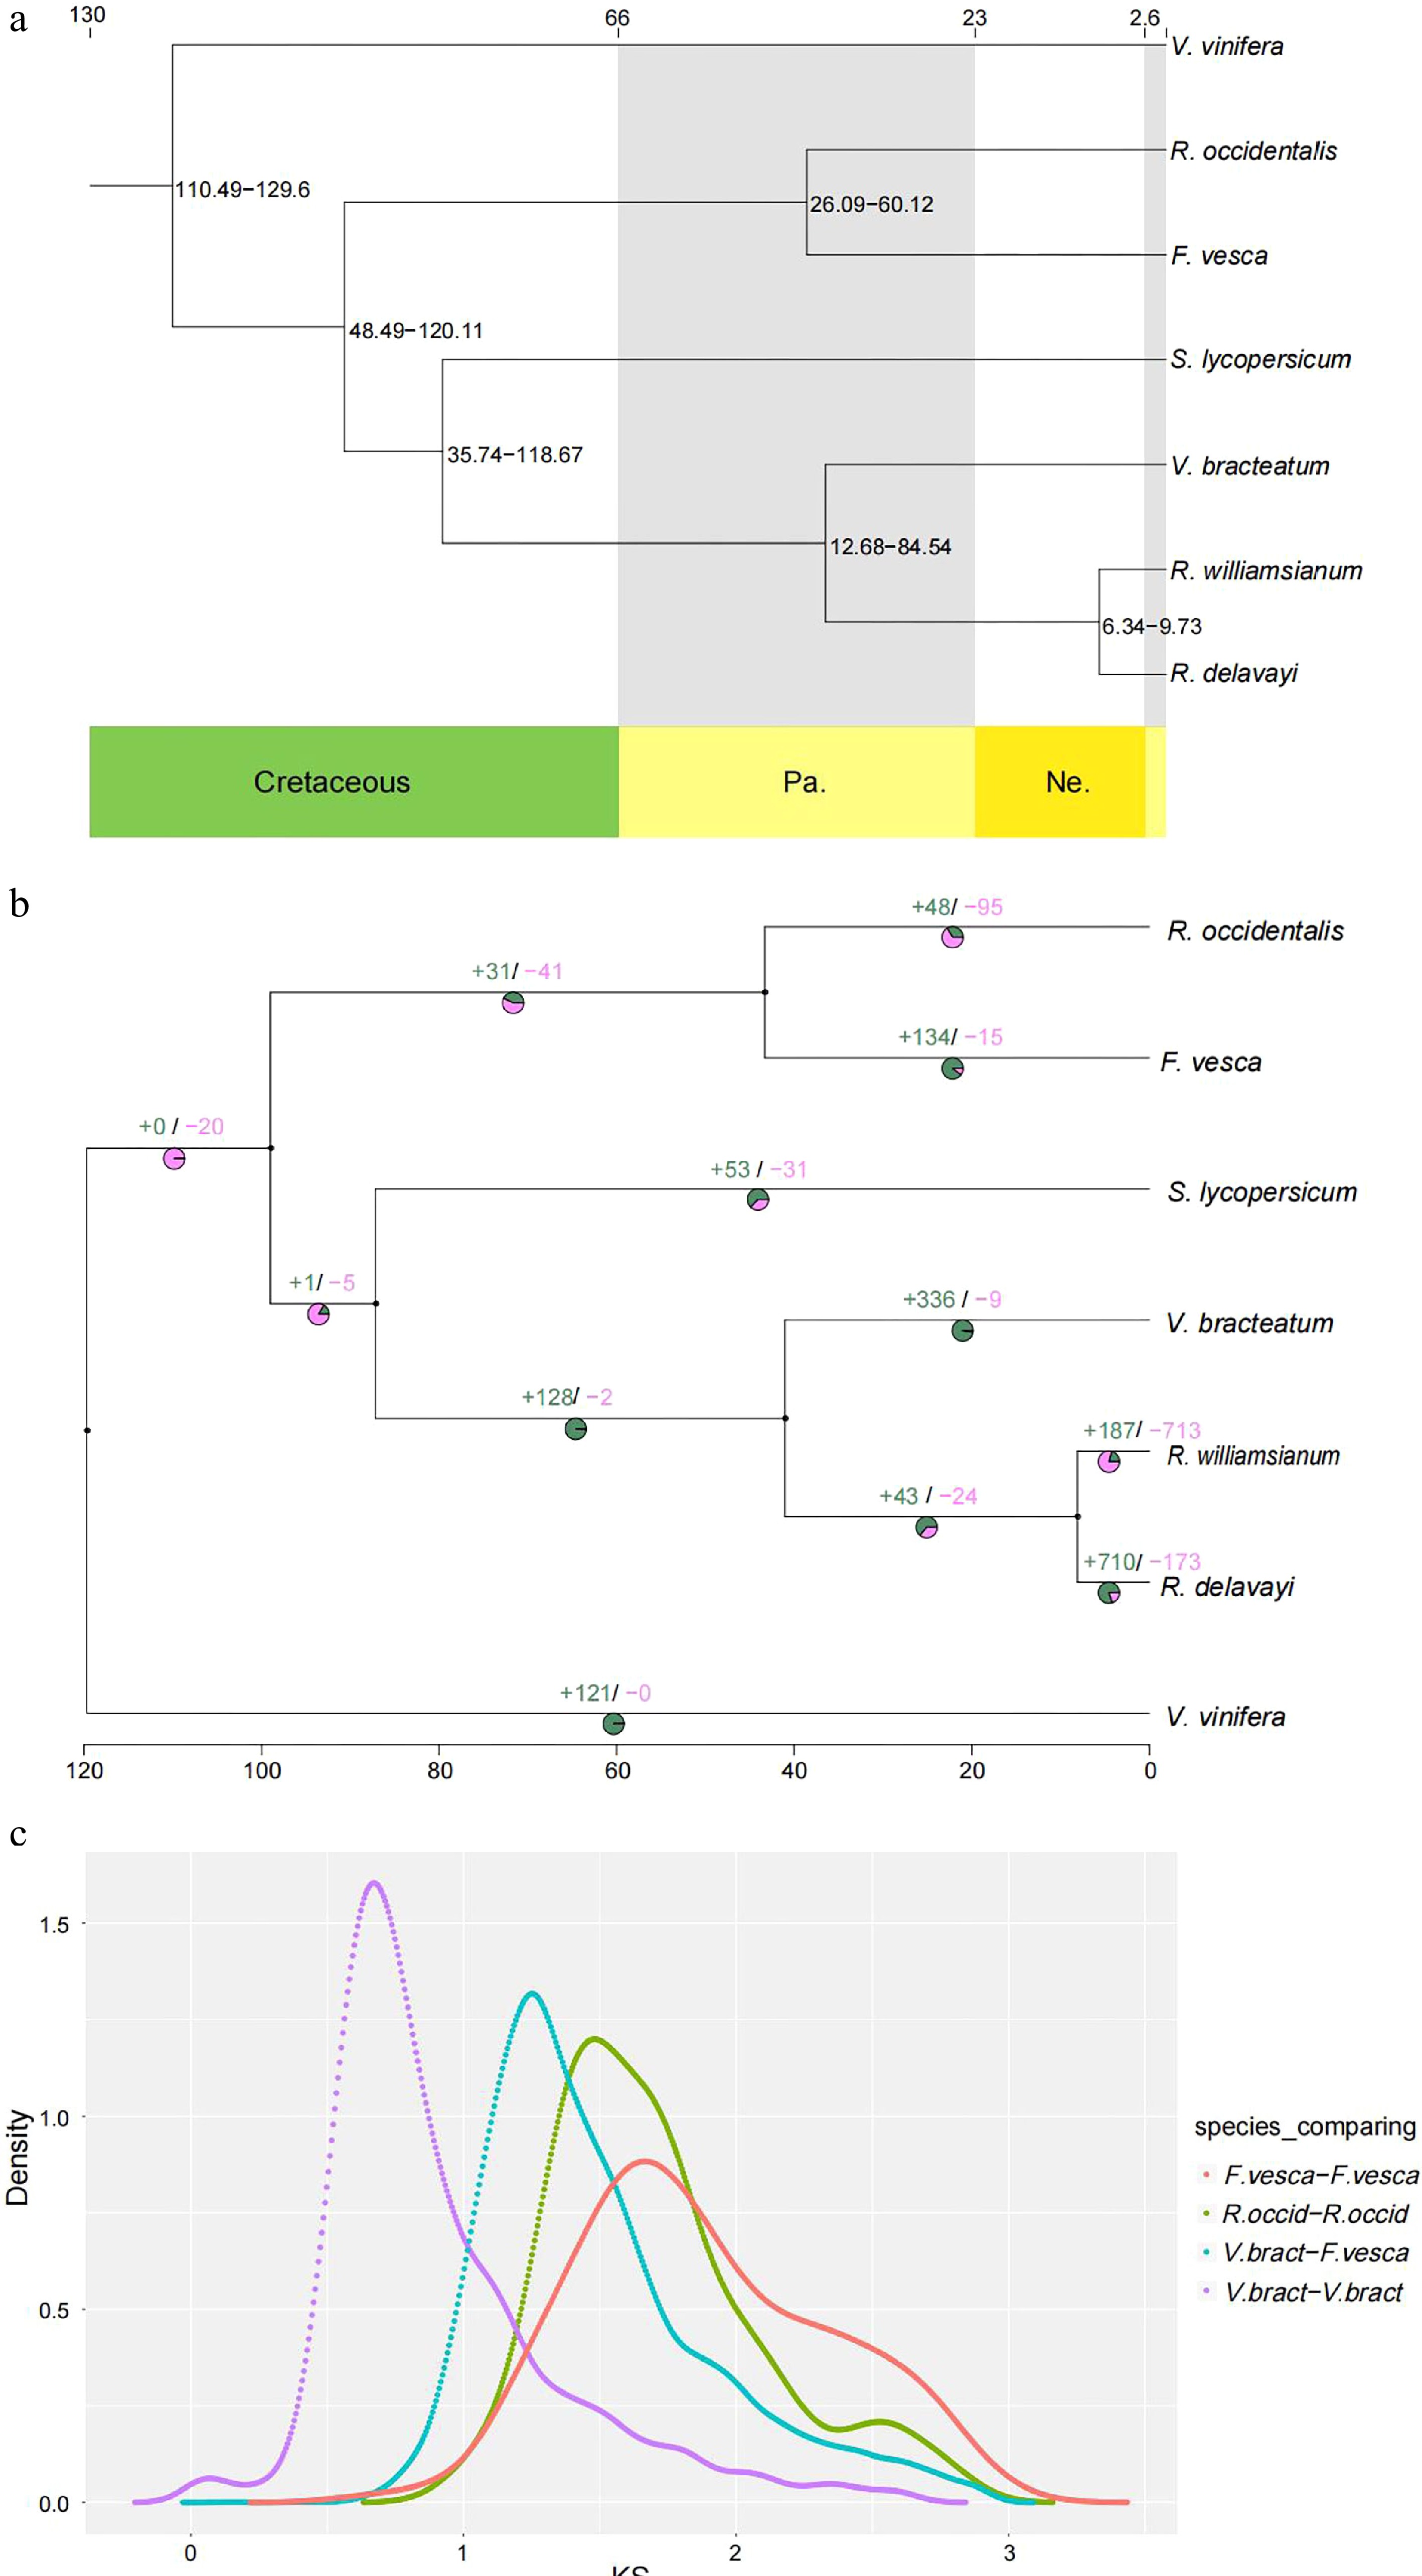
Figure 3.
Evolution of V. bracteatum analysis. (a) Constructed phylogenetic tree and divergence time estimation (MYA, millions of years ago). Pa, Paleogene; Ne, Neogene. (b) The contraction and expansion of gene family of above mentioned seven species. +, no. of gene families expanded on the node; −, no. of gene families contracted on the node. The pie charts show the proportion of corresponding branch contraction and expansion gene families. (c) The Ks distribution map within and between species.
-

Figure 4.
The chromosomal collinearity among V. bracteatum, R. williamsianum, R. occidentalis, and F. vesca. (a) The chromosome map in four species. (b) The inter-genomic comparison in point graph form.
-
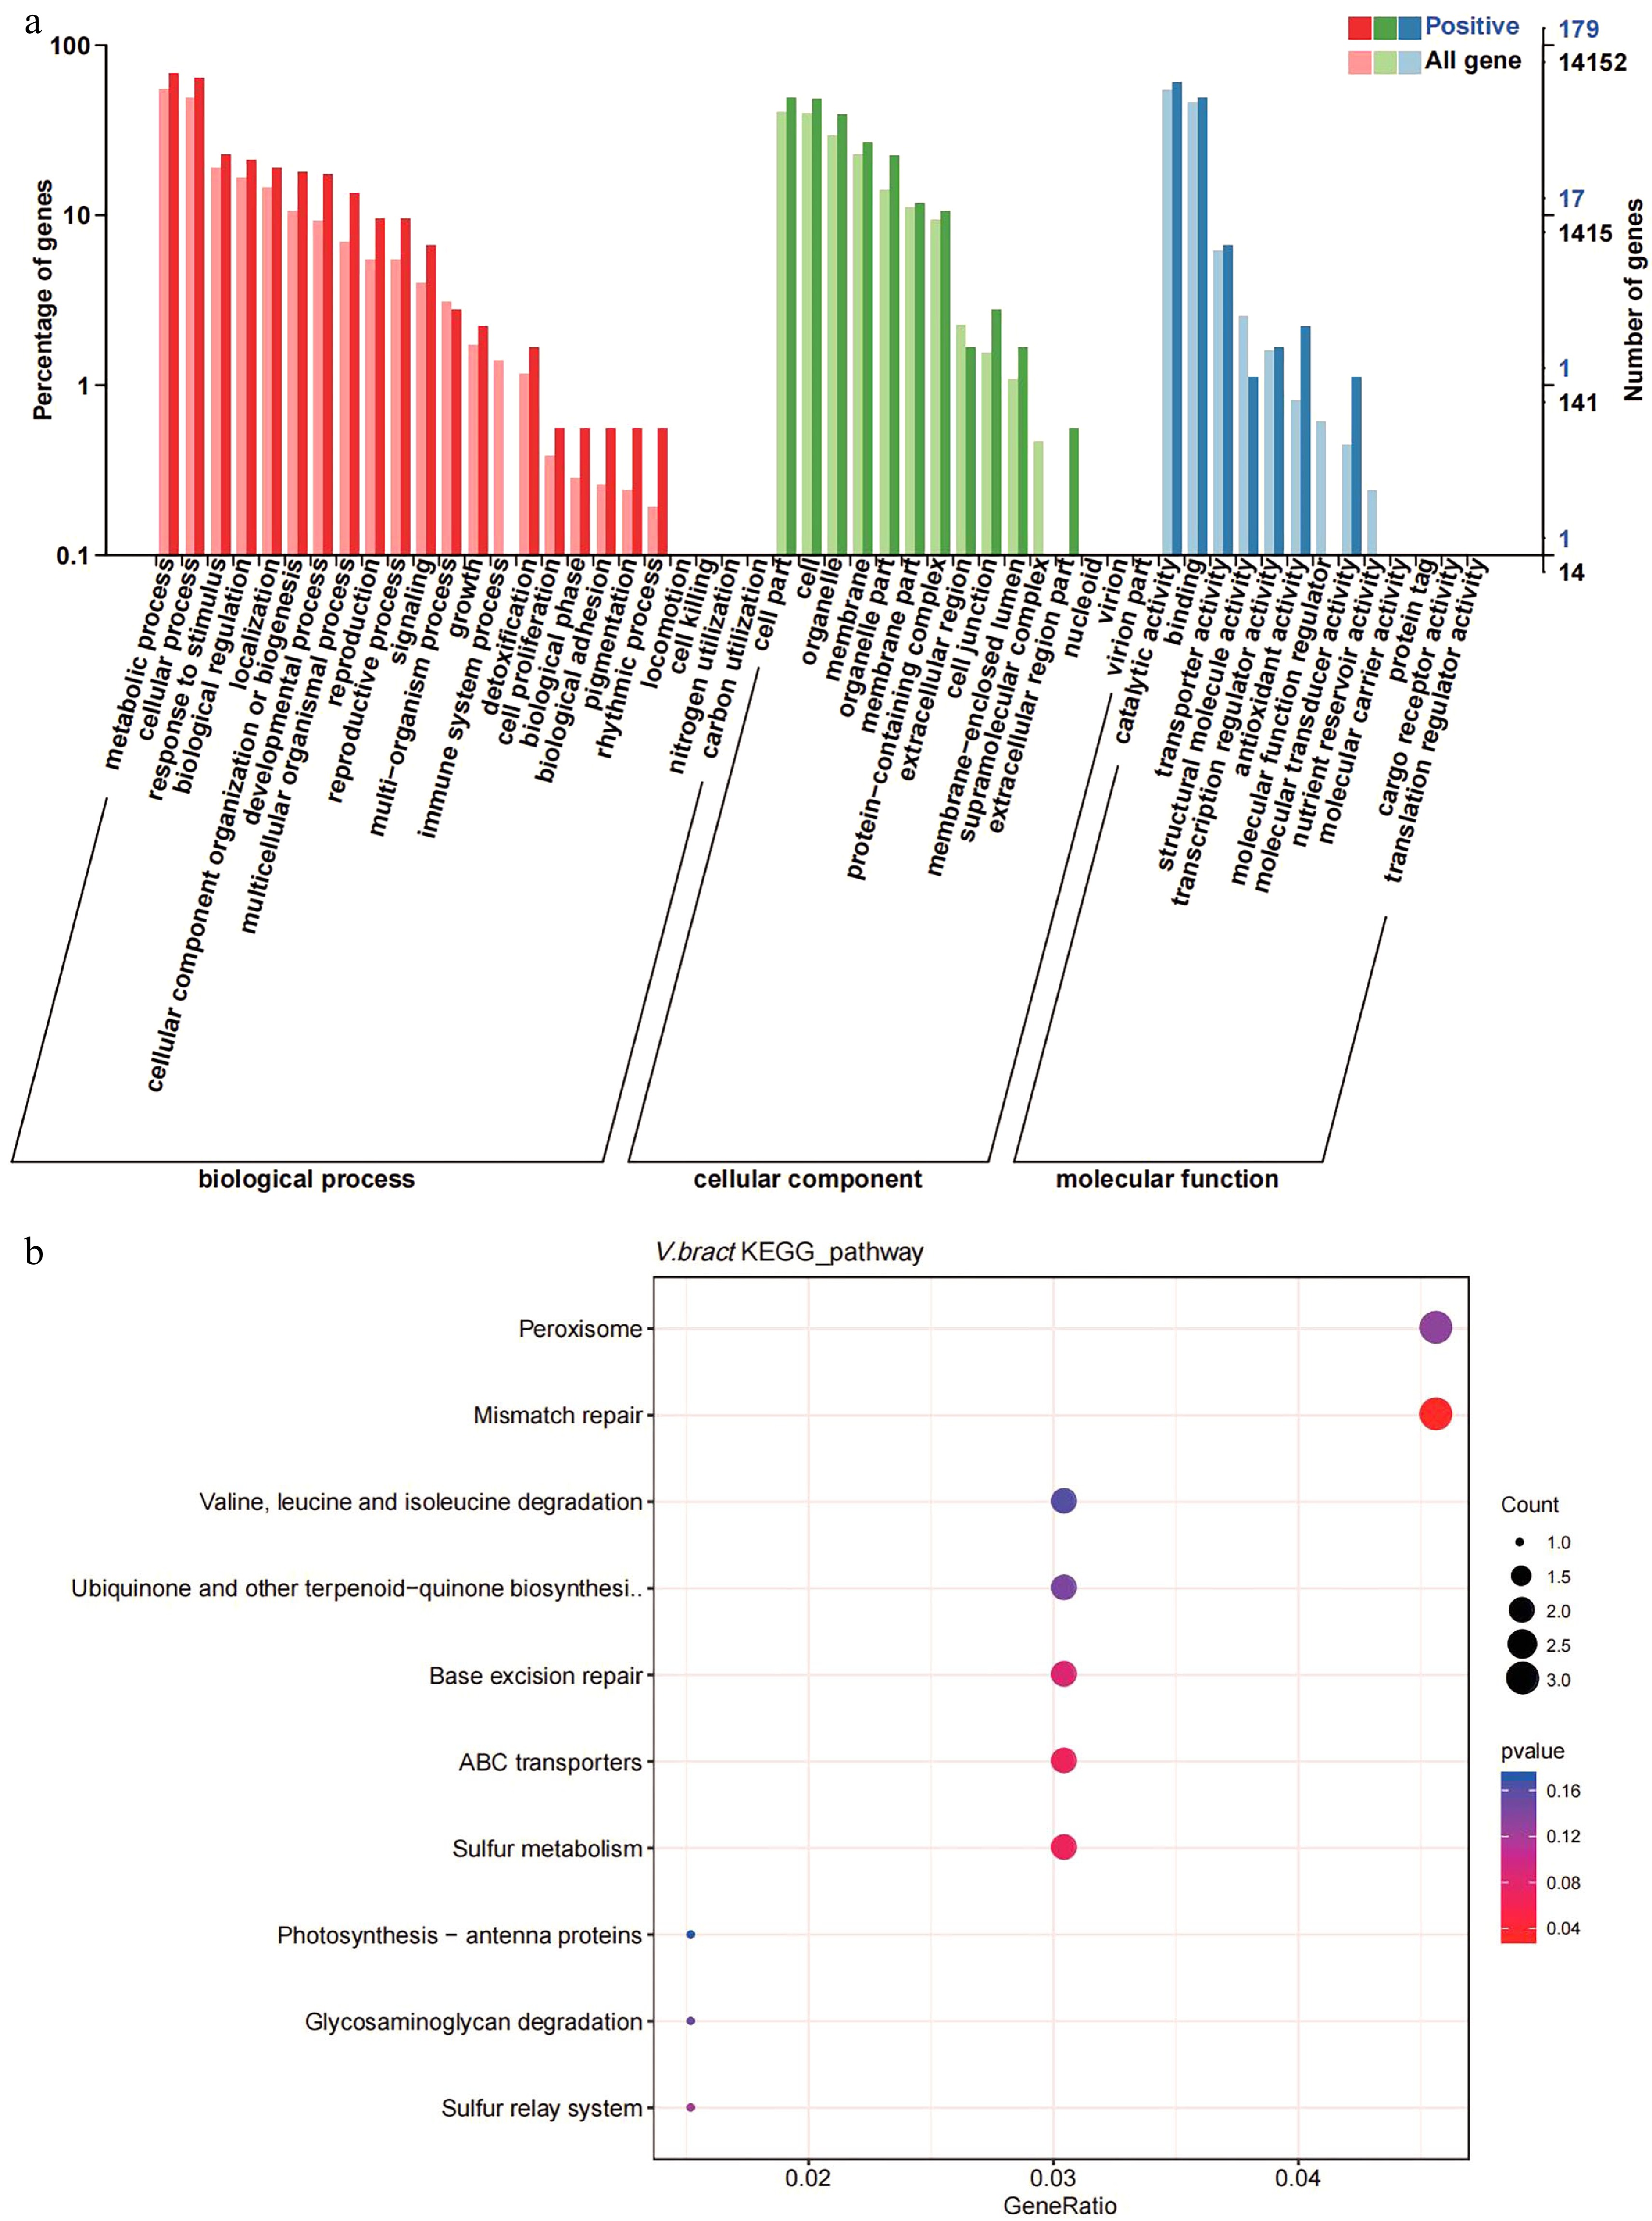
Figure 5.
Gene ontology (GO) and KEGG enrichment analysis of positively selected genes in V. bracteatum by clusterProfile. (a) GO enrichment analysis. The abscissa in the column chart represent the number of genes under the GO term, and the color is the corresponding P value. (b) The KEGG enrichment analysis. The abscissa in the plot represents proportion of the number of positively selected genes under the pathway to the total positively selected genes. The size of the point represents the number of genes enriched on this pathway, and the color is the corresponding P value.
-
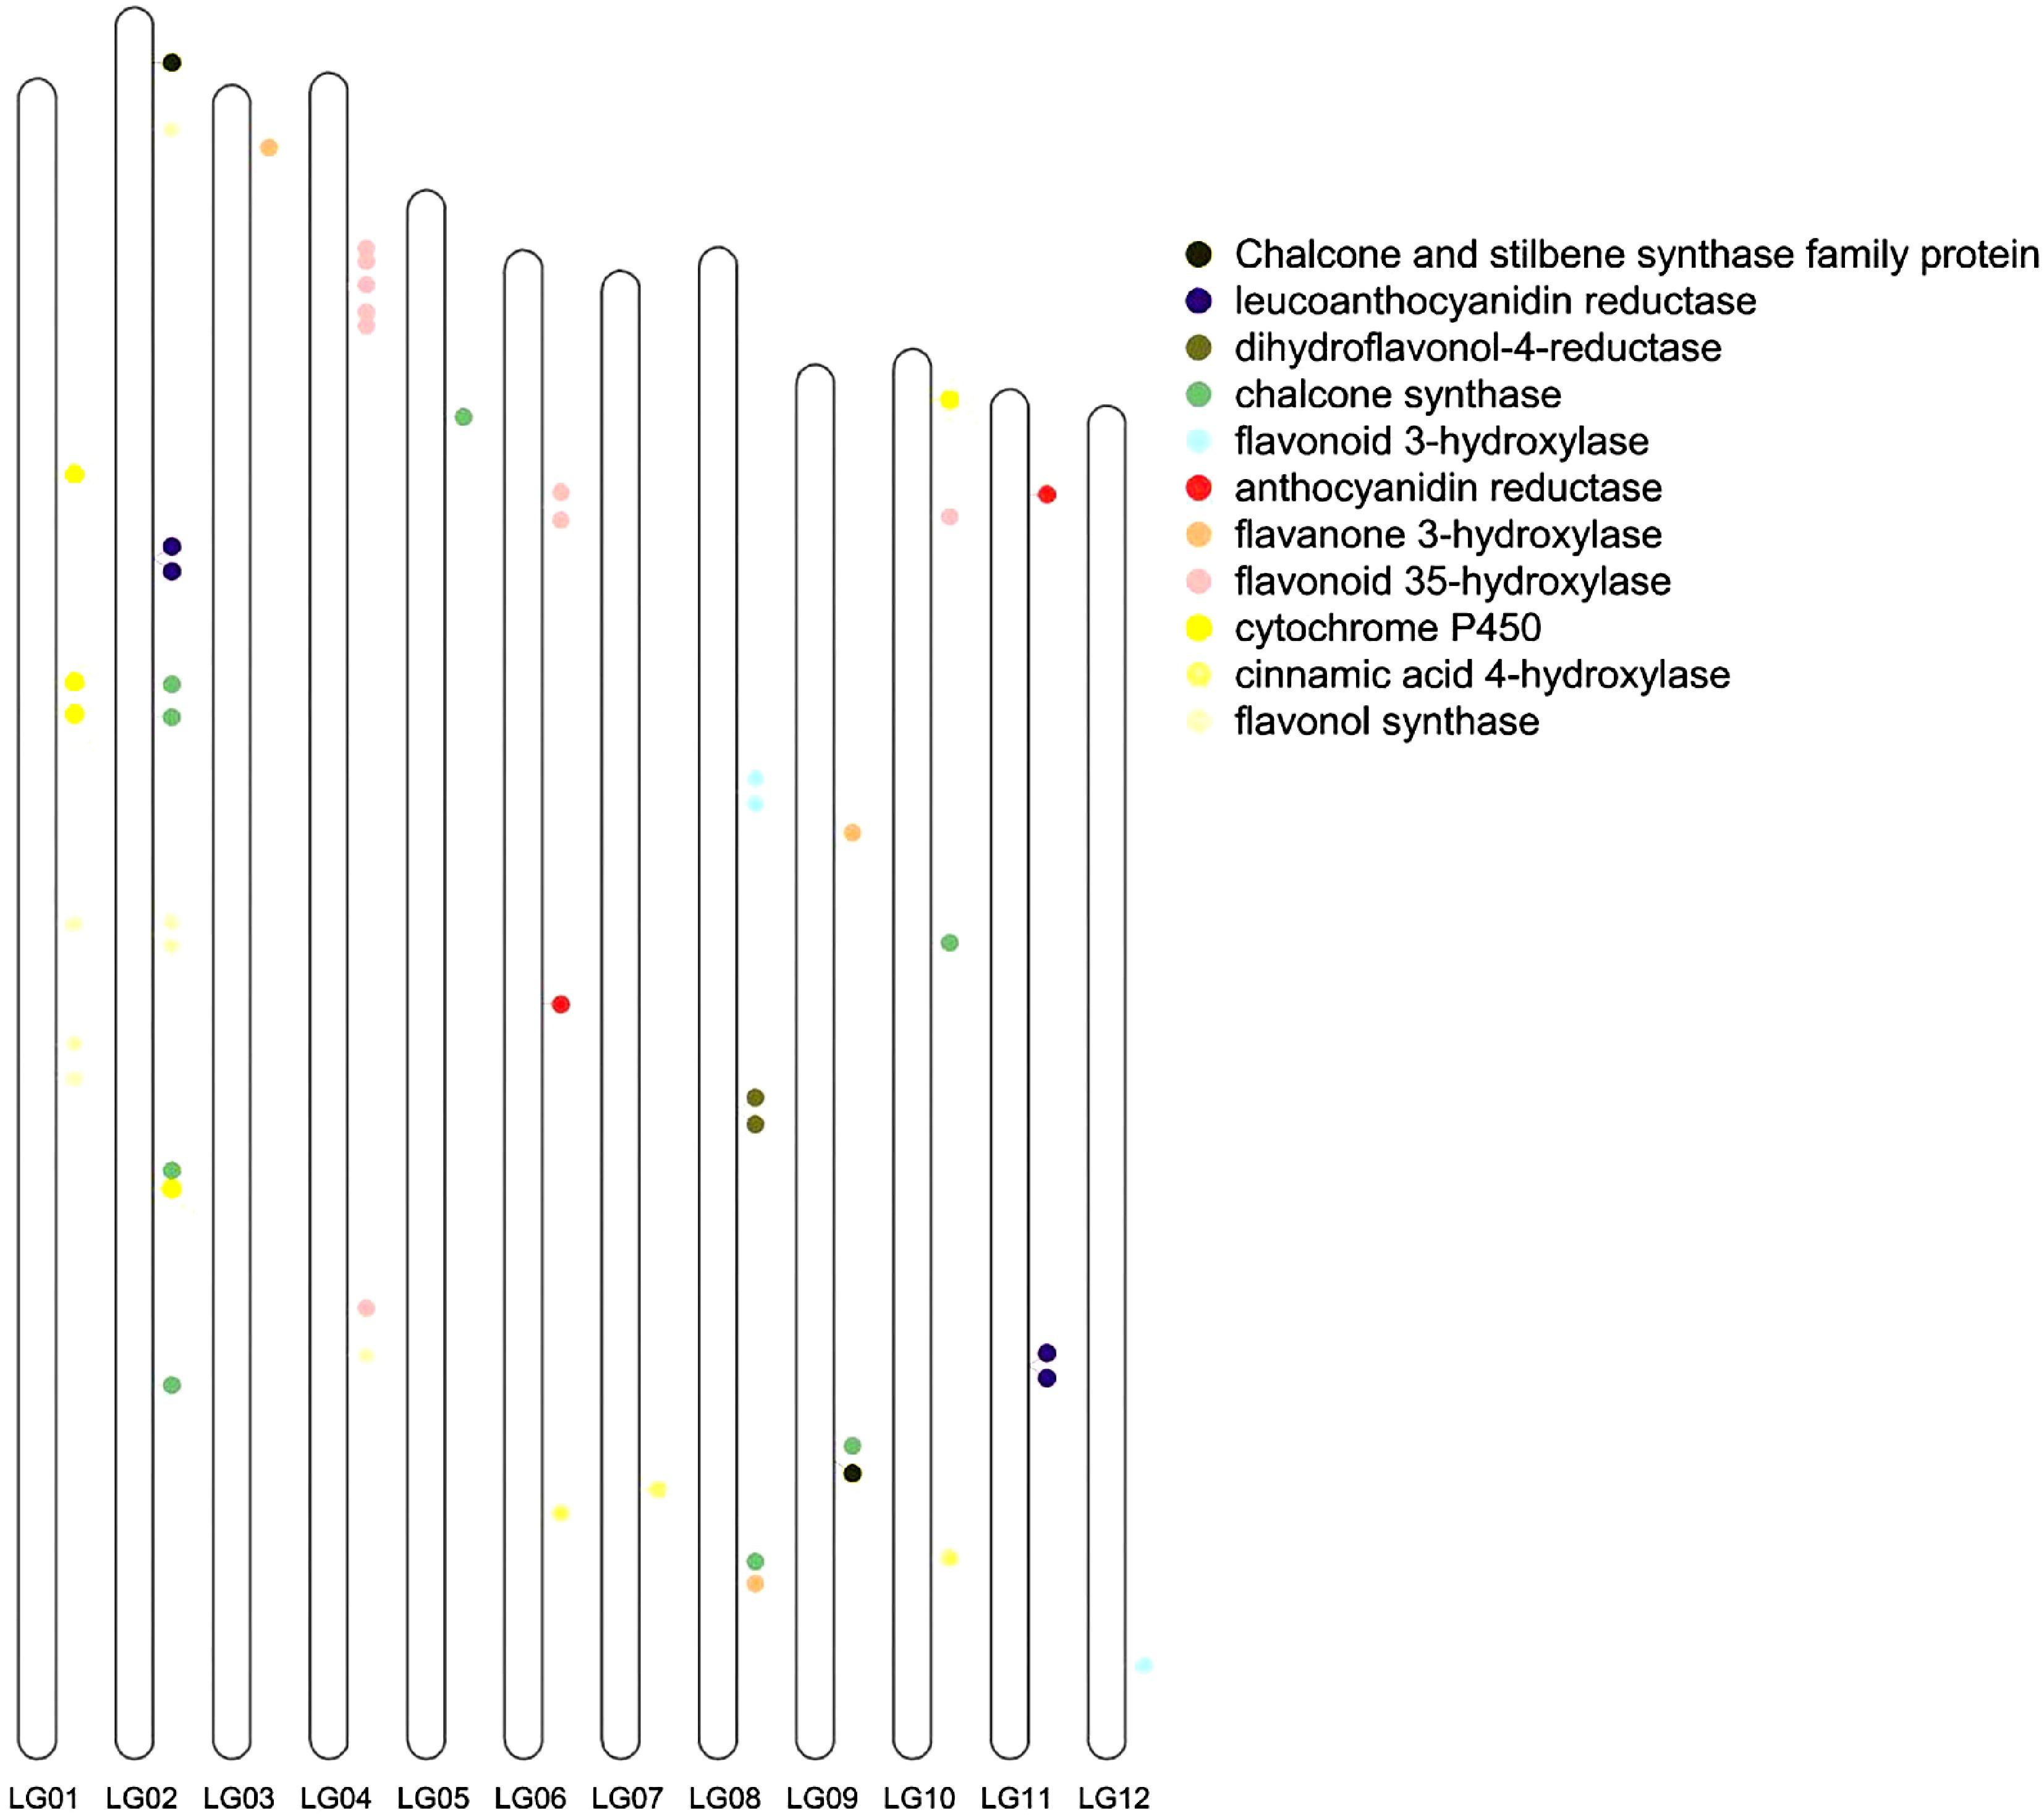
Figure 6.
Flavonoid related genes located on the chromosomes. LG01, LG02, ... and LG12 indicate chromosome 1, 2, ... and 12, respectively.
-

Figure 7.
Phylogenetic tree and heatmap of MYB transcription factor in the V. bracteatum genome.
-
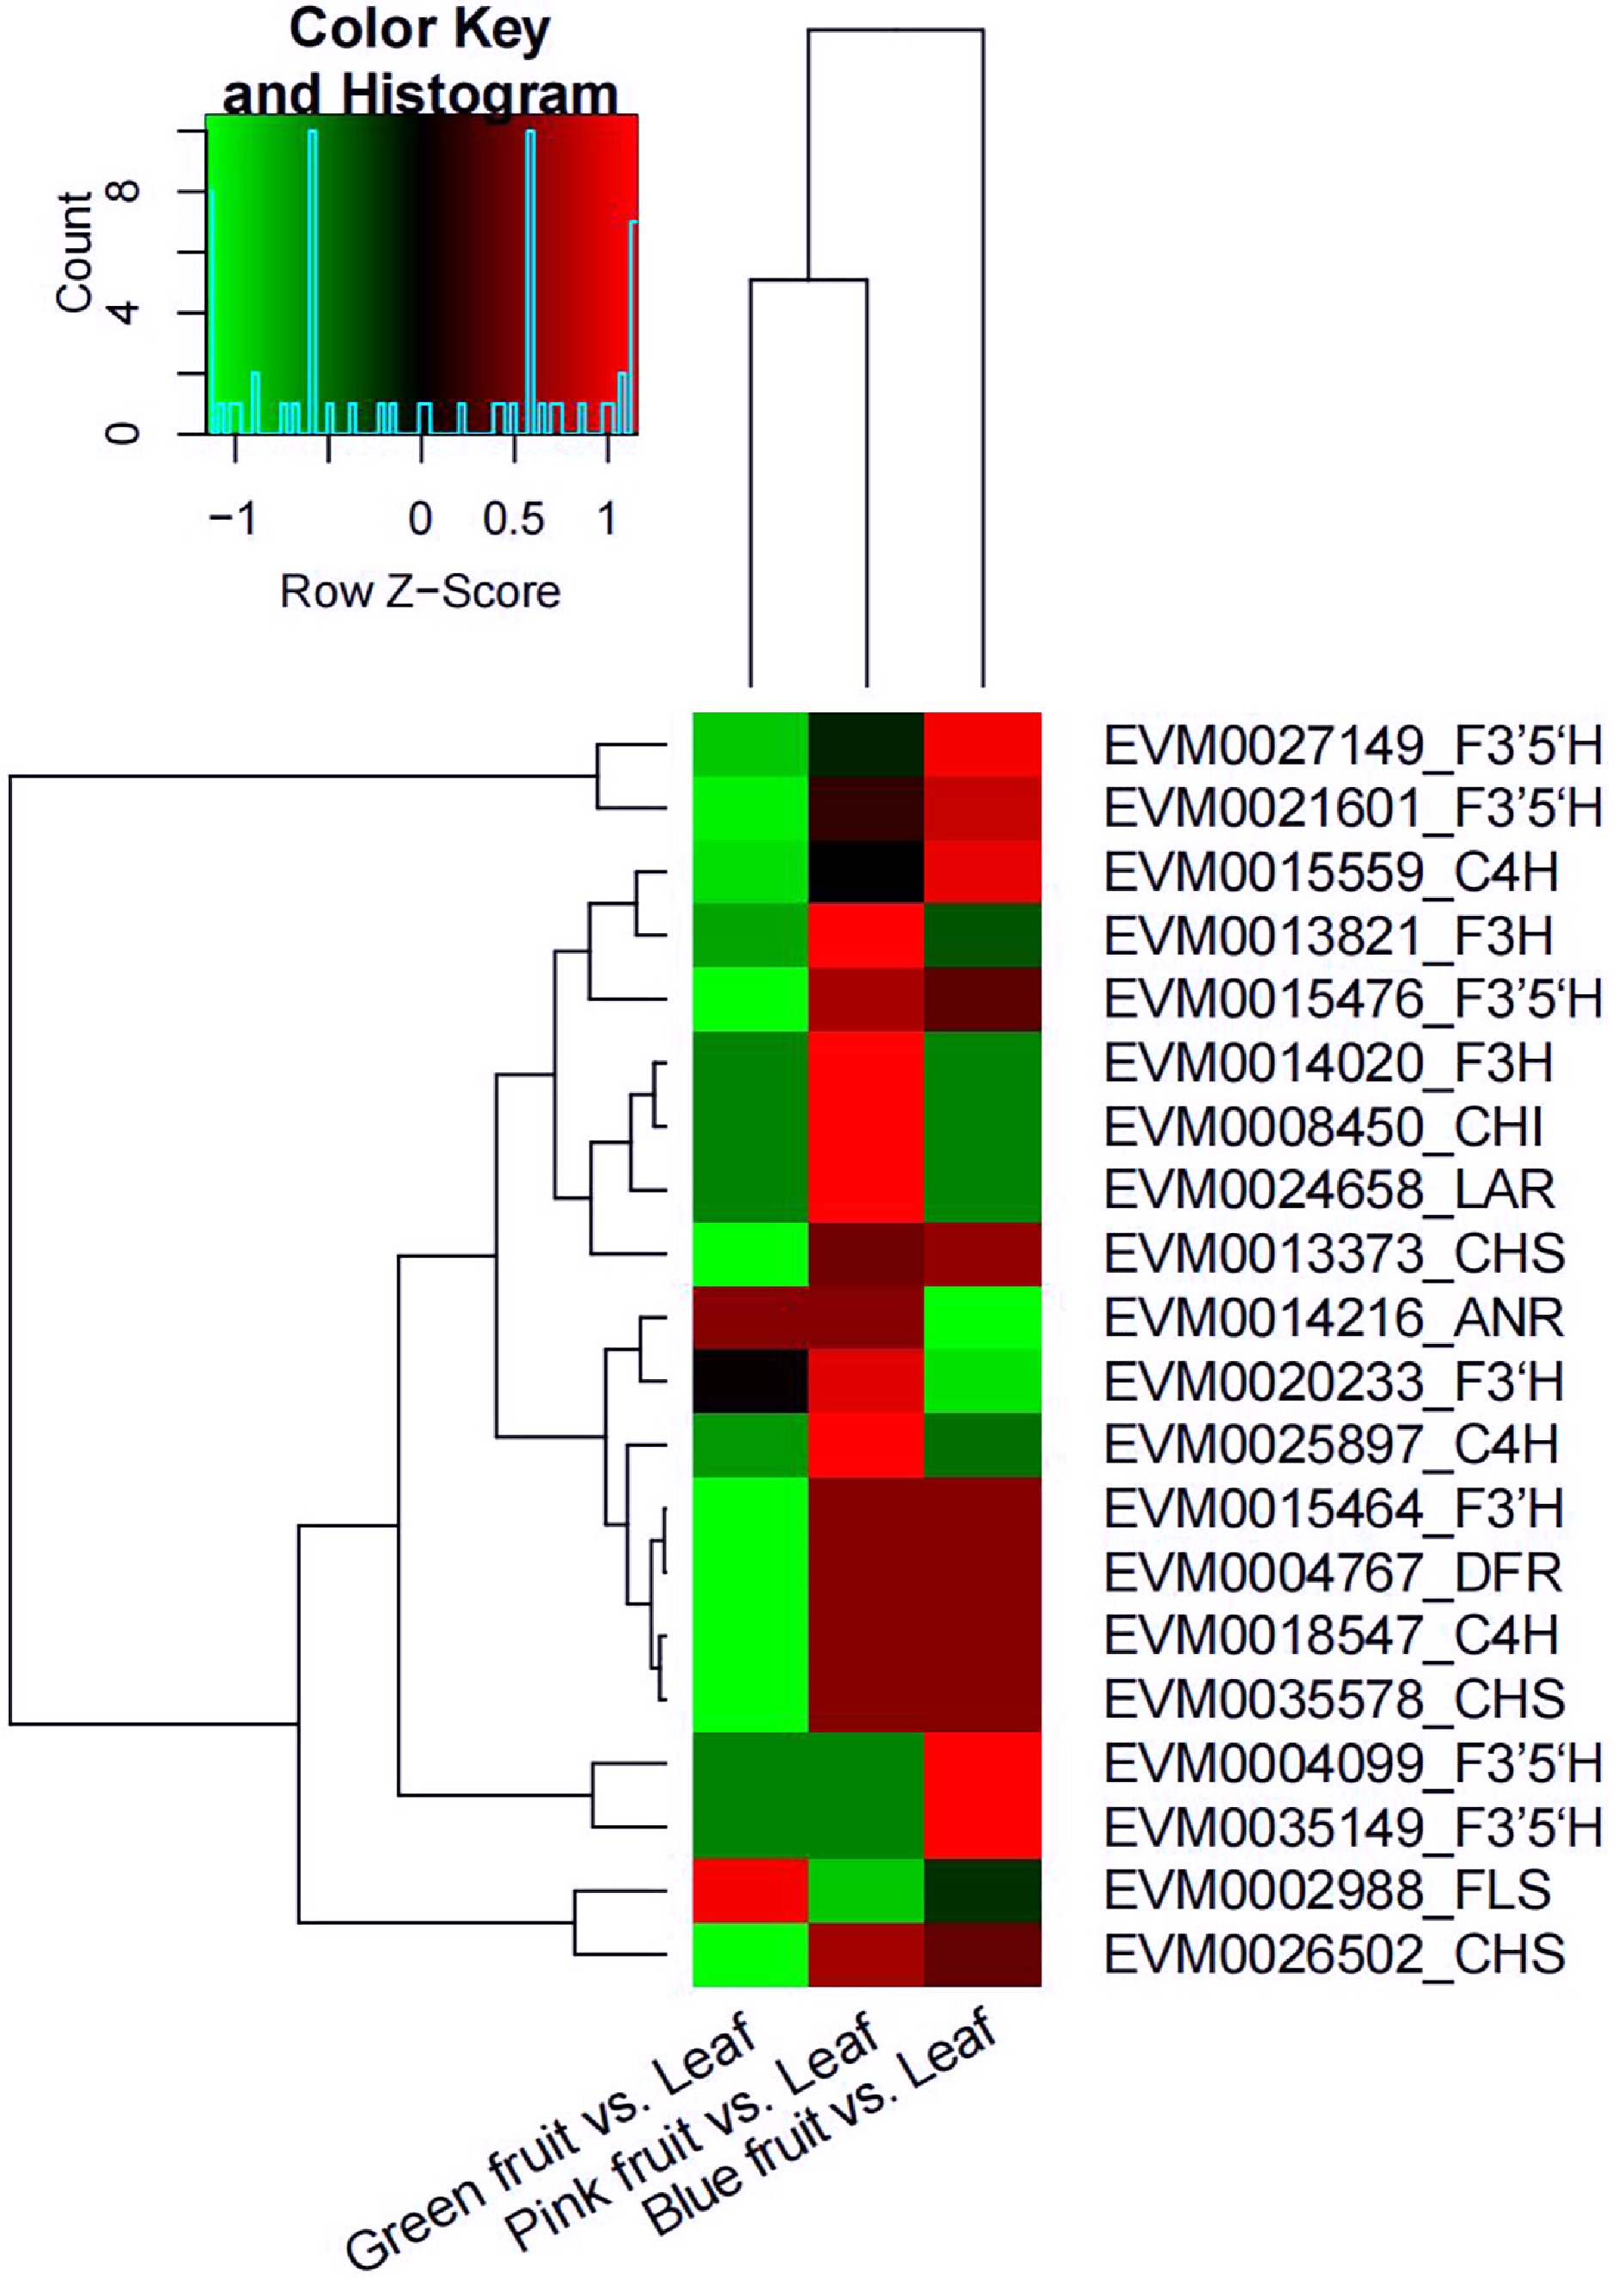
Figure 8.
Heat map diagram of the expression of differently expressed genes (DEGs) related to flavonoid biosynthesis in the comparisons of green fruit vs. leaf, pink fruit vs. leaf, and blue fruit vs. leaf. Green represents downregulated and red represents upregulated. anthocyanidin reductase (ANR); cinnamic acid 4-hydroxylase (C4H); chalcone isomerase (CHI); chalcone synthase (CHS); dihydroflavonol 4-reductase (DFR); flavonoid 3'-hydroxylase (F3’H); flavonoid 3',5’-hydroxylase (F3’5’H); flavanone 3-hydroxylase (F3H); flavonol synthase (FLS); leucoanthocyanidin reductase (LAR).
-
Assembly feature Statistic Contig-level assembly Chromosome-
scale assemblyEstimated genome size (by k-mer analysis) (Mb) 579.42 Repetitive sequence content 42.72% 57.78% GC content (estimation) 38.63% Estimated heterozygosity 1.10% Assembled genome size (Mb) 569.81 Contig number 1,384 1,430 Contig N50 (Mb) 1.98 1.87 Contig N90 (Mb) 0.30 0.26 Contig max (Mb) 9.42 9.42 GC content (Nanopore) 38.32% 38.32% Assembly % of genome 98.33% Scaffold number 973 Scaffold length (Mb) 569.86 Contig length (Mb) 569.81 Scaffold N50 (Mb) 43.77 Scaffold N90 (Mb) 39.17 Scaffold max (Mb) 50.70 Gap total length (Mb) 0.05 Table 1.
Major indicators of V. bracteatum genome of contig-level and chromosome-scale assembly.
Figures
(8)
Tables
(1)