-

Figure 1.
Floral phenotype of the Asiatic hybrid lily 'Annemarie's Dream'. (a) S1: bud stage. (b) S2: full-bloom stage. Bar = 1 cm.
-

Figure 2.
Analyses of DEGs at two development stages of stamen, petaloid stamen and inner tepal. (a) The number of up- and downregulated DEGs in 9 comparisons. (b) Venn diagram of DEGs in ST vs PEST, ST vs InTE and InTE vs PEST. (c) Venn diagram of DEGs in Budst vs Budpest, Budst vs Inbud and Inbud vs Budpest. (d) Venn diagram of DEGs in ST vs Budst, PEST vs Budpest and InTE vs Inbud. (e) KEGG pathway enrichment analysis of DEGs for ST vs PEST. (f) KEGG pathway enrichment analysis of DEGs for ST vs InTE.
-

Figure 3.
Expression heat maps of DEGs involved in the biosynthesis and signaling pathways phytohormone as auxin, CK: cytokinin, ETH: ethylene, JA: jasmonic acid, GA: gibberellic acid and ABA: abscisic acid. Red and blue represent up- and downregulation in gene expression, respectively. Gene expression level (log10(FPKM+1)) are represented by color gradation.
-
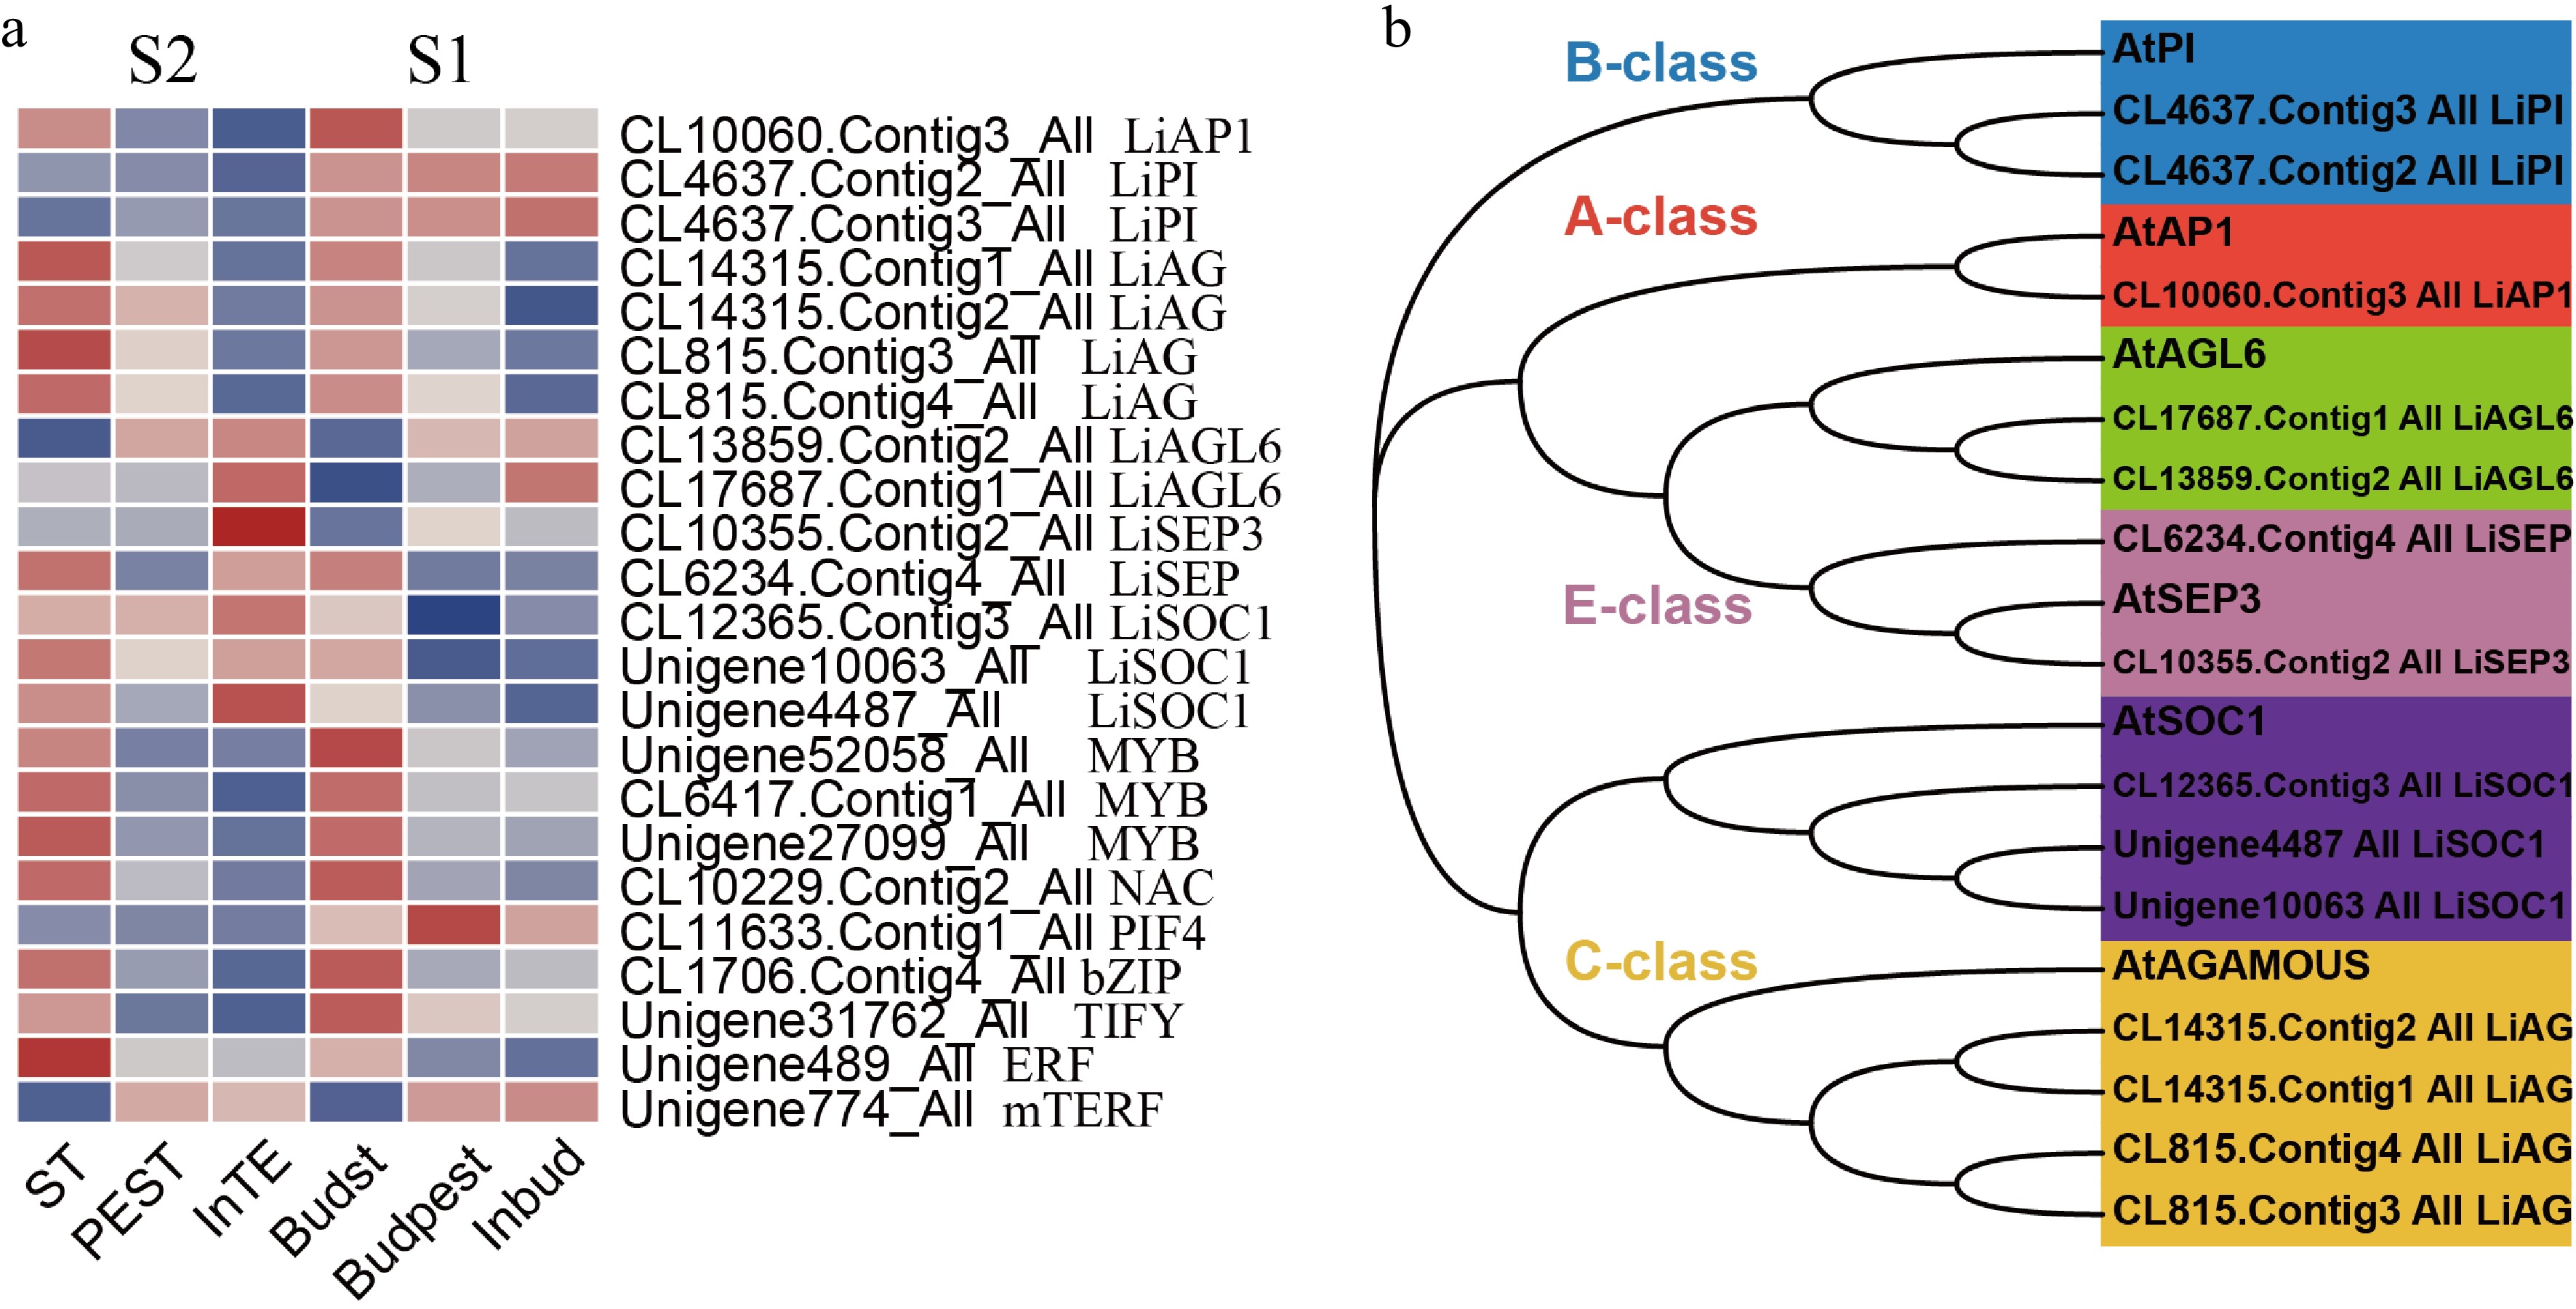
Figure 4.
Analysis of key transcription factor genes encode DEGs regulating stamen petaloid. (a) The expression heat map of key TFs in two development stages (S1, S2). (b) Phylogenetic analysis of key MADS-box family transcription factors and Arabidopsis-related proteins.
-
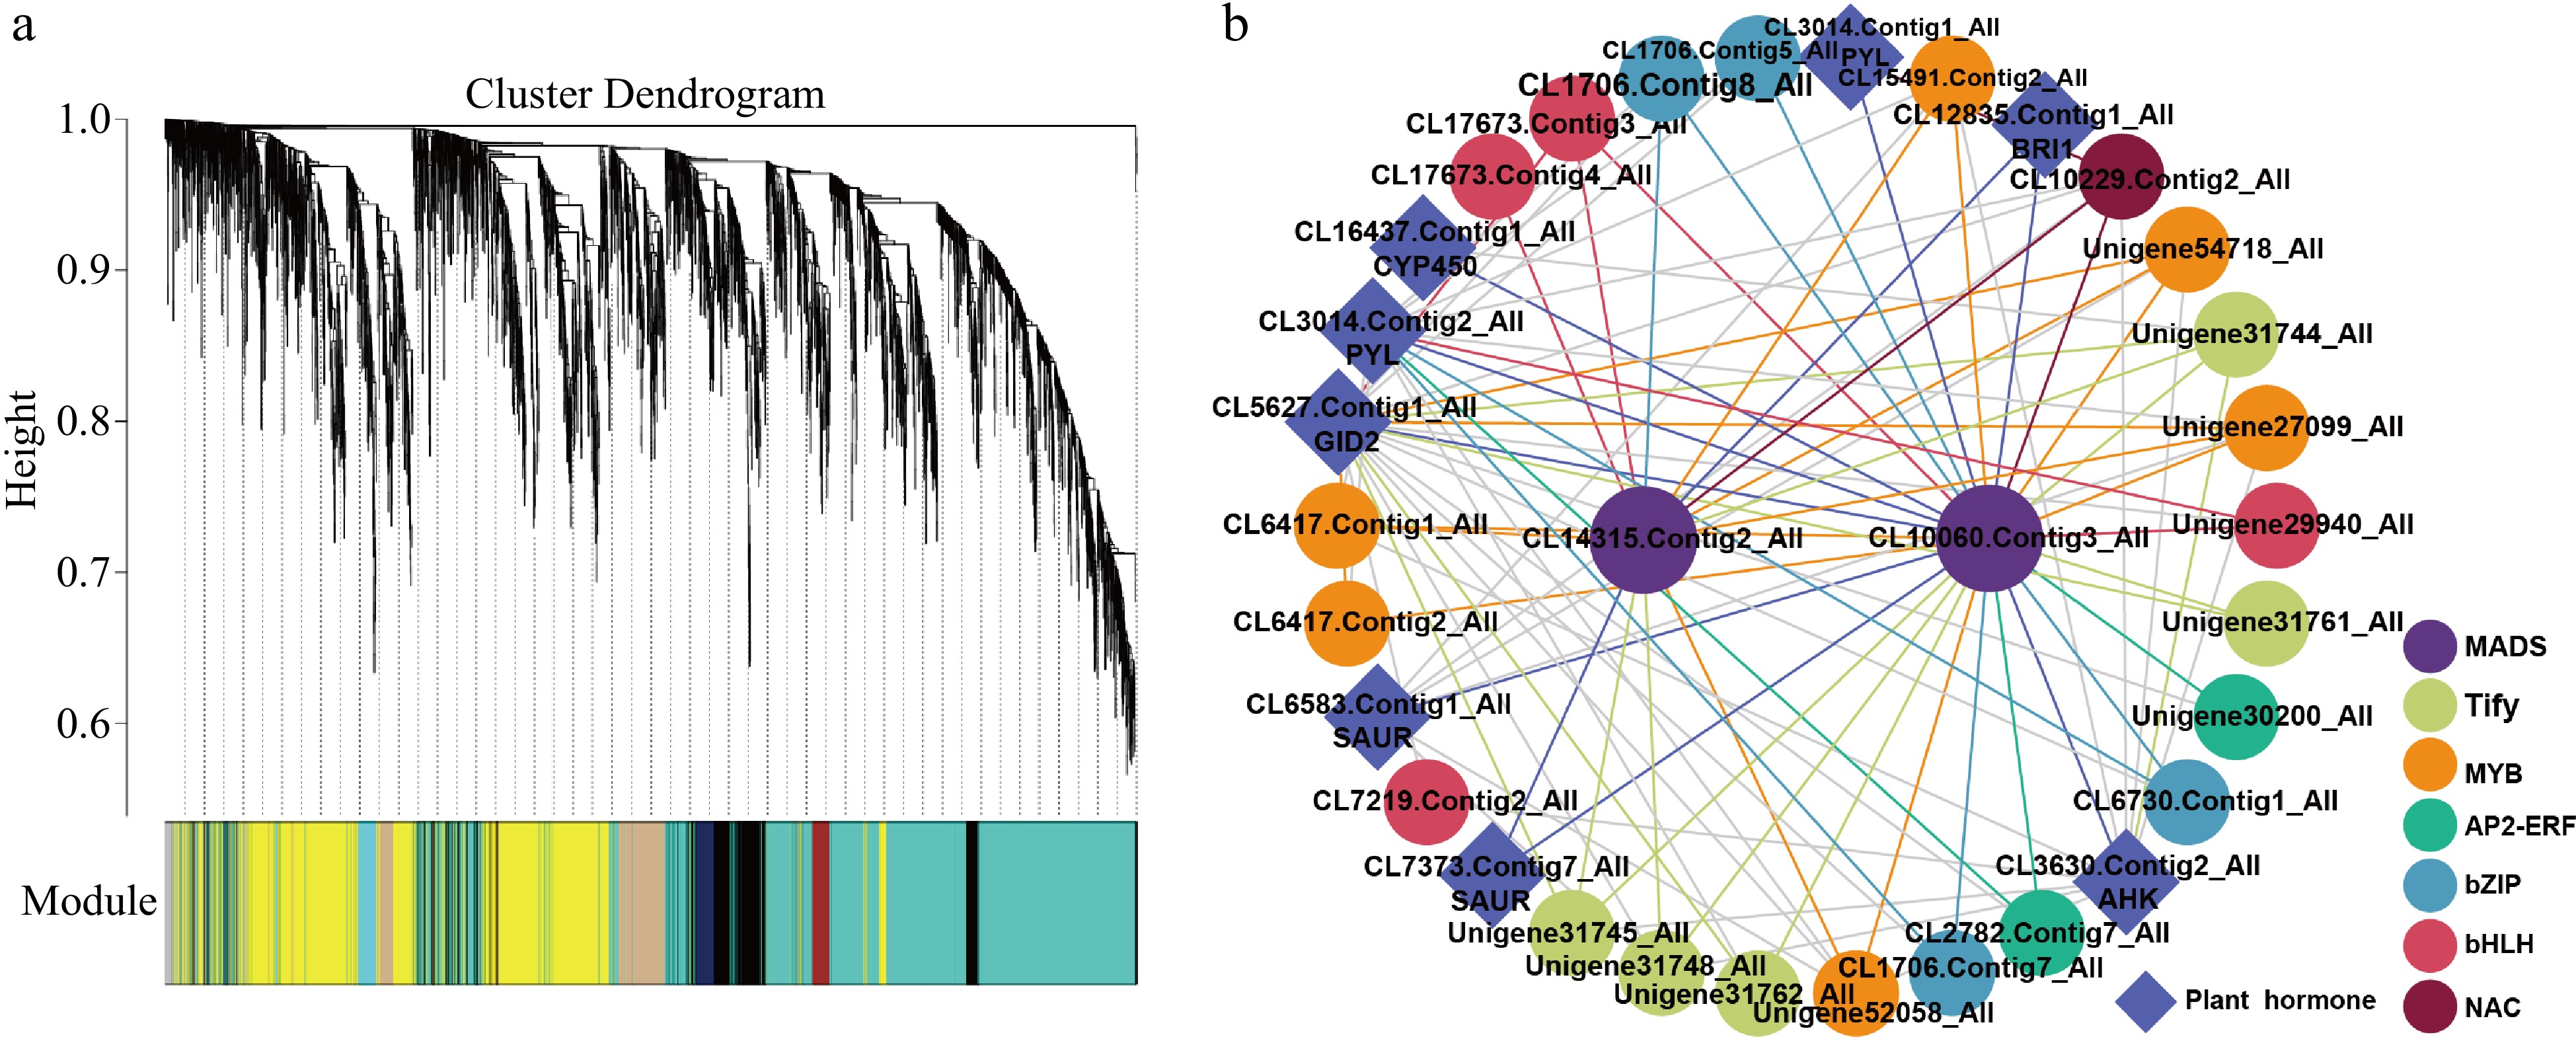
Figure 5.
The resolved gene regulatory network of stamen petalod in Asiatic hybrid 'Annemarie's Dream'. (a) Dendrogram showing co-expression modules identified by WGCNA across double-flower development. (b) The regulatory network of key genes involved in stamen petaloid.
-
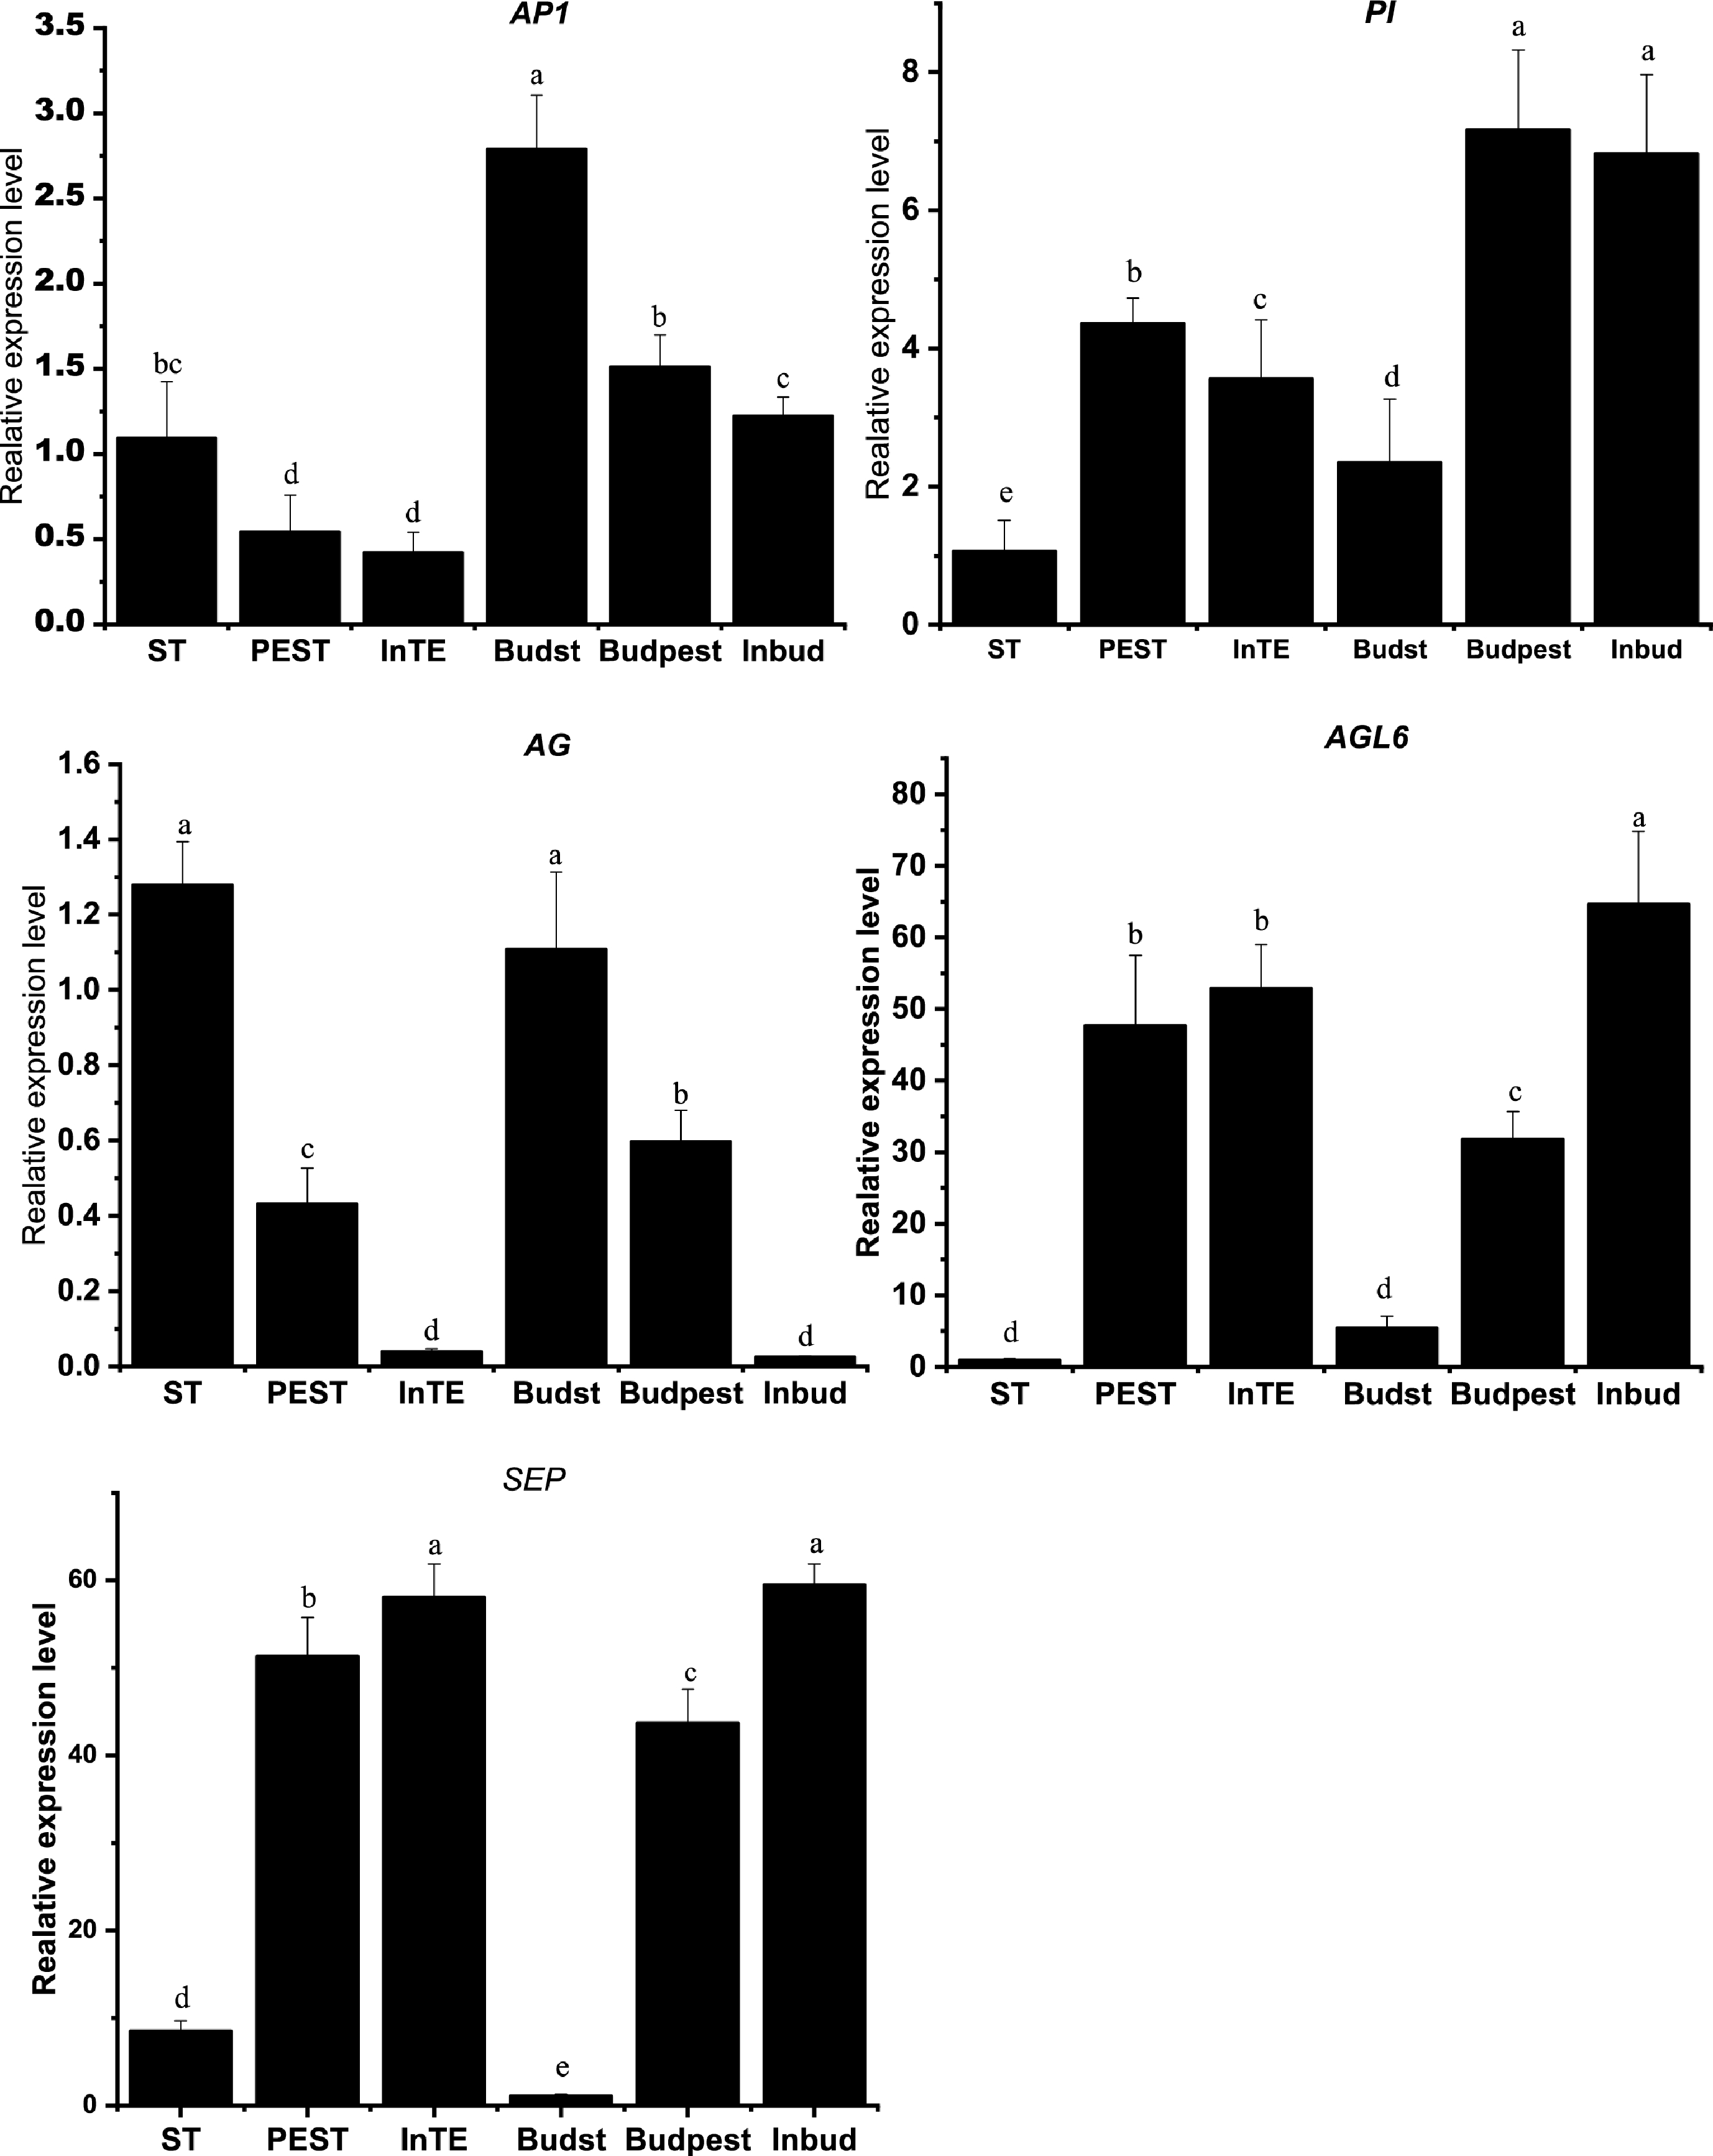
Figure 6.
Validation of the expression patterns of five MADS-box genes. Error bars represent standard deviation (SD) of biological replicates. Bars with different letters indicate significant differences among treatments, P ≤ 0.001, following one-way ANOVA.
-

Figure 7.
Summary of candidate DEGs involved in phytohormone signals and biosynthesis regulating stamen petaloid in the Lilium cultivar ‘Annemarie’s Dream’. The vertical up arrow represents the upregulated genes from stamen to petaloid stamen phenotype. The vertical down arrow represents the downregulated genes from stamen to petaloid stamen.
Figures
(7)
Tables
(0)