-
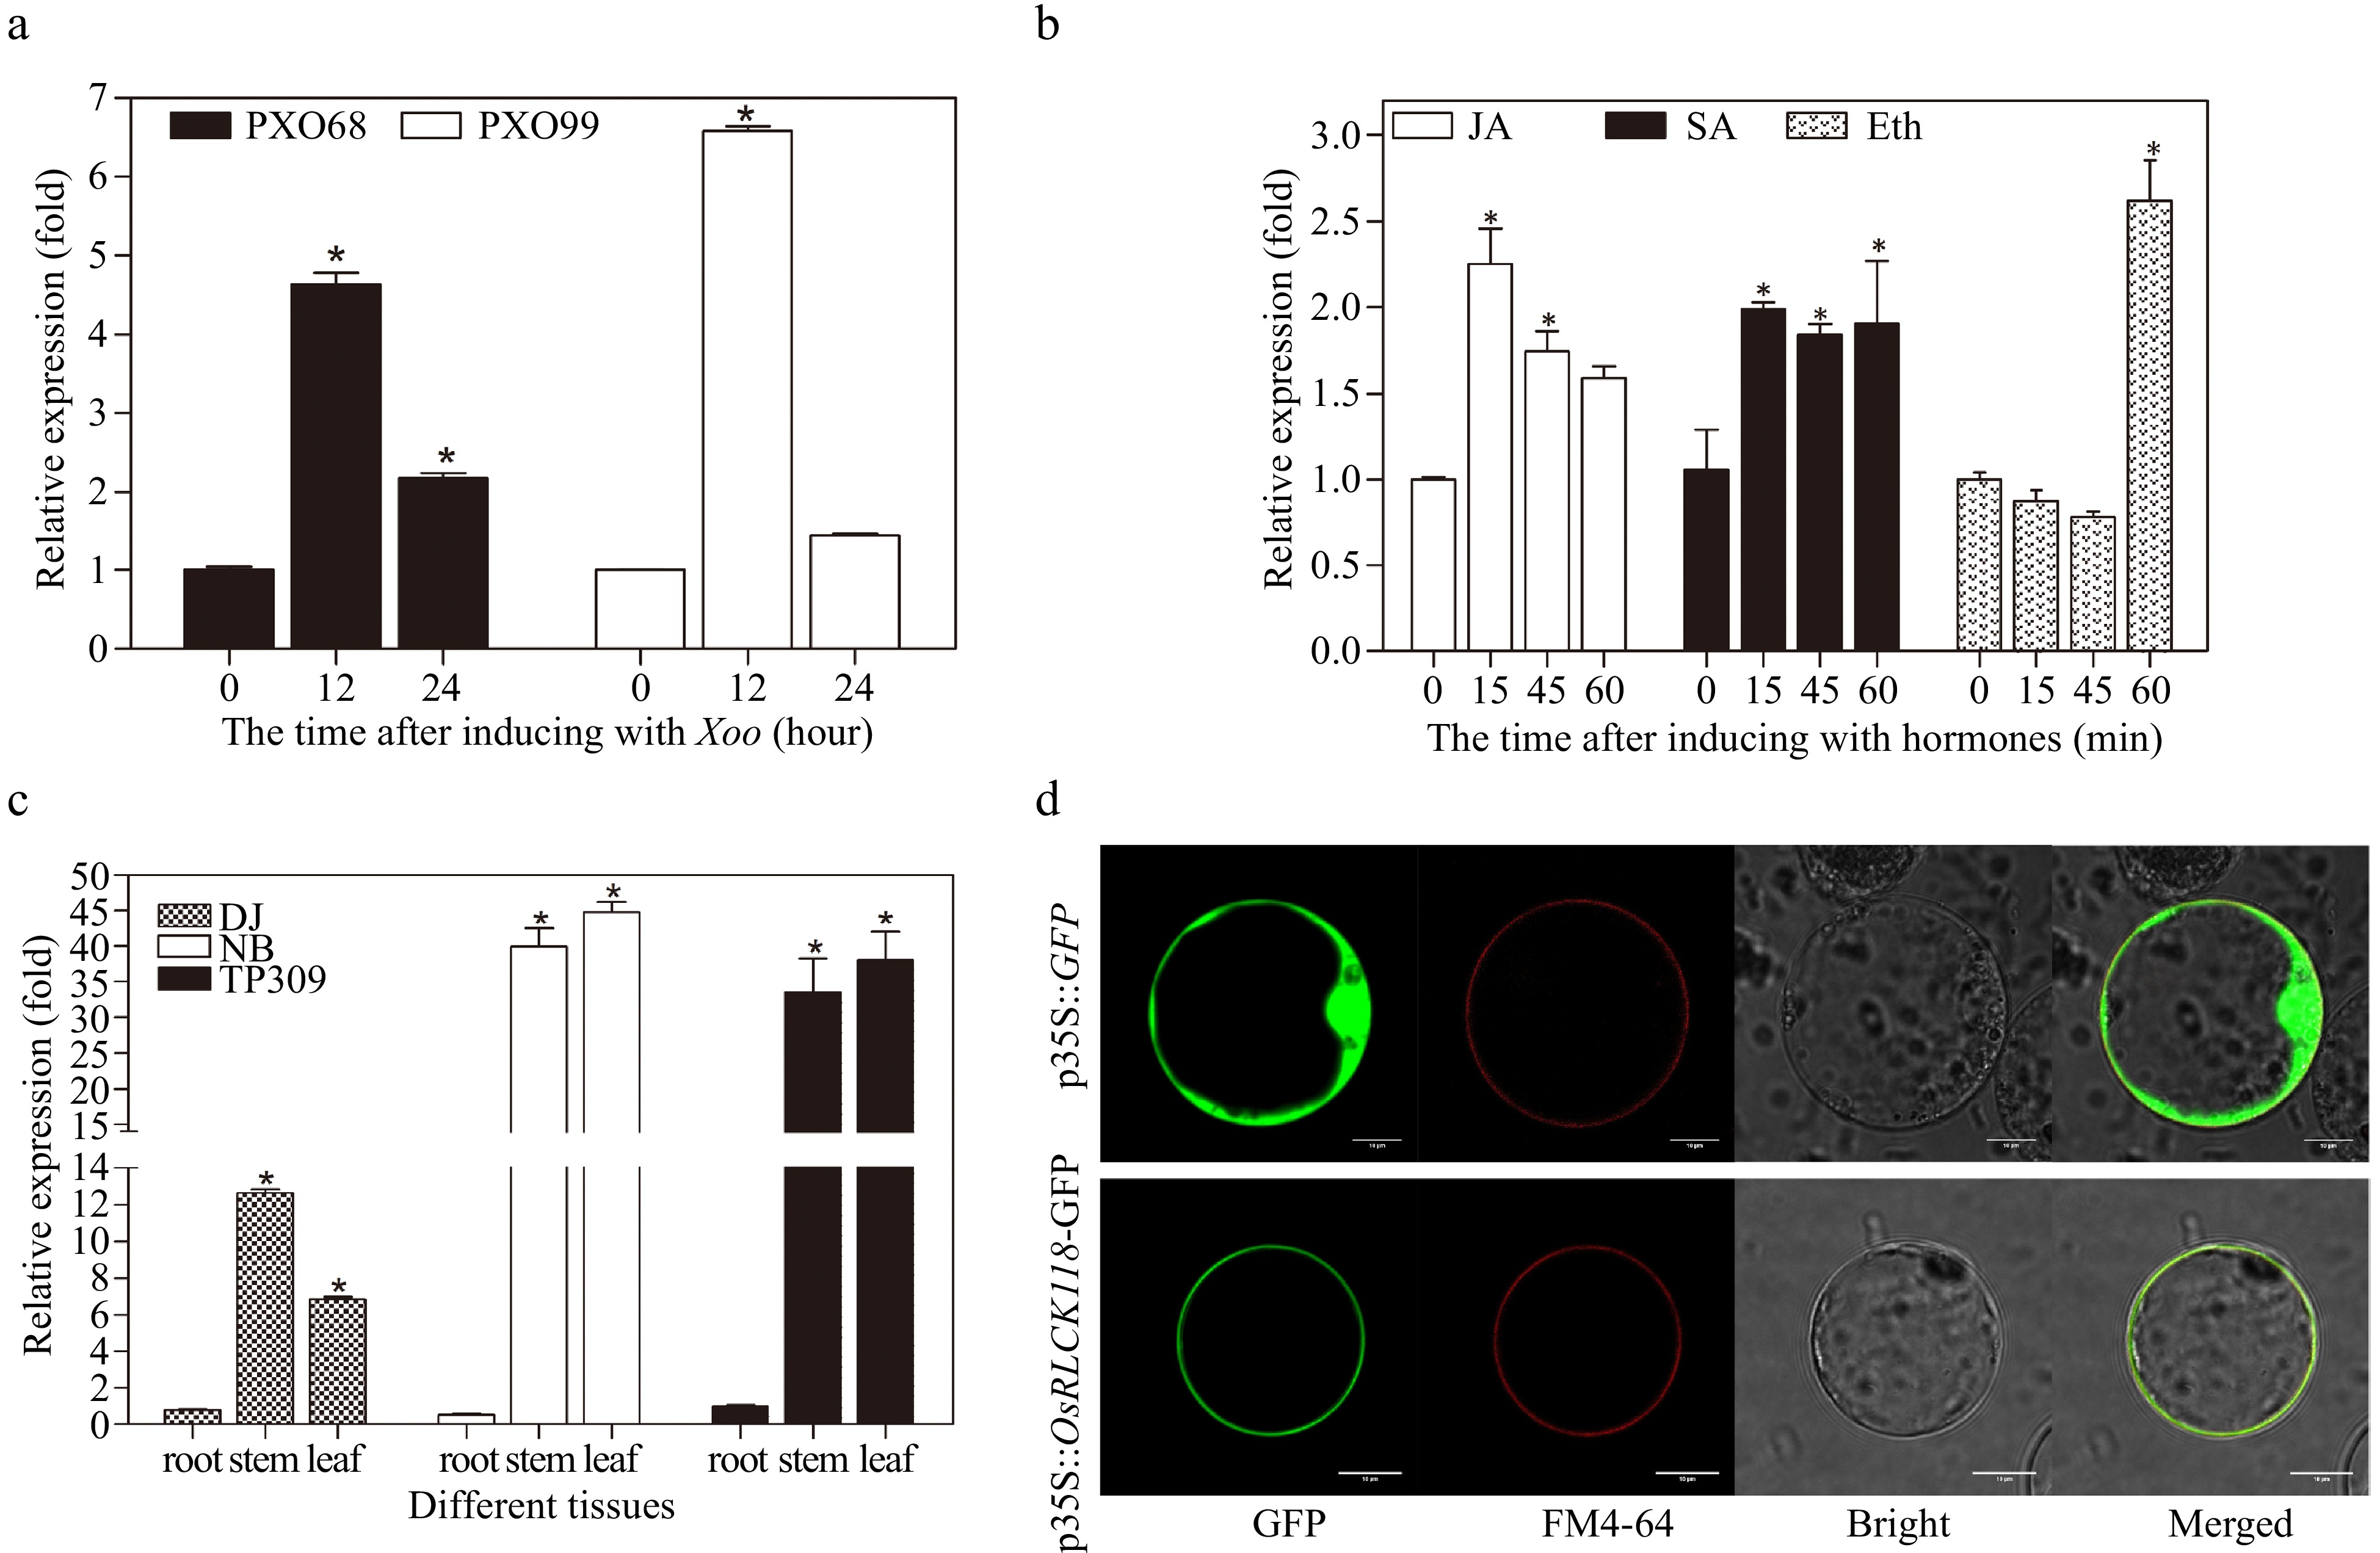
Figure 1.
Expression pattern and subcellular localization of the receptor-like cytoplasmic kinase OsRLCK118. (a) Transcriptional levels of OsRLCK118 in plants inoculated with pathogens Xoo strains PXO68 and PXO99 via qRT-PCR. (b) Expression of OsRLCK118 in plants sprayed with JA, SA and ETH, respectively. (c) Relative expression levels of OsRLCK118 in root, stem and leaf of TP309, DJ and NB rice plants. Relative expression levels of OsRLCK118 in treatments are compared against control plants treated with water. Relative expression levels of OsRLCK118 were characterized by normalization to reference GAPDH gene. Three biological replicates were performed. Error bars represent standard deviation (SD). Asterisks indicate significant differences (P < 0.05) by one-way ANOVA followed by Tukey HSD. (d) Subcellular localization of OsRLCK118 fused with green fluorescent protein (GFP) in rice protoplast. Naked-GFP-expressing construct (35S::GFP) was used as control. The fluorescence signals were detected under a Laser confocal microscopy (Leica Microsystems, Wetzlar, Germany).
-
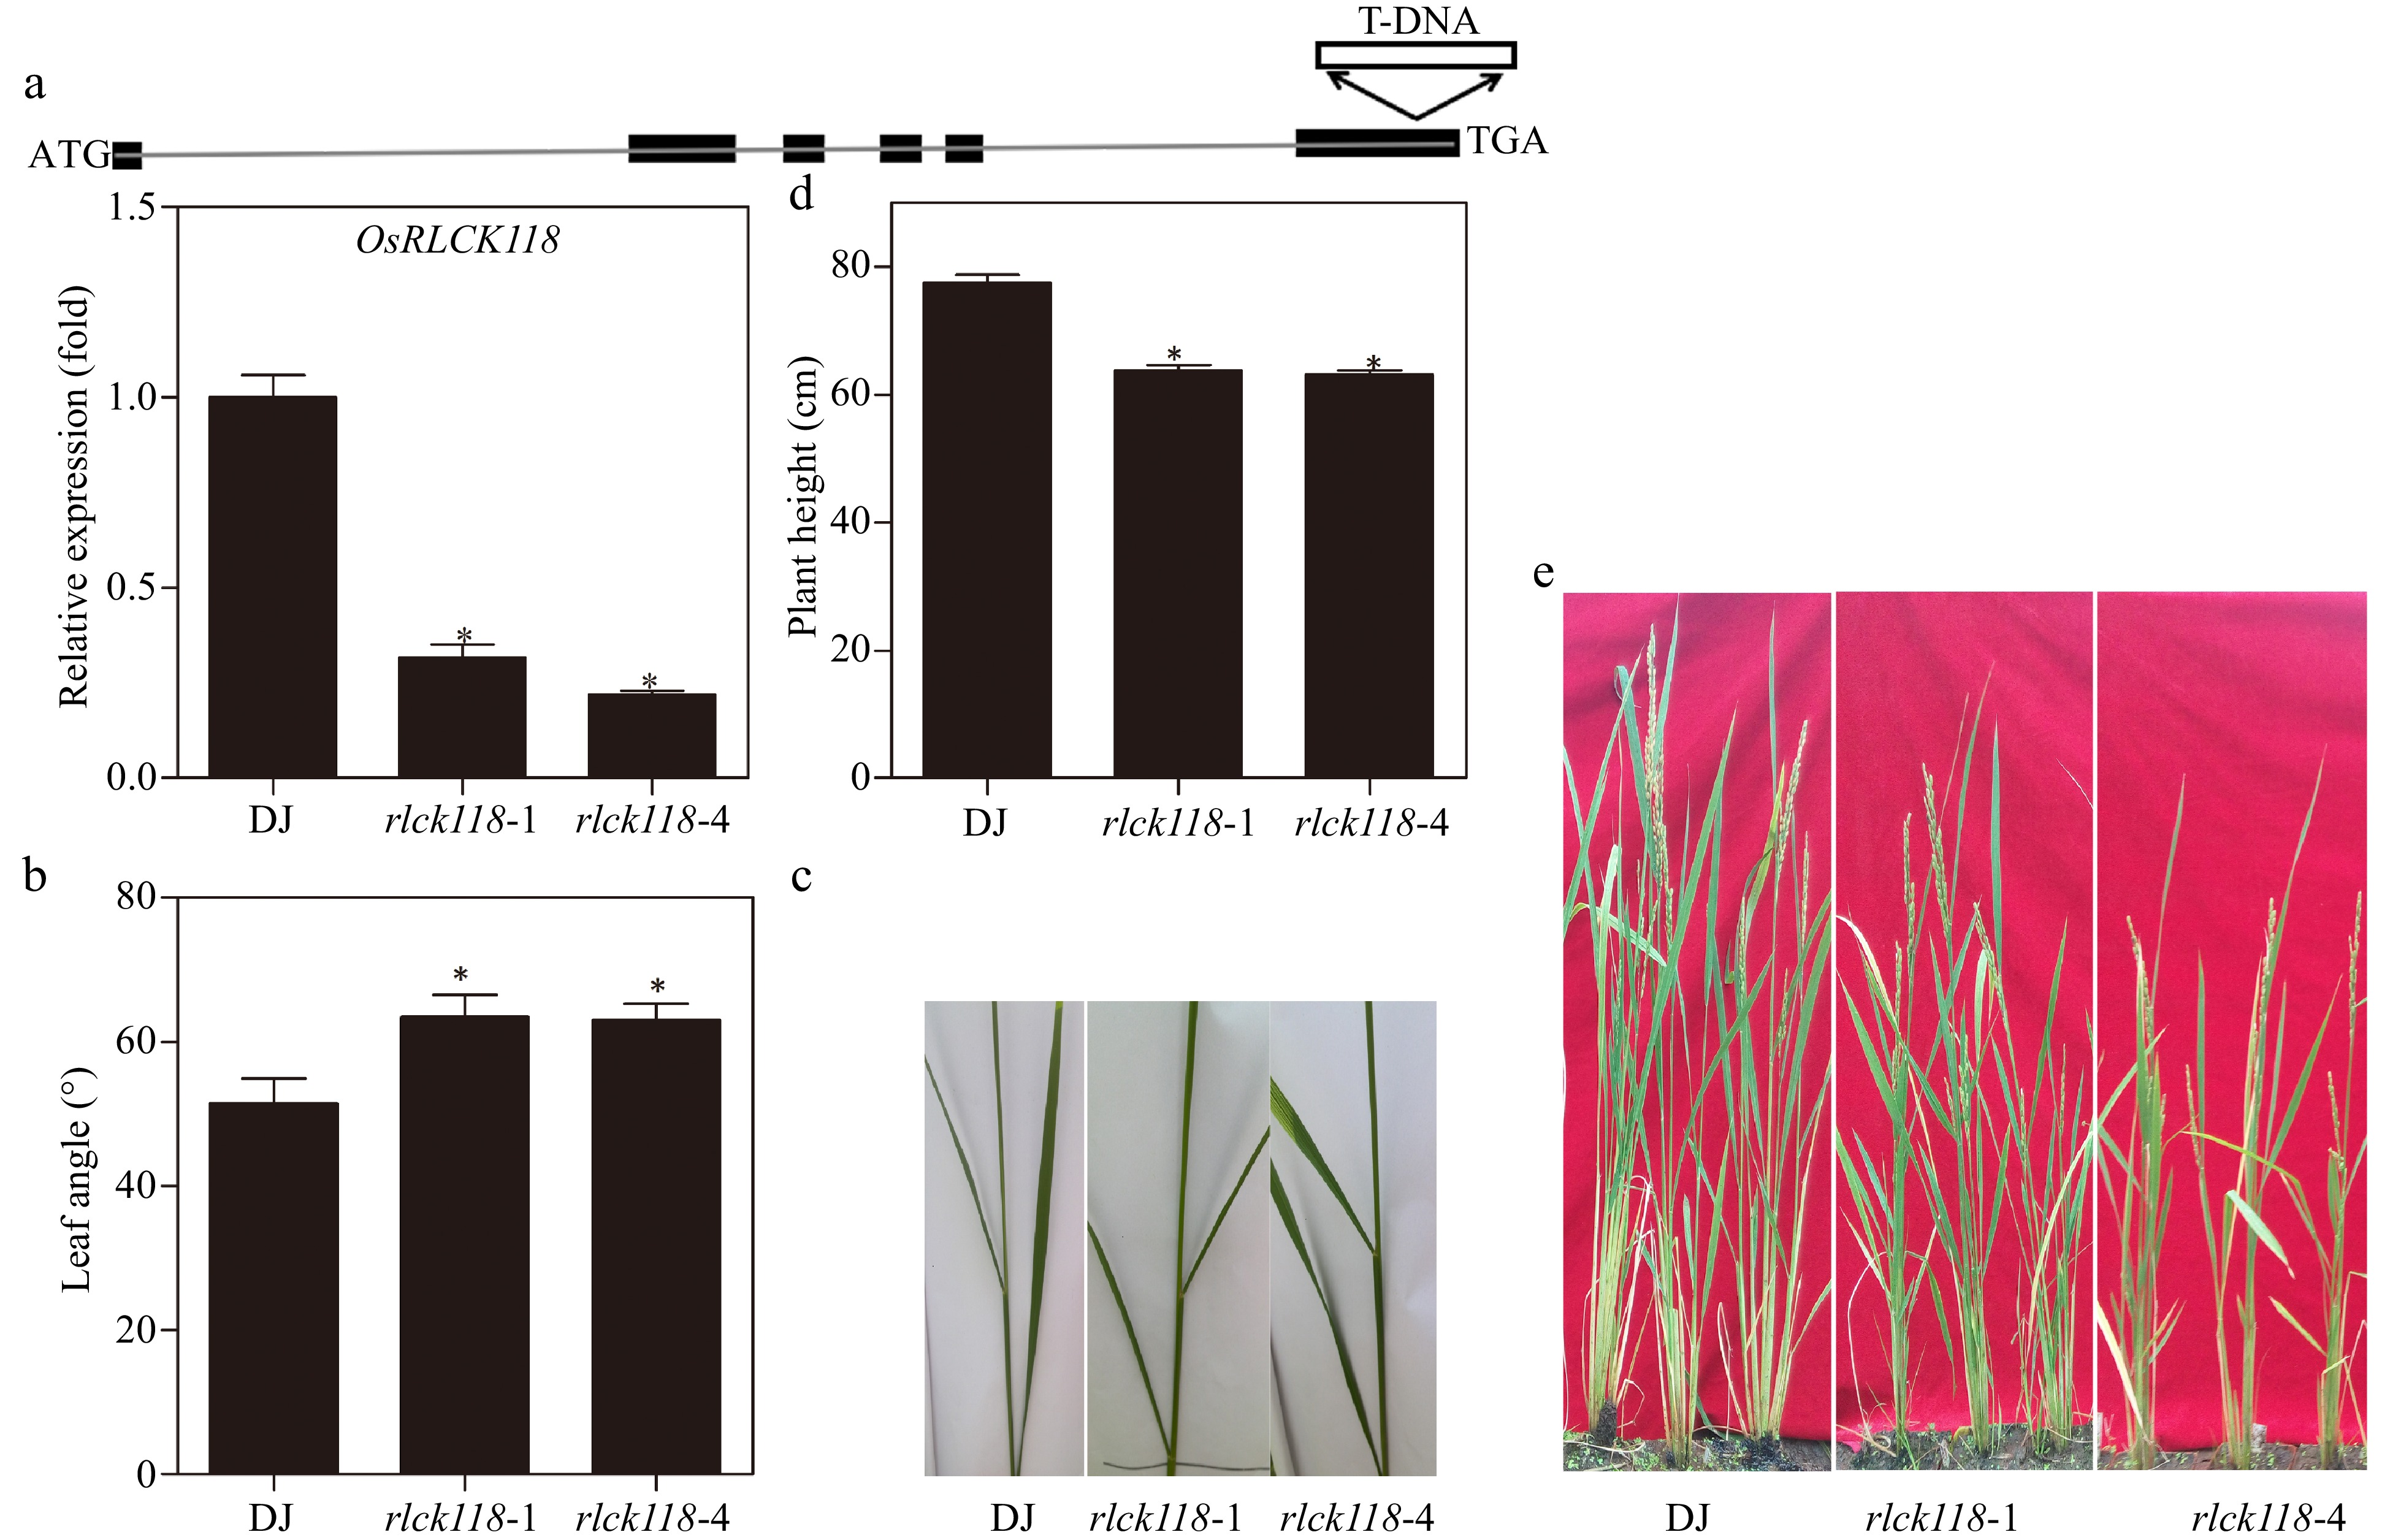
Figure 2.
Heights and leaf angles in OsRLCK118 T-DNA insertion lines. (a) Schematic map of two OsRLCK118 T-DNA insertion plants. Above: The type of T-DNA insertion mutant. Below: Relative transcription levels of OsRLCK118 in wild-type DJ and two independent T-DNA insertion mutant lines (rlck118-1, rlck118-4). (b) Angles of flag leaf and second top leaf of DJ and two mutant (rlck118-1, rlck118-4) plants. (c) Phenotype of angles in DJ and mutant (rlck118-1, rlck118-4) plants. (d) Plant height of different rice lines measured at mature stages. (e) Growth morphology of DJ and mutant (rlck118-1, rlck118-4) plants at maturity stage. Asterisks indicate significant differences (P < 0.05) compared to wild-type DJ by one-way ANOVA followed by Tukey HSD. Averages and SDs were calculated from 20 leaves of representative rice lines as indicated.
-

Figure 3.
Basal disease resistance of OsRLCK118 in Arabidopsis and rice. (a) FRK1pro::LUC assay induced by flg22 in Arabidopsis protoplasts. Above: The FRK1::LUC assay using induction of flg22 treatment for 3 h in Arabidopsis protoplasts. Protoplasts prepared from Col-0 and bik1 leaves were co-transfected with/without 35S::OsRLCK118-FLAG together with FRK1::LUC and 35S::RLUC plasmids. Below: Western blot assay, showing the expression level of OsRLCK118 protein fused with Flag-tag Peptide in protoplasts. Anti-Flag, Anti-Flag antibody; CCB, Coomassie blue staining; Col-0, wild-type; bik1, Arabidopsis bik1 mutant; bik1+OsRLCK118, transiently overexpression of OsRLCK118 in the bik1 protoplasts; Col-0+OsRLCK118, transiently overexpression of OsRLCK118 in wild-type Col-0 protoplasts. flg22/mock means that the ratio of LUC activities after treated with flg22 and water. Asterisks indicate significant differences (P < 0.05) compared to wild-type Col-0 by one-way ANOVA followed by Tukey HSD. (b) Lesion lengths and areas of different rice lines after inoculation with M. orzae Y34. Lesion lengths (left Y-axis) and areas (right Y-axis) were measured with Image J software at day 7 post-inoculation with Y34. (c) Lesion phenotype on representative leaves from DJ and mutant (rlck118-1, rlck118-4) at day 7 post-inoculation with Y34. (d) Lesion lengths of different rice lines after inoculation with Xoo strains PXO68 and PXO99. Lesion lengths were measured at day 14 post-inoculation. (e) Lesion lengths on representative leaves from DJ and T-DNA insertion mutant (rlck118-1, rlck118-4) at day 14 post-inoculation with PXO68 and PXO99. Asterisks indicate significant differences (P < 0.05) compared to wild-type DJ by one-way ANOVA followed by Tukey HSD.
-

Figure 4.
Leaf clipping inoculation of OsRLCK118OE and OsRLCK118KO plants in bacterial blight resistance. (a) Information for the OsRLCK118 knockout plants. (b) Relative expression levels of OsRLCK118 in two overexpressor lines (OsRLCK118OE1, OsRLCK118OE7). (c) Lesion lengths were measured at day 14 post-inoculation with PXO99 using the leaf clipping method. (d) Lesion phenotype on representative leaves from wild-type (TP309), OE lines (OsRLCK118OE1, OsRLCK118OE7) and knockout lines (OsRLCK118KO1, OsRLCK118KO5) at day 14 post-inoculation with PXO99. Asterisks indicate significant differences (P < 0.05) compared to wild-type by one-way ANOVA followed by Tukey HSD.
-

Figure 5.
Relative expression levels of defense-related genes in different rice plants via qRT-PCR. Relative expression levels of NH1, PR5, PR1a, PR10, ICS1, PAL1 and RbohE were measured. WT: wild-type TP309; OsRLCK118OE7: OsRLCK118 overexpressor plant line; OsRLCK118KO1: OsRLCK118 knockout plant line. Asterisks indicate significant differences (P < 0.05) compared to wild-type DJ by one-way ANOVA followed by Tukey HSD. Error bars indicate standard errors for three biological replicates.
-
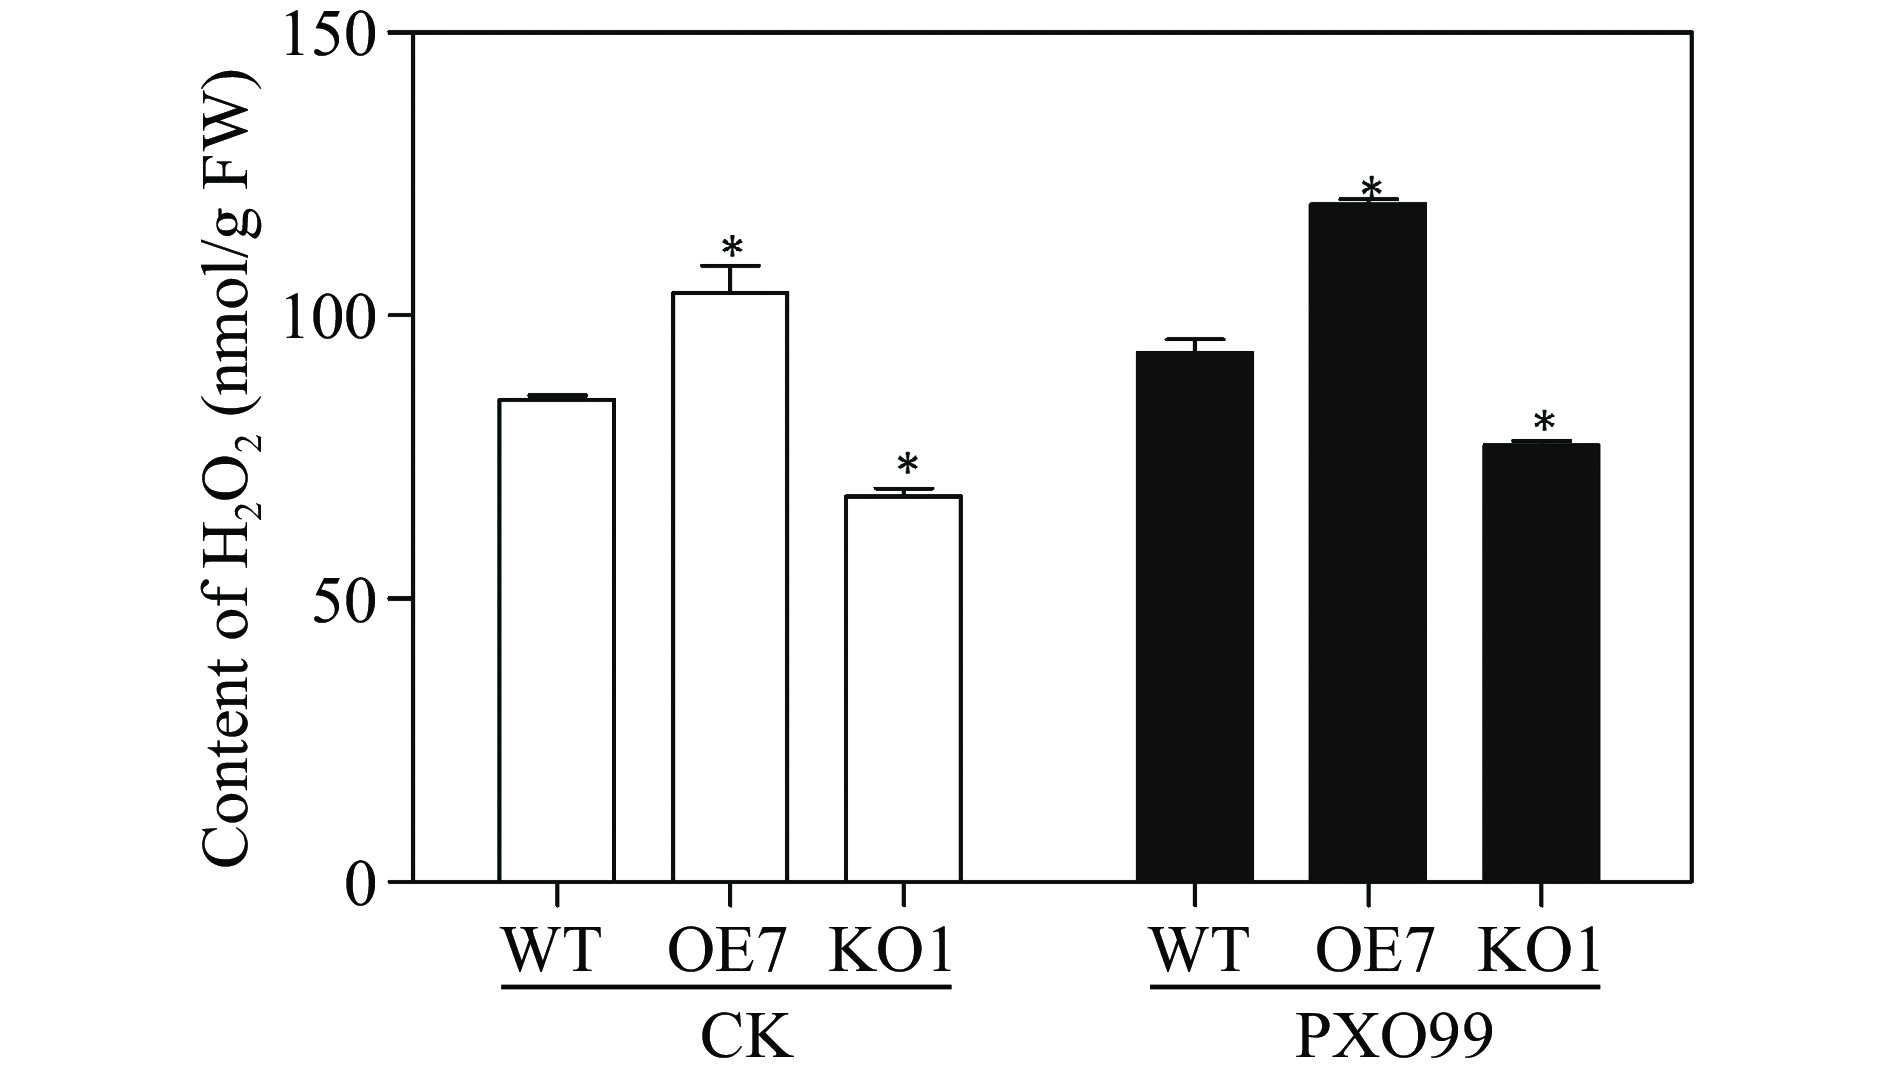
Figure 6.
Measurement of H2O2 in different rice plants inoculated with Xoo. WT: wildtype TP309; OE7: overexpressor plant line OsRLCK118OE7; KO1: knockout plant line OsRLCK118KO1. FW: fresh weight; CK: rice plants inoculated with water; PXO99: rice plants inoculated with Xoo. Asterisks indicate significant differences (P < 0.05) compared to control.
Figures
(6)
Tables
(0)