-
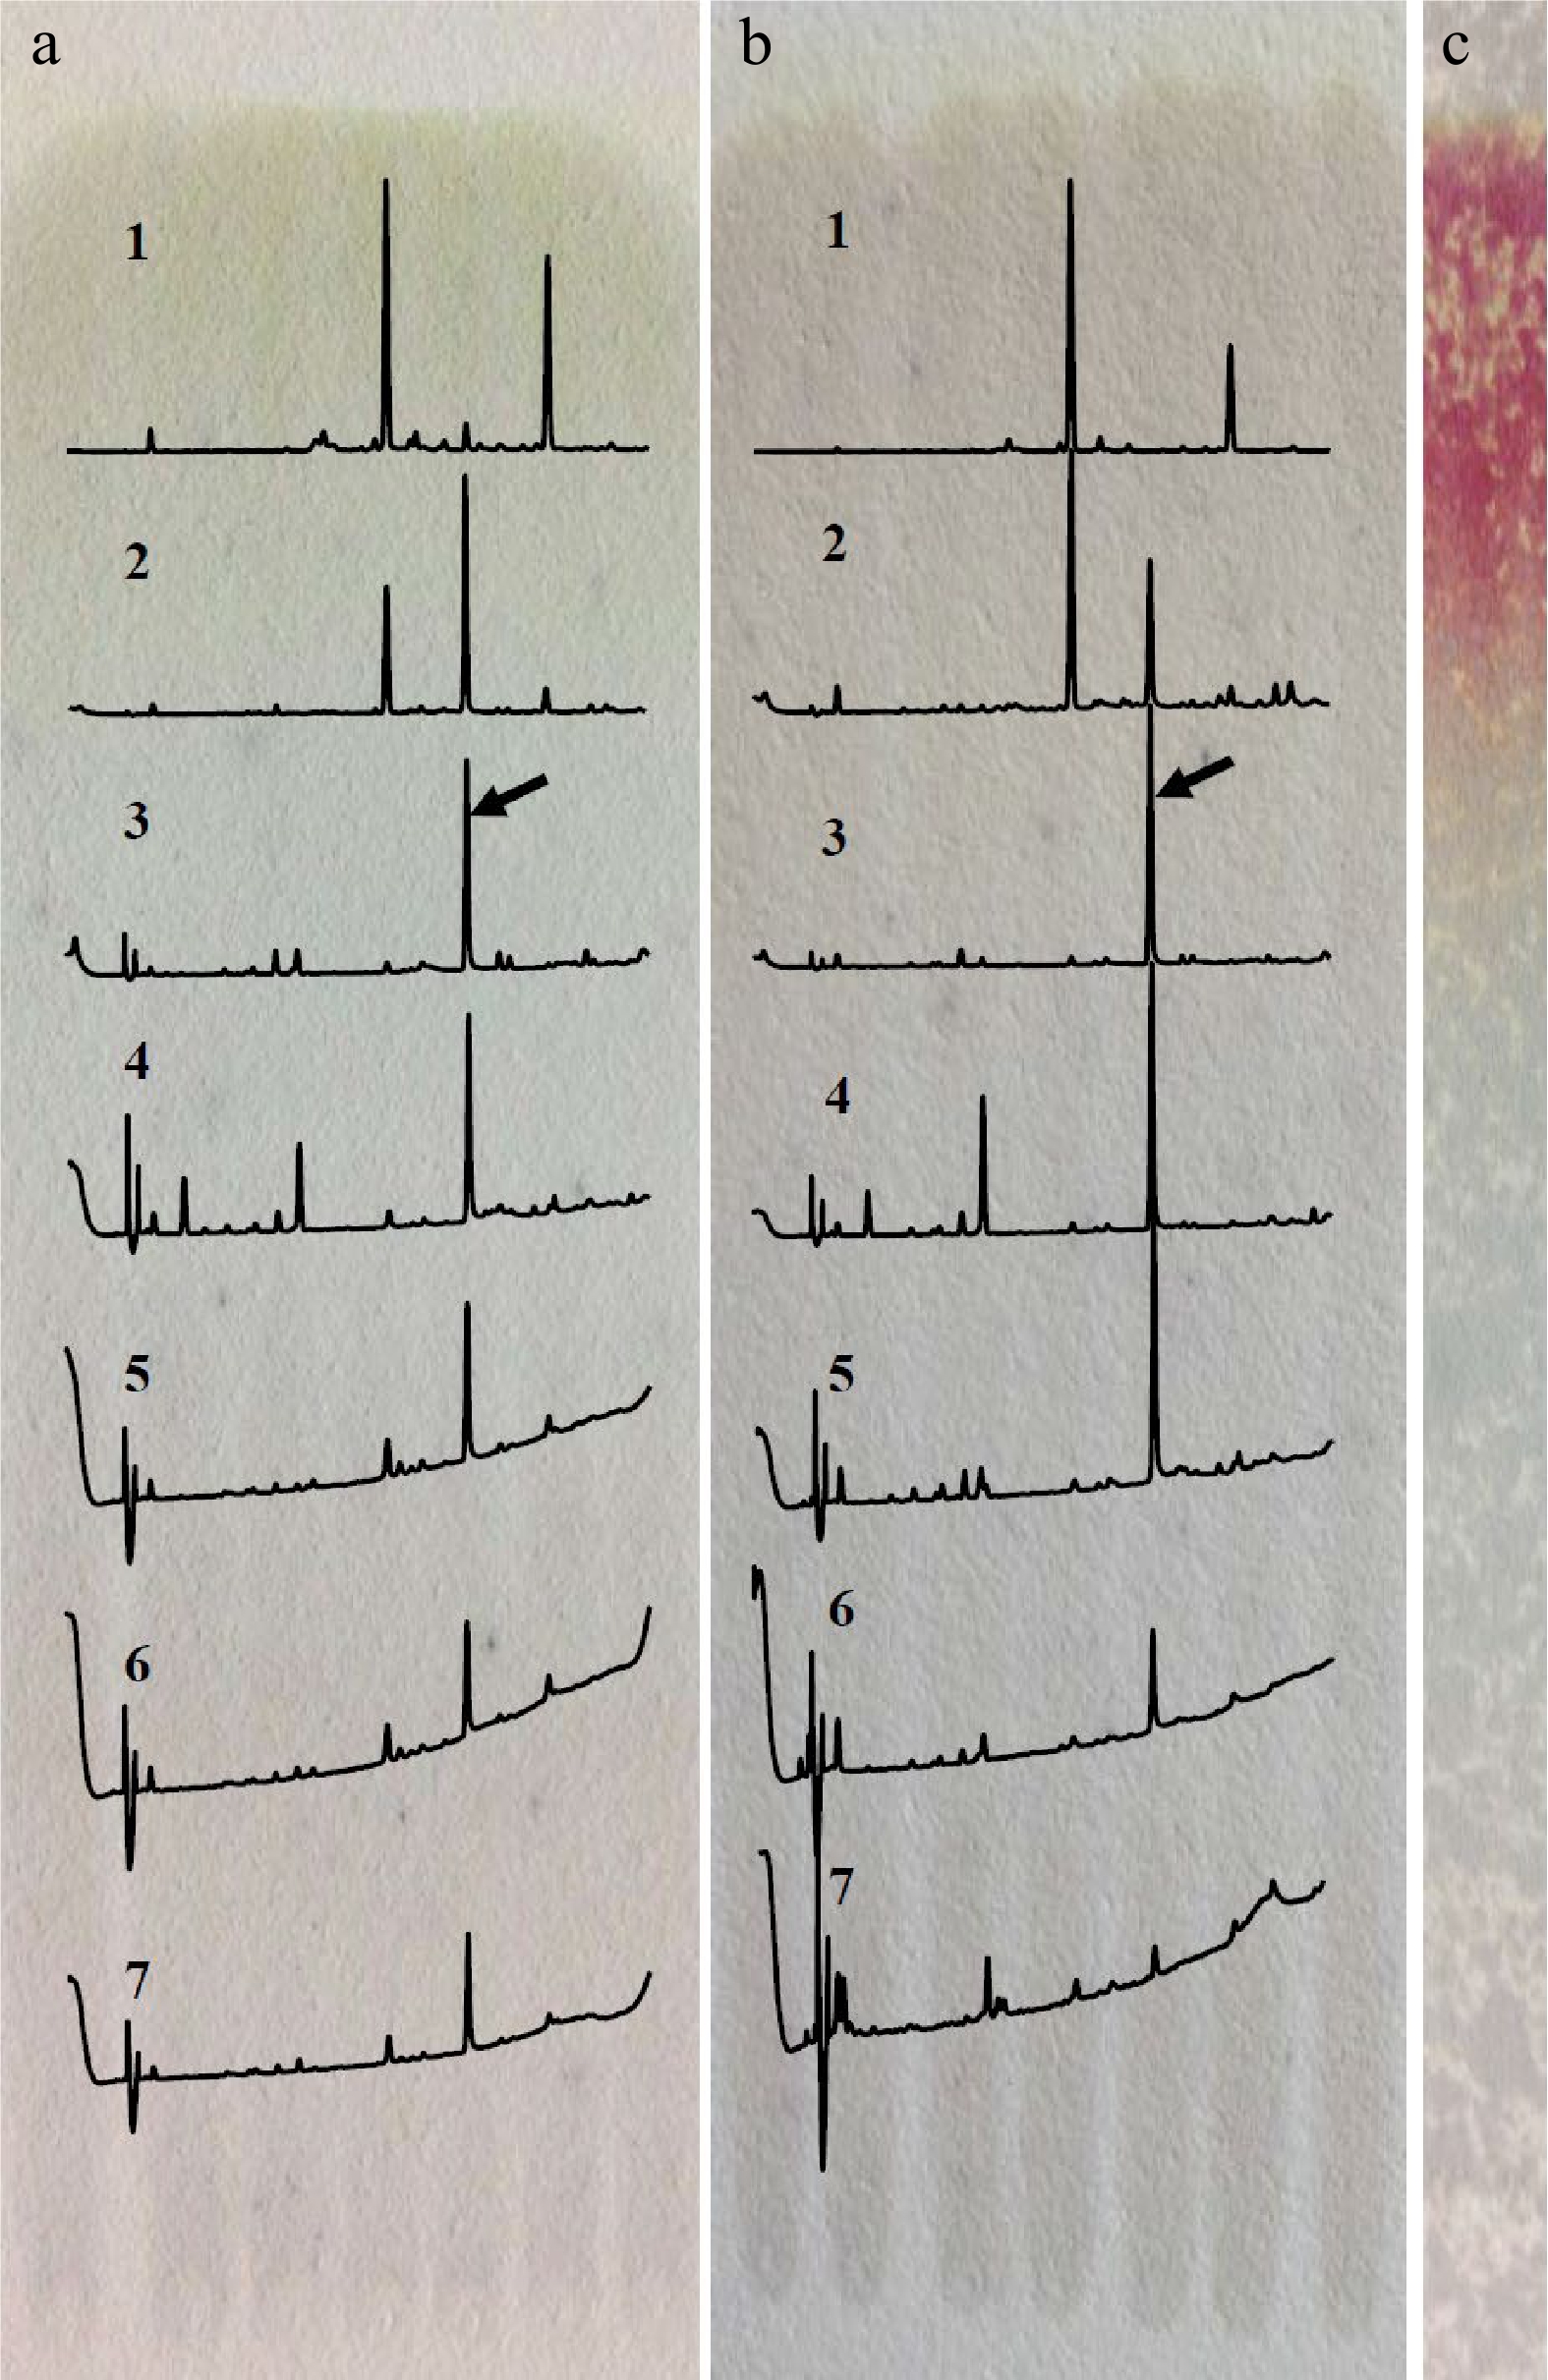
Figure 1.
Separation of the target compound by TLC developed with different solvents. (a) Acetonitrile/acetic acid/water/n-butanol (69.5/20/10/0.5, v/v/v/v). (b) n-butanol/water (3/1, v/v). (c) Staining with vanillin after development with n-butanol/water. 1. RF > 0.85, 2. RF 0.70−0.85, 3. RF 0.55−0.70, 4. RF 0.40−0.55, 5. RF 0.25−0.40, 6. RF 0.10−0.25, 7. RF < 0.10; the array showed the peak of target compound.
-
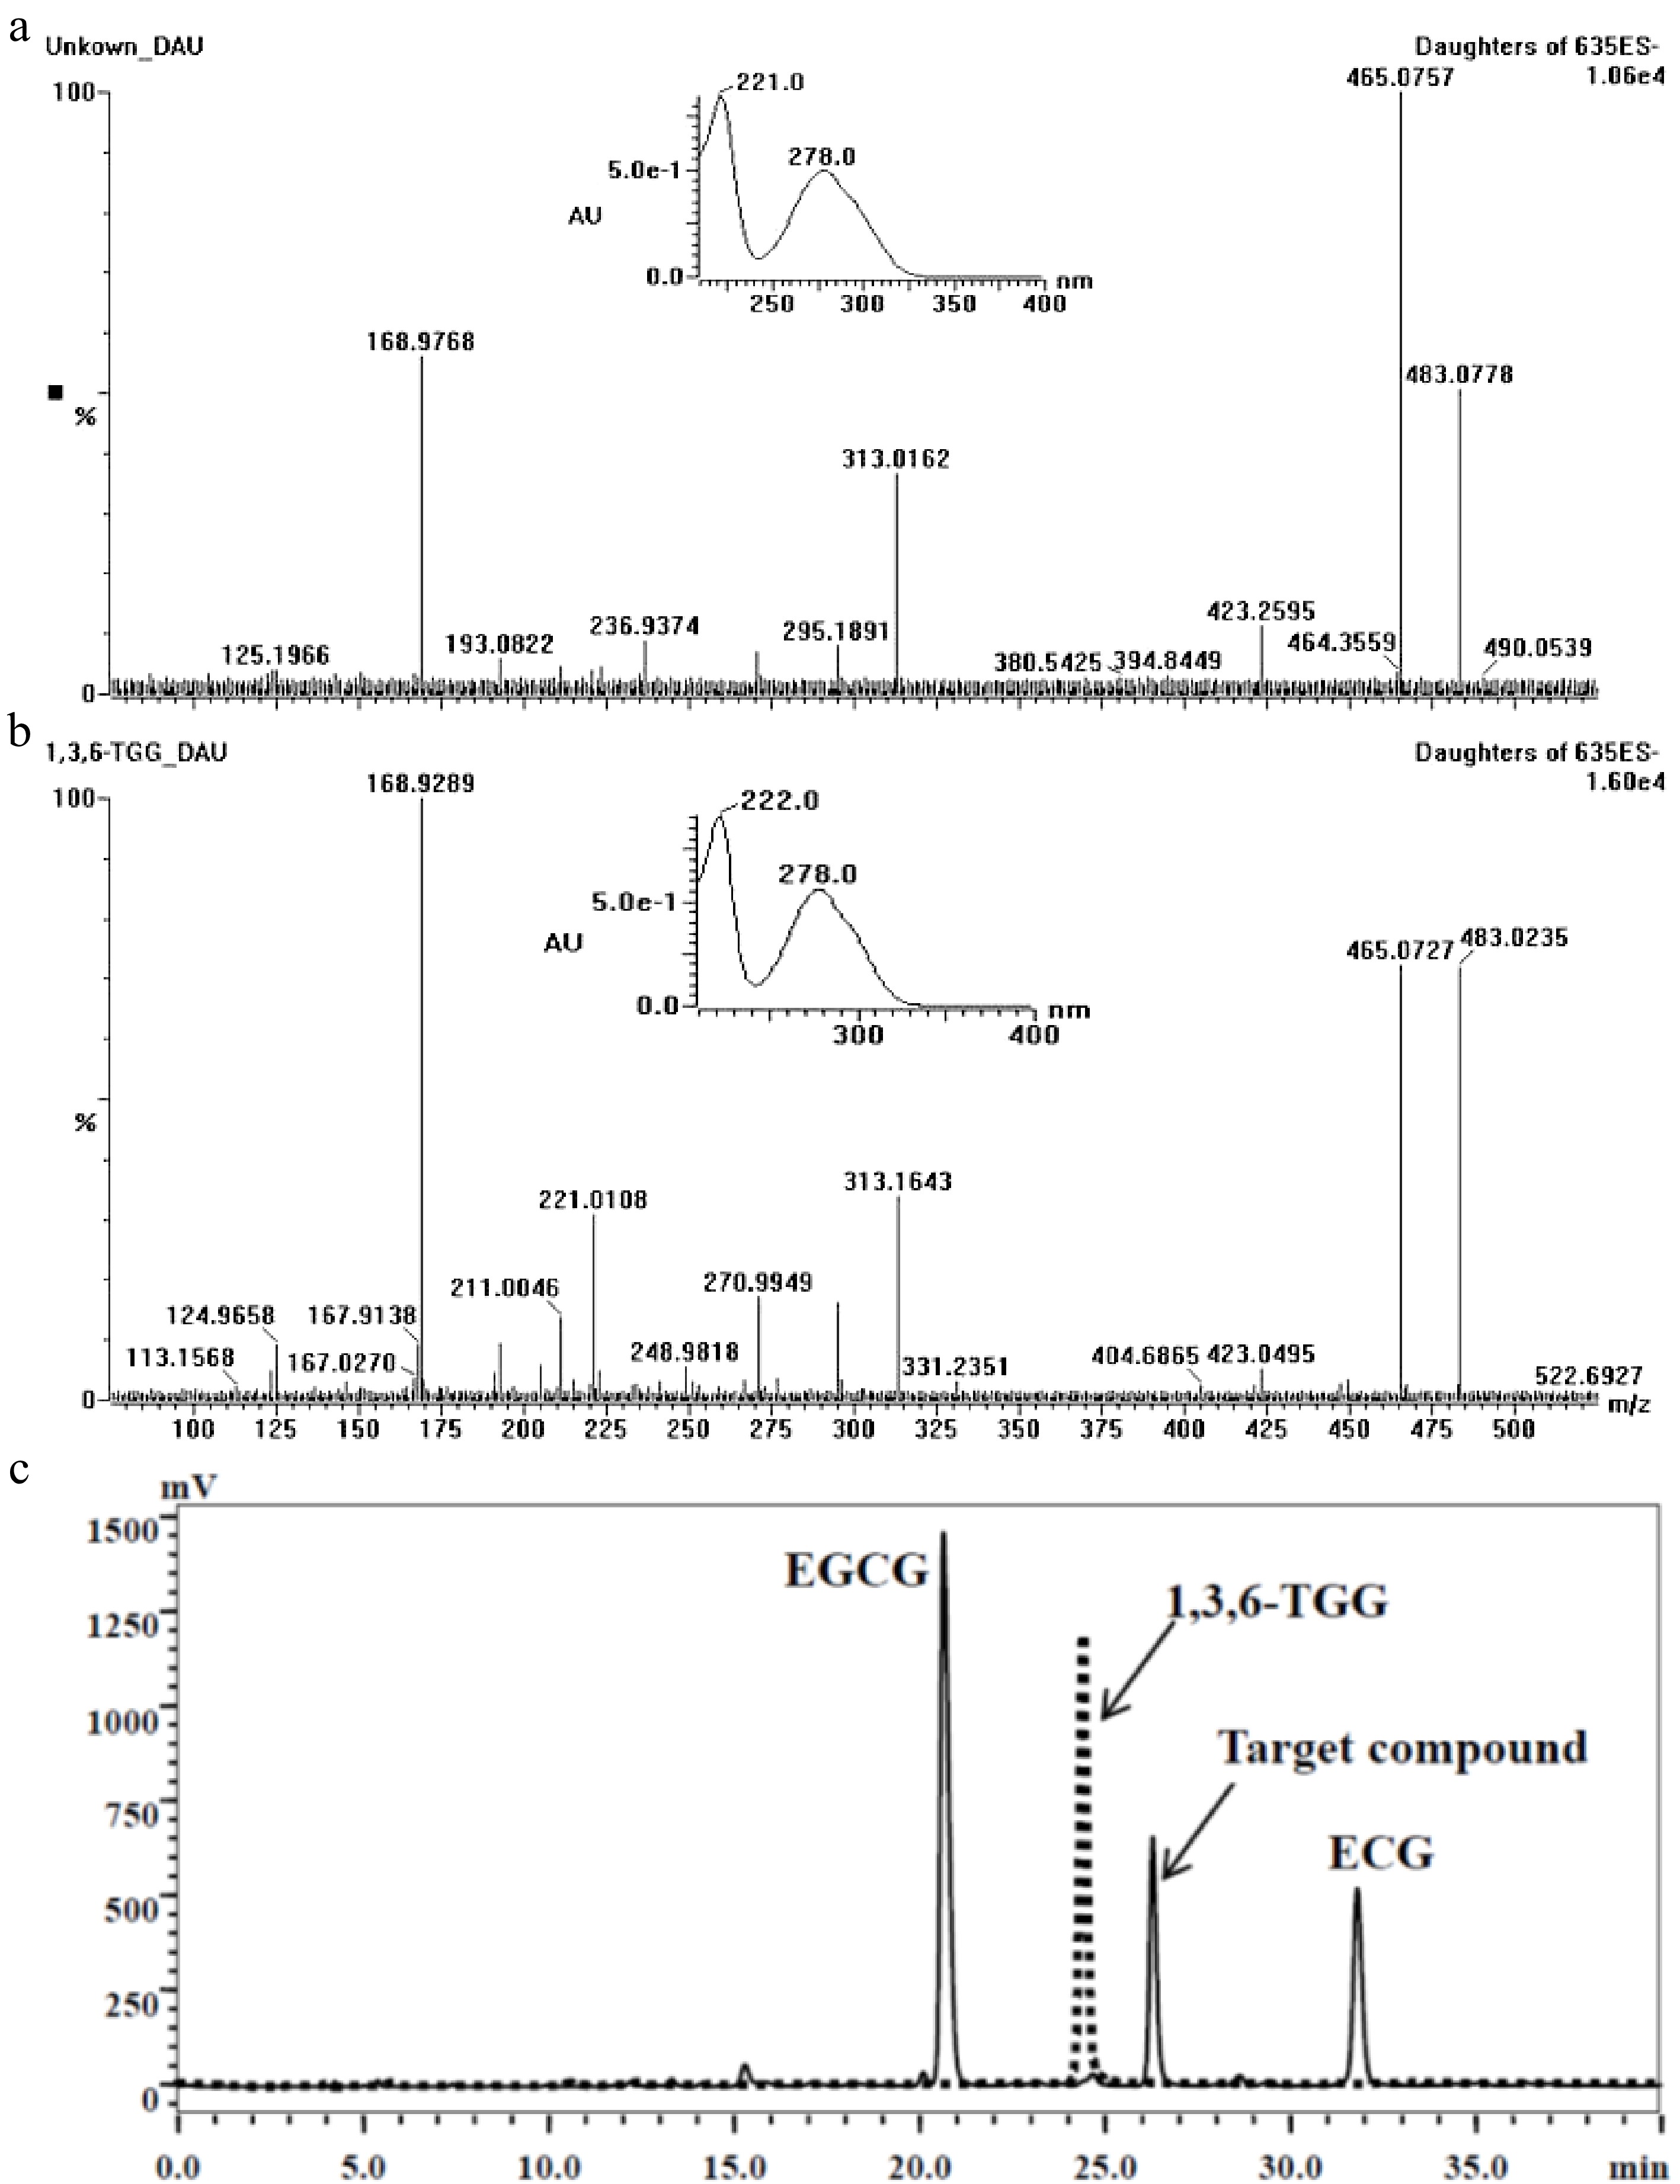
Figure 2.
Comparison of the target compound with 1,3,6-TGG. (a) Daughter ions and UV absorbance of the target compound (m/z 635). (b) Daughter ions and UV absorbance of the 1,3,6-TGG. (c) Different retention time between target compound (solid line) and 1,3,6-TGG (dash line) in HPLC spectrum.
-
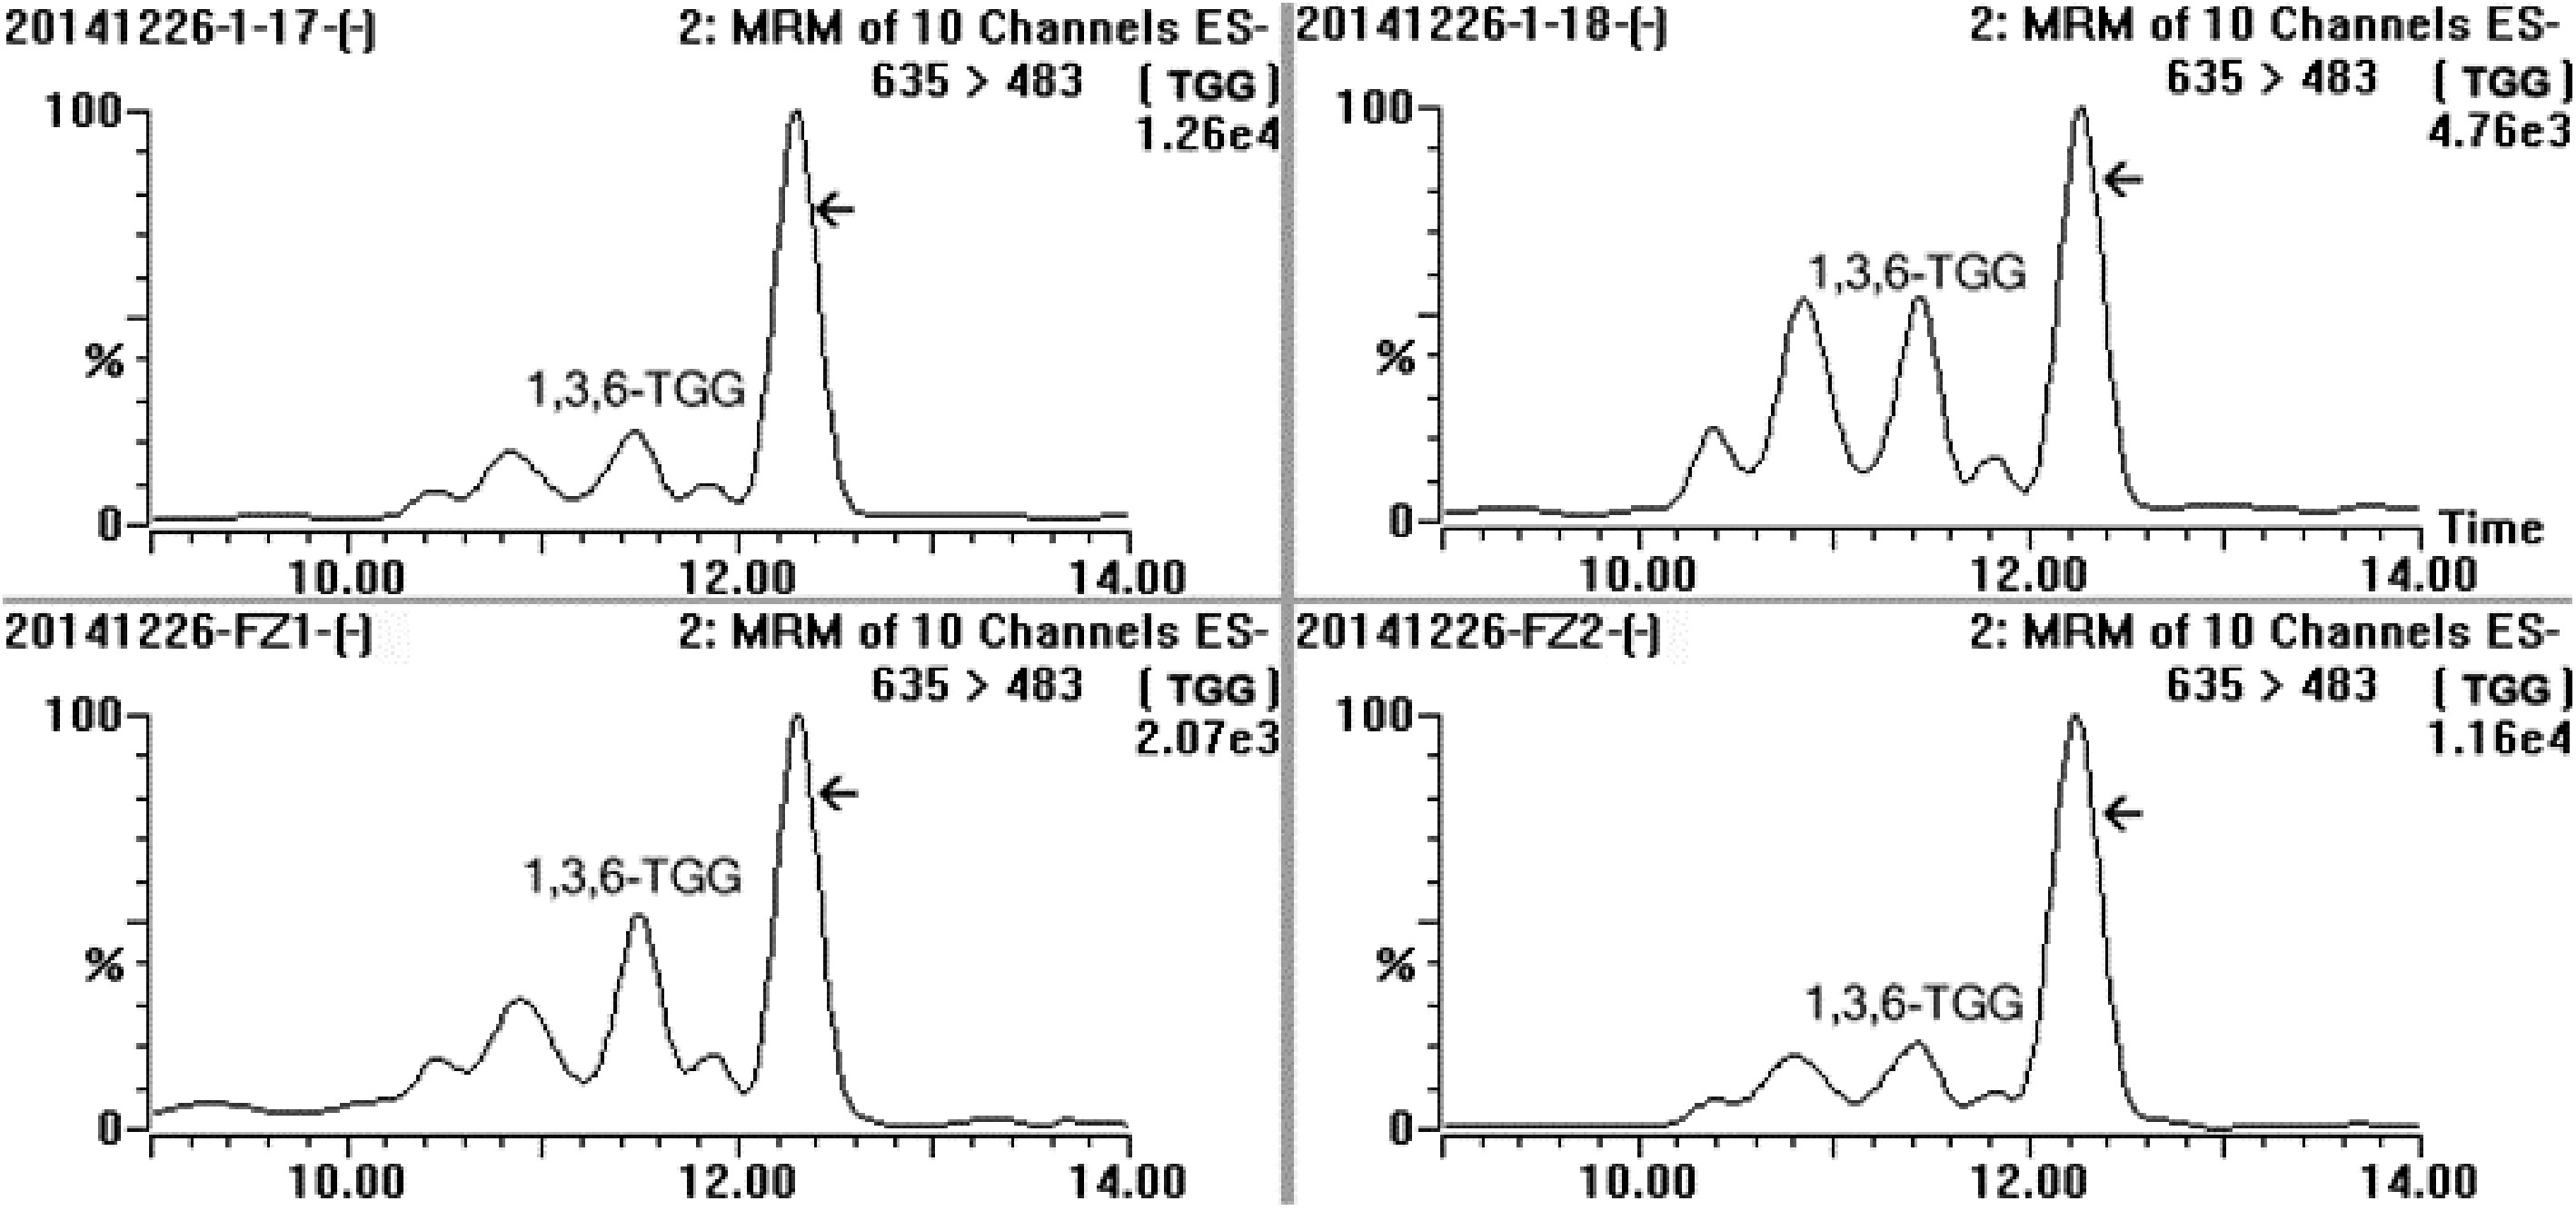
Figure 3.
MRM spectrum of the sample extracted from fresh leaves of four special tea plant clones (‘1-17’, ‘1-18’, ‘FZ1’ and ‘FZ2’) in channel 635/483, and MRM was performed at ES− mode, five distinct compounds were detected and the array indicated the target compound.
-
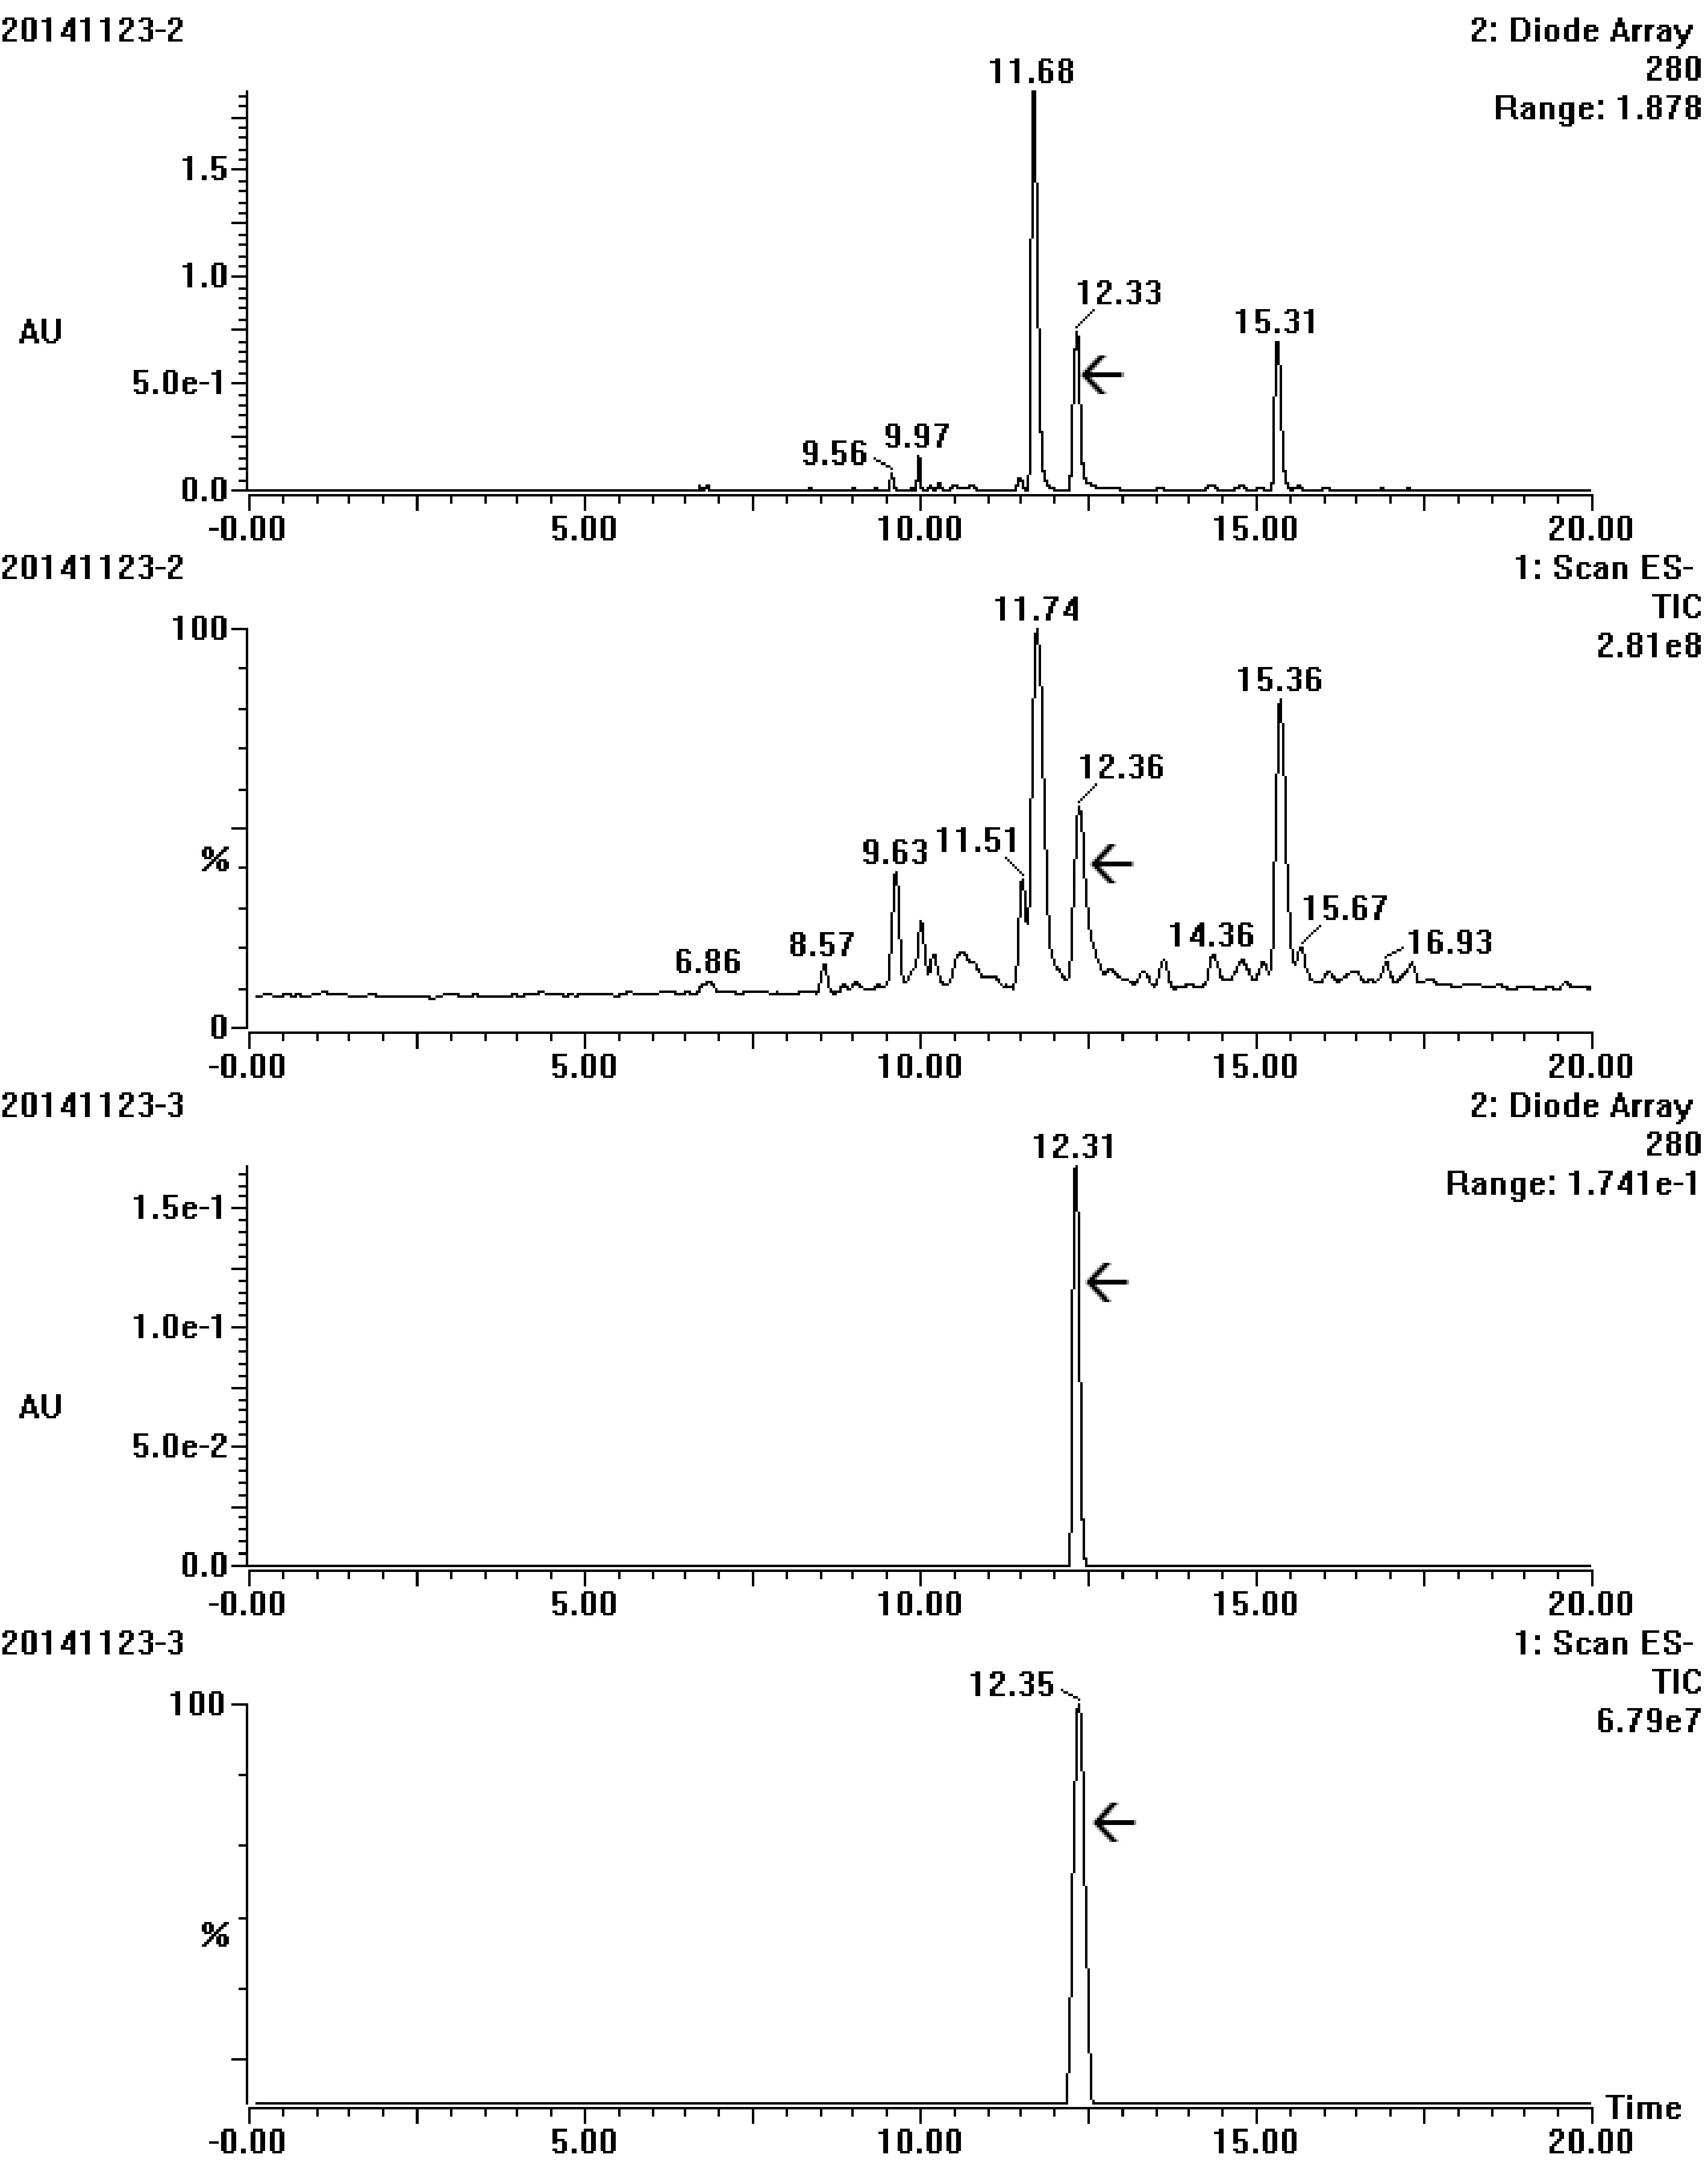
Figure 4.
UV and total ion chromatogram spectrum of the target compound before (20141123-2) and after (20141123-3) purification by semi-preparative chromatography. The array showed the target compound.
-
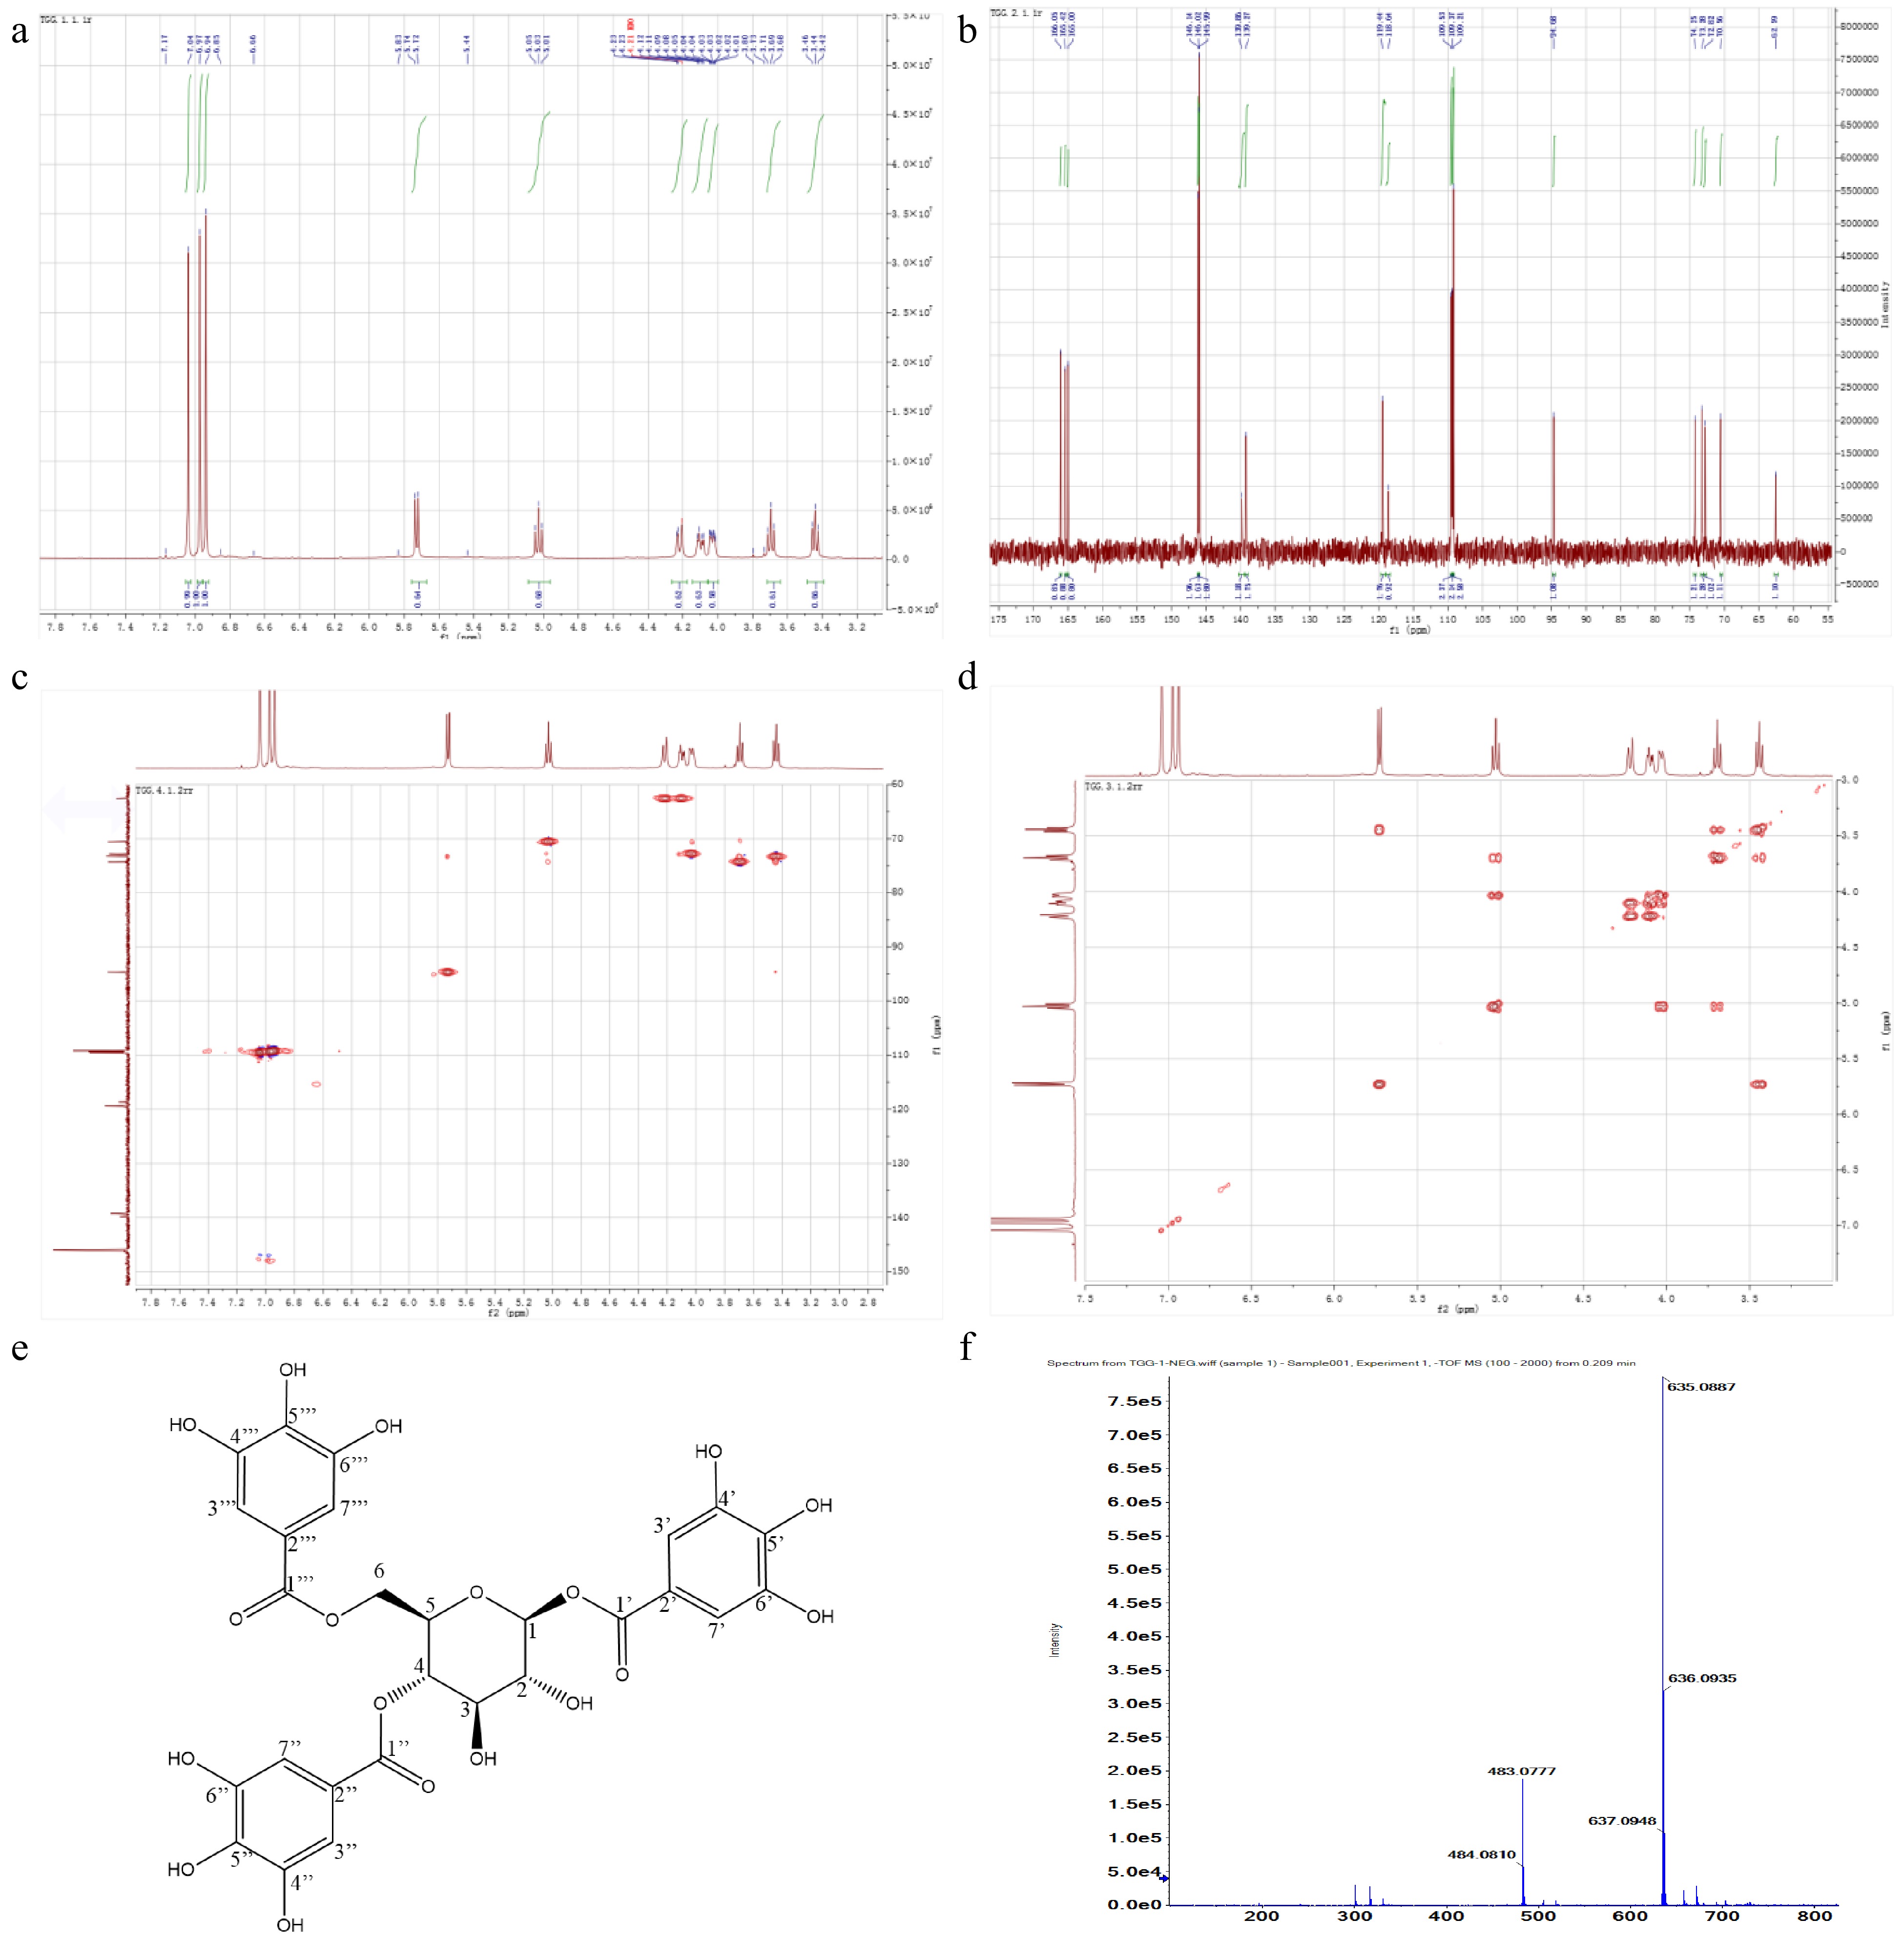
Figure 5.
NMR spectrums and characteristics of target compound. (a) 1H-NMR. (b) 13C-NMR. (c) HMQC. (d) H1-H1 COSY. (e) Chemical structure. (f) Exact molecular weight.
-
Compound ORAC DPPH FRAP 1,4,6-TGG 2.68 ± 0.03b 5.67 ± 0.09b 5.77 ± 0.08b Vitamin C 1.23 ± 0.06c 1.20 ± 0.03c 4.04 ± 0.09c EGCG 2.83 ± 0.02a 6.36 ± 0.12a 6.40 ± 0.13a Antioxidant capacity was expressed as μmol trolox equivalent antioxidant capacity (TEAC) per μmol compound. Different letters in same column showed significant difference (p < 0.05). Table 1.
Antioxidant capacity of the 1,4,6-TGG.
Figures
(5)
Tables
(1)