-
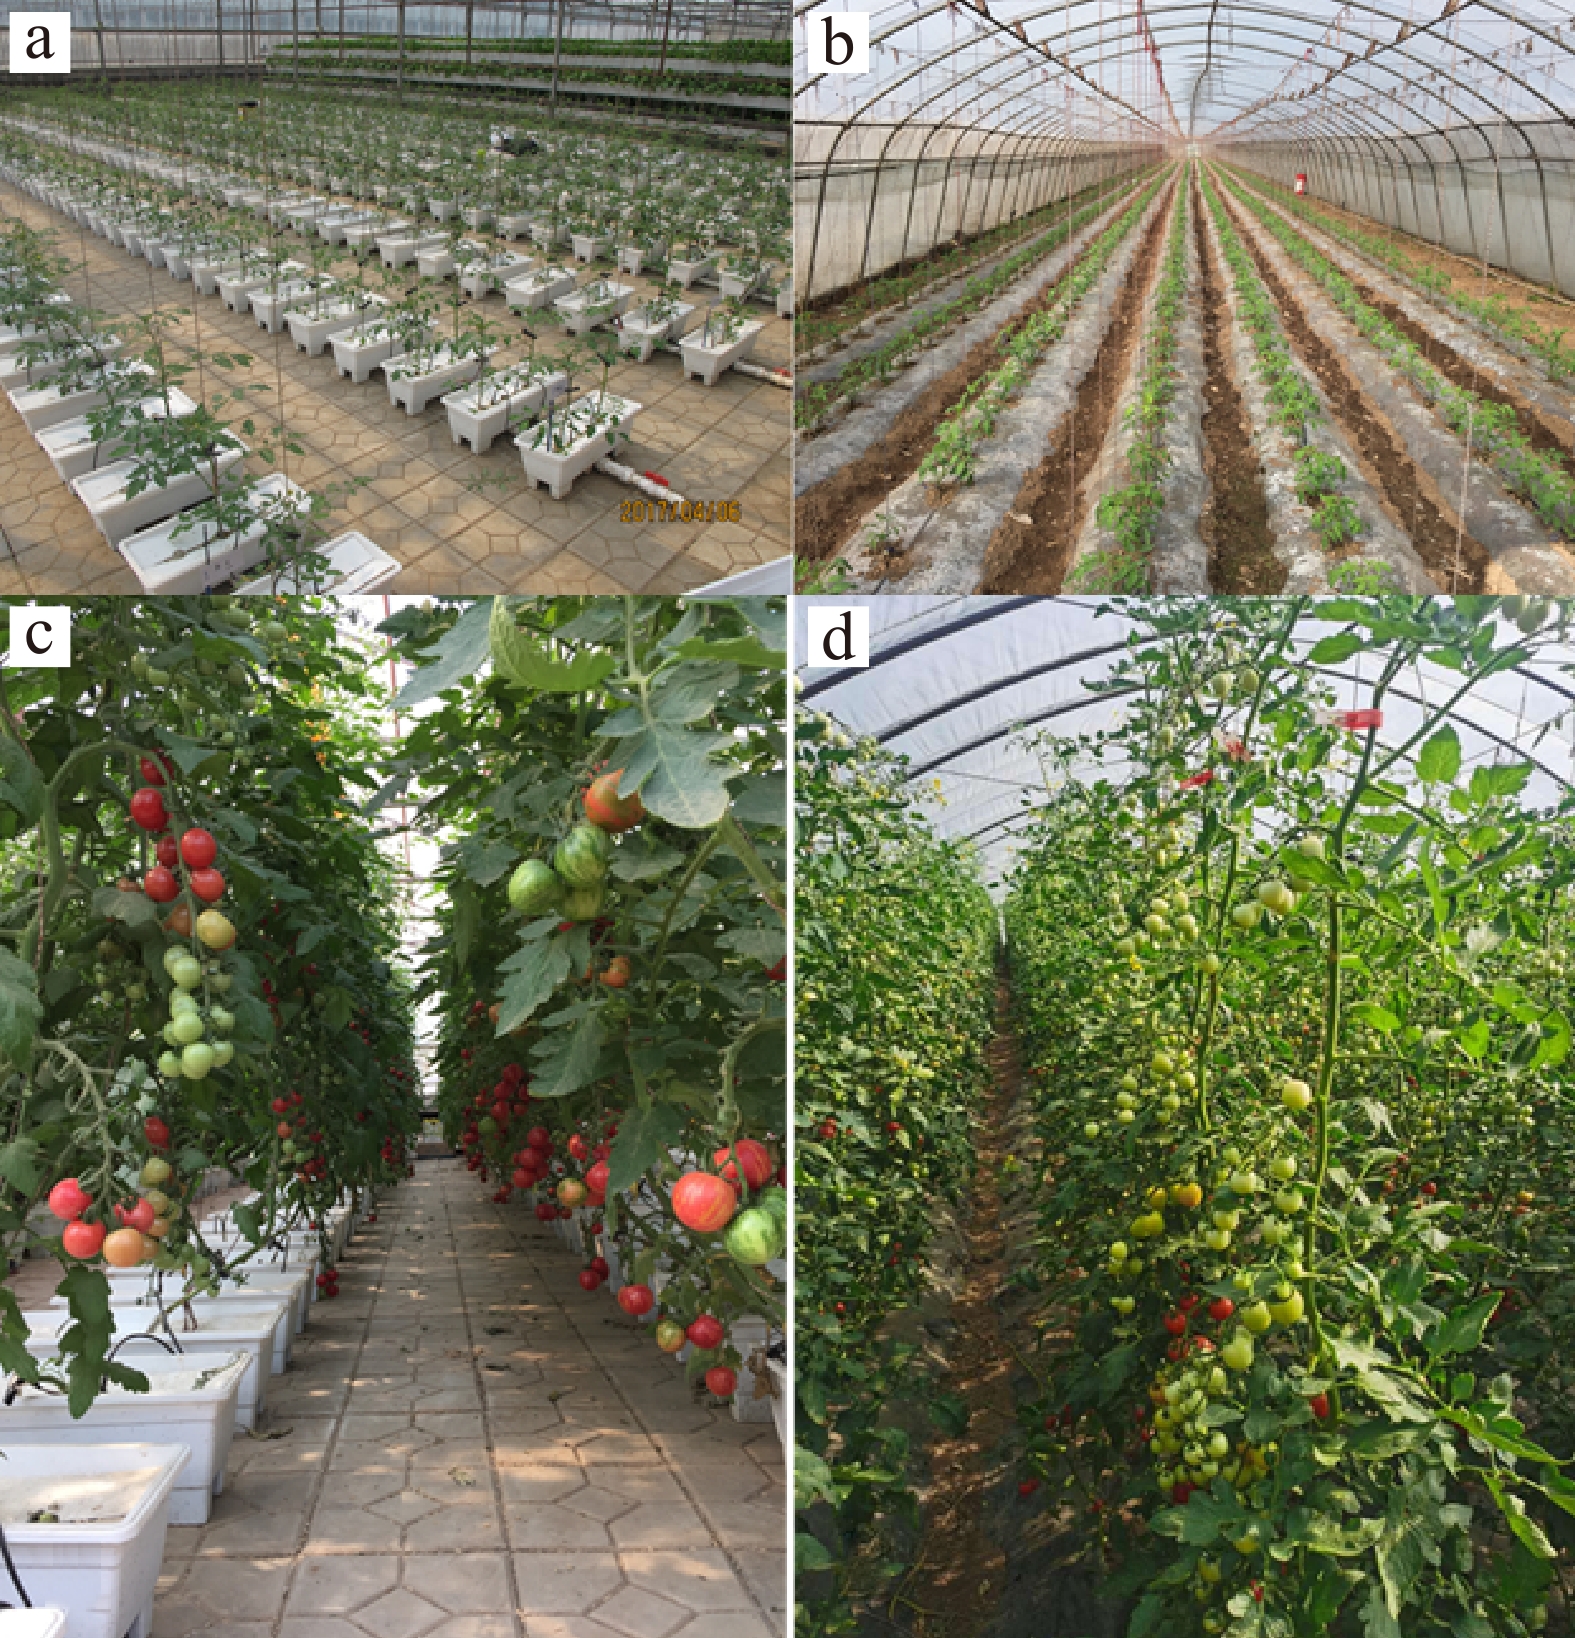
Figure 1.
Tomato soilless cultivation (left) and soil-based cultivation (right) in the greenhouse: (a) inorganic soilless substrate cultivation at seedling stage, (b) soil-based cultivation at seedling stage, (c) inorganic soilless substrate cultivation at fruiting stage, and (d) soil-based cultivation at fruiting stage in tomato cultivar 'Fenyuan'.
-
Trait T1 T2 T3 T4 T5 T6 - soil
as controlExperiment Number of fruit on the base cluster LSM* 3.9b** ± 0.19 4.4a ± 0.17 4.1ab ± 0.17 4.2ab ± 0.16 4.0b ± 0.18 2.3c ± 0.14 2017 Incease%c 69.6*** 91.3 78.3 82.6 73.9 Height (cm) LSM 68.3c ± 1.60 70.4a ± 1.74 69.0bc ± 1.60 70.0ab ± 1.73 68.6c ± 1.62 62.8d ± 1.39 Incease% 8.8 12.1 9.9 11.5 9.2 Stem diameter
(mm)LSM 10.5cd ± 0.51 12.5a ± 0.53 11.4bc ± 0.47 11.8ab ± 0.54 11.1bc ± 0.50 9.9d ± 0.46 Incease% 6.1 26.3 15.2 19.2 12.1 Vitamin C
(mg/100g)LSM 27.7ab ± 0.73 28.7a ± 0.66 28.0ab ± 0.68 28.4ab ± 0.72 27.4b ± 0.63 24.5c ± 0.84 2018 one Incease% 13.1 17.1 14.3 15.9 11.8 Soluble solids
(%)LSM 6.9b ± 0.10 7.4a ± 0.22 7.0ab ± 0.21 7.2ab ± 0.16 7.0b ± 0.20 6.5c ± 0.12 Incease% 6.2 13.8 7.7 10.8 7.7 Total soluble sugar
content (mg/g)LSM 50.5ab ± 1.45 52.2a ±1.65 50.7ab ± 1.55 51.5ab ± 1.74 49.9b ± 1.50 43.2c ± 1.01 Incease% 16.9 20.8 17.4 19.2 15.5 Nitrate content
(mg/kg)LSM 94.1b ± 6.20 99.0b ± 4.85 97.3b ± 4.92 97.7b ± 5.40 97.0b ± 4.60 118.2a ± 2.93 Incease% −20.4 −16.2 −17.7 −17.3 −17.9 Number of fruit
clustersLSM 7.7b ± 1.82 8.2a ± 1.87 7.8b ± 1.87 8.0ab ± 1.89 1.86 ± 1.86 6.4c ± 2.26 2018 two Incease% 20.3 28.1 21.9 25.0 20.3 Fruit yield
(kg/667m2)LSM 5,177.4a ± 493.52 5,239.2a ± 497.37 5,197.4a ± 496.82 5,212.6a ± 494.75 5,184.2a ± 492.28 4,163.8b ± 312.27 Incease% 24.3 25.8 24.8 25.2 24.5 Number of fruits
per clusterLSM 19.5bc ± 0.18 20.9a ± 0.16 19.9abc ± 0.13 20.5ab ± 0.15 19.7abc ± 0.13 19.1c ± 0.12 Incease% 2.1 9.4 4.2 7.3 3.1 Single fruit
weight (g)LSM 15.3a ± 0.51 16.2a ± 0.50 15.8a ± 0.56 15.8a ± 0.45 15.5a ± 0.51 14.3b ± 0.74 Incease% 7.0 13.3 10.5 10.5 8.4 Fruit cracking
rate (%)LSM 0.3b ± 0.16 0.7b ± 0.26 0.7b ± 0.23 0.9b ± 0.25 0.7b ± 0.21 5.4a ± 1.29 Incease% −94.4 −87.0 −87.0 −83.3 −87.0 Vitamin C
(mg/100g)LSM 18.9a ± 0.59 20.3a ± 0.52 19.3a ± 0.54 19.7a ± 0.59 19.0a ± 0.54 15.9b ± 1.19 2019 Incease% 18.9 27.7 21.4 23.9 19.5 Soluble solids
(%)LSM 6.3a ± 0.09 6.5a ± 0.22 5.7b ± 0.17 5.9b ± 0.16 5.9b ± 0.16 5.7b ± 0.12 Incease% 10.5 14.0 0.0 3.5 3.5 Total soluble sugar
content (mg/g)LSM 40.5a ± 1.67 42.0a ± 1.87 40.8a ± 1.78 41.6a ± 1.87 40.5a ± 1.69 35.6b ± 0.26 Incease% 13.7 18.1 14.6 17.0 13.9 Fruit yield
(kg/667m2)LSM 6,664.7a ± 155.79 6,663.2a ± 154.10 6,580.0a ± 170.30 5,985.3b ± 150.85 5,958.7b ± 157.21 5,816.2c ± 187.86 Incease% 14.6 14.6 13.1 2.9 2.5 Nitrate content
(mg/kg)LSM 357.4b ± 14.68 362.9b ± 14.47 354.4b ± 16.34 359.0b ± 14.36 352.9b ± 13.07 644.5a ± 63.00 increase% −44.5 −43.7 −45.0 −44.3 −45.2 * LSM = least squared mean for each trait in each of the six treatments and standardize error
** significant at P = 0.05 level in raw.
*** Increase% = percentage increase for each of the five nutrient solutions from T1 to T6 compared to the control (T6) = 100 × (Tn − T6)/T6, such as for 'Number fruit first era' in T1 treatment of the 2017 experiment = 100 × (T1 − T6)/T6 = 100 × (3.9 − 2.3)/2.3 = 69.6%Table 1.
Comparison of tomato traits affected by five treatments (T1 to T5) of nutrient components for soilless cultivation and the control (T6) for soil cultivation.
-
Trait Soilless Soil Increase%** Experiment Number of fruit on base cluster 4.1a ± 0.18* 2.3b ± 0.14* 79.1** 2017 Height (cm) 69.3a ± 1.66 62.8b ± 1.39 10.3 Stem diameter (mm) 11.5a ± 0.51 9.9b ± 0.50 15.8 Vitamin C (mg/100g) 28.0a ± 0.68 24.5b ± 0.84 14.4 2018 one Soluble solids (%) 7.1a ± 0.18 6.5b ± 0.12 9.2 Total soluble sugar content (mg/g) 51.0a ± 1.58 43.2b ± 1.01 18.0 Nitrate content (mg/kg) 97.0b ± 5.19 118.2a ± 2.93 −17.9 Number of fruit cluster 7.9a ± 1.86 6.4b ± 2.26 23.1 2018 two Fruit yield (kg/667m2) 5,202.2a ± 494.95 4163.8b ± 312.27 24.9 Number of fruits per cluster 20.1a ± 0.15 19.1b ± 0.12 5.2 Single fruit weight (g) 15.7a ± 0.51 14.3b ± 0.74 9.9 Fruit cracking rate (%) 0.7b ± 0.22 5.4a ± 1.29 −87.8 Vitamin C (mg/100g) 19.4a ± 0.56 15.9b ± 1.19 22.3 2019 Soluble solids (%) 6.1a ± 0.16 5.7b ± 0.12 6.3 Total soluble sugar content (mg/g) 41.1a ± 1.78 35.6b ± 0.25 15.5 Fruit yield (kg/667m2) 6,370.4a ± 157.65 5,816.2b ± 187.86 9.5 Nitrate content (mg/kg) 357.3b ± 14.59 644.5a ± 63.00 −44.6 * Significant at P = 0.05 level in raw, the value signifies the least squared mean for each trait in the two treatments and standardize error.
** Increase% = percentage increasing for soilless compared to soil cultivation = 100 × (soilless soil)/soil), such as for 'Number fruit first era' = 100 × (4.1 − 2.3)/2.3 = 79.1%Table 2.
Comparison of physiological and chemical traits between soilless and soil-based cultivations.
-
Cultivar Cultivation Number of fruits
on base clusterHeight
(cm)Stem diameter
(mm)Experiment LSM Increase% LSM* Incease%** LSM Increase% Fenyuan Soilless 4.1a 141.2 62.3a 8.9 12.65a 24.8 2017 Soil 1.7b 57.2b 10.14a Xiariyangguang Soilless 4.2a 82.6 76.1a 13.2 13.96a 34.2 Soil 2.3b 67.2b 10.40b Hongyu Soilless 5.3a 82.8 69.1a 6.1 14.36a 28.8 Soil 2.9b 65.1b 11.15b Yuanwei NO.1 Soilless 4.4a 83.3 79.1a 15.8 9.96a 18.1 Soil 2.4b 68.3b 8.43a Ziyu Soilless 4.2a 90.9 65.2a 16.2 11.8a 22.9 Soil 2.2b 56.1b 9.6a Cultivar Cultivation Vitamin C
(mg/100 g)Soluble solids
(%)Total soluble sugar
content (mg/g)Nitrate content
(mg/kg)Experiment LSM Increase% LSM Increase% LSM Increase% LSM Increase% Fenyuan Soilless 29.65a 26.7 7.91a 20.8 56.21a 23.2 80.6b −29.9
2018 oneSoil 23.41b 6.55b 45.64b 115.0a Xiariyangguang Soilless 30.22a 10.7 7.12a 9.5 54.69a 24.8 108.2b −9.6 Soil 27.31b 6.5a 43.82b 119.7a Huangzhenzhu Soilless 26.12a 14.0 7.09a 12.5 45.69a 13.6 108.2b −9.6 Soil 22.91b 6.3a 40.21b 119.7a Cultivar Cultivation Number of fruits
clusterFruit yield
(kg/667 m2)Fruit weight
(g)Number of fruits
per clusterFruit cracking rate
(%)Experiment LSM Increase% LSM Increase% LSM Increase% LSM Increase% LSM Increase% Fenyuan Soilless 8.2a 20.6 87,003.9a 10.8 16.1a 0.6 21.7a 26.9 0.23b −92.6 2018 two Soil 6.8b 78,541.3b 16.0a 17.1b 3.1a Xiariyangguang Soilless 8.3a 38.3 115,446.4a 50.9 16.8a 52.7 30.2a −2.3 2.1b −72.7 Soil 6.0b 76,528.4b 11.0b 30.9b 7.7a Hongyu Soilless 8.1a 22.7 56,571.1a 29.2 17.9a 5.3 13.5a 29.8 0 0.0 Soil 6.6b 43,787.1b 17.0a 10.4b 0 Huangzhenzhu Soilless 8.1a 30.6 55,538.5a 2.6 13.9a 6.9 18.1a 1.1 0.7b −93.6 Soil 6.2b 54,139.5a 13.0a 17.9a 10.9a Cultivar Cultivation Vitamin C
(mg/100g)Soluble solids
(%)Total soluble sugar
content (mg/g)Fruit yield
(kg/667m2)Nitrate content
(mg/kg)Experiment LSM Increase% LSM Increase% LSM Increase% LSM Increase% LSM Increase% Jinpeng 11 Soilless 20.9a 21.5 6.5a 27.5 46.1a 29.9 100,294.5a 2.6 331.58b −57.8
2019Soil 17.2b 5.1b 35.5b 97,797.0a 785.24a Fengshouhuang Soilless 19.6a 39.0 6.0a 7.1 37.9a 6.5 90,274.5a 5.8 394.13b −21.8 Soil 14.1b 5.6b 35.6b 85,342.5b 503.69a * LSM = least squared mean.
** Increase% = percentage increasing for soilless cultivation with application of nutrient solution compared to soil-based cultivation with regular irrigation and fertilization as control = 100 × (soilless − soil)/soil, such as for 'Number fruit first era' in the 2017 experiment = 100 × (62.3−57.2)/57.2 = 8.9%Table 3.
Comparison of plant growth, fruit yield and fruit qualities between soilless and soil-based cultivations by each tomato cultivar, respectively.
-
Treatment Nutrient solution Components of each nutrient solution (mg/L)a pH EC
(mS/cm)Ca(N03)2·
4H2OKH2PO4 KNO3 MgSO4·
7H2OFe-
EDTAH3BO3 ZnSO4·
7H2OMnSO4·
4H2OCuSO4·
5H2O(NH4)2MoO4 T1 Formula-1b 850 150 430 510 20 3 1.9 1.9 0.07 0.1 5.5−6.8 1.5−2.5 Formula-2b 850 200 430 510 25 3 2 1.9 0.07 0.1 6.5−6.8 2.5−3.5 T2 Formula-1 860 155 440 520 25 4 2 2 0.08 0.12 5.5−6.8 1.5−2.5 Formula-2 860 210 440 520 28 4 2.1 2 0.08 0.12 6.5−6.8 2.5−3.5 T3 Formula-1 855 153 435 515 23 3.5 1.95 1.95 0.075 0.11 5.5−6.8 1.5−2.5 Formula-2 855 205 435 515 27 3.5 2.05 1.95 0.075 0.11 6.5−6.8 2.5−3.5 T 4 Formula-1 858 154 438 518 24 3.8 1.98 1.98 0.078 0.118 5.5−6.8 1.5−2.5 Formula-2 858 208 438 518 27 3.8 2.08 1.98 0.078 0.118 6.5−6.8 2.5−3.5 T5 Formula-1 852 151 432 512 21 3.1 1.92 1.92 0.073 0.105 5.5−6.8 1.5−2.5 Formula-2 852 202 432 512 26 3.2 2.02 1.92 0.072 0.105 6.5−6.8 2.5−3.5 T6 Formula-1 The soil-based cultivation was applied with regular irrigation and fertilization as control; balanced water-soluble fertilizer (N:P:K = 20:20:20) was used in the early fruit setting period, and high-potassium water-soluble fertilizer (N:P:K = 15:5:30) was used in the full fruit setting period. Formula-2 a H2O was dded to make 1000 ml for each solution of either Formula-1 or Formula-2 from T1 to T5.
b Formula-1 was supplied in seedling and budding stages and Formula-2 in early fruiting and ripening stages.Table 4.
Five treatments with different nutrient solutions for soilless cultivation and one control of soil-based cultivation.
Figures
(1)
Tables
(4)