-
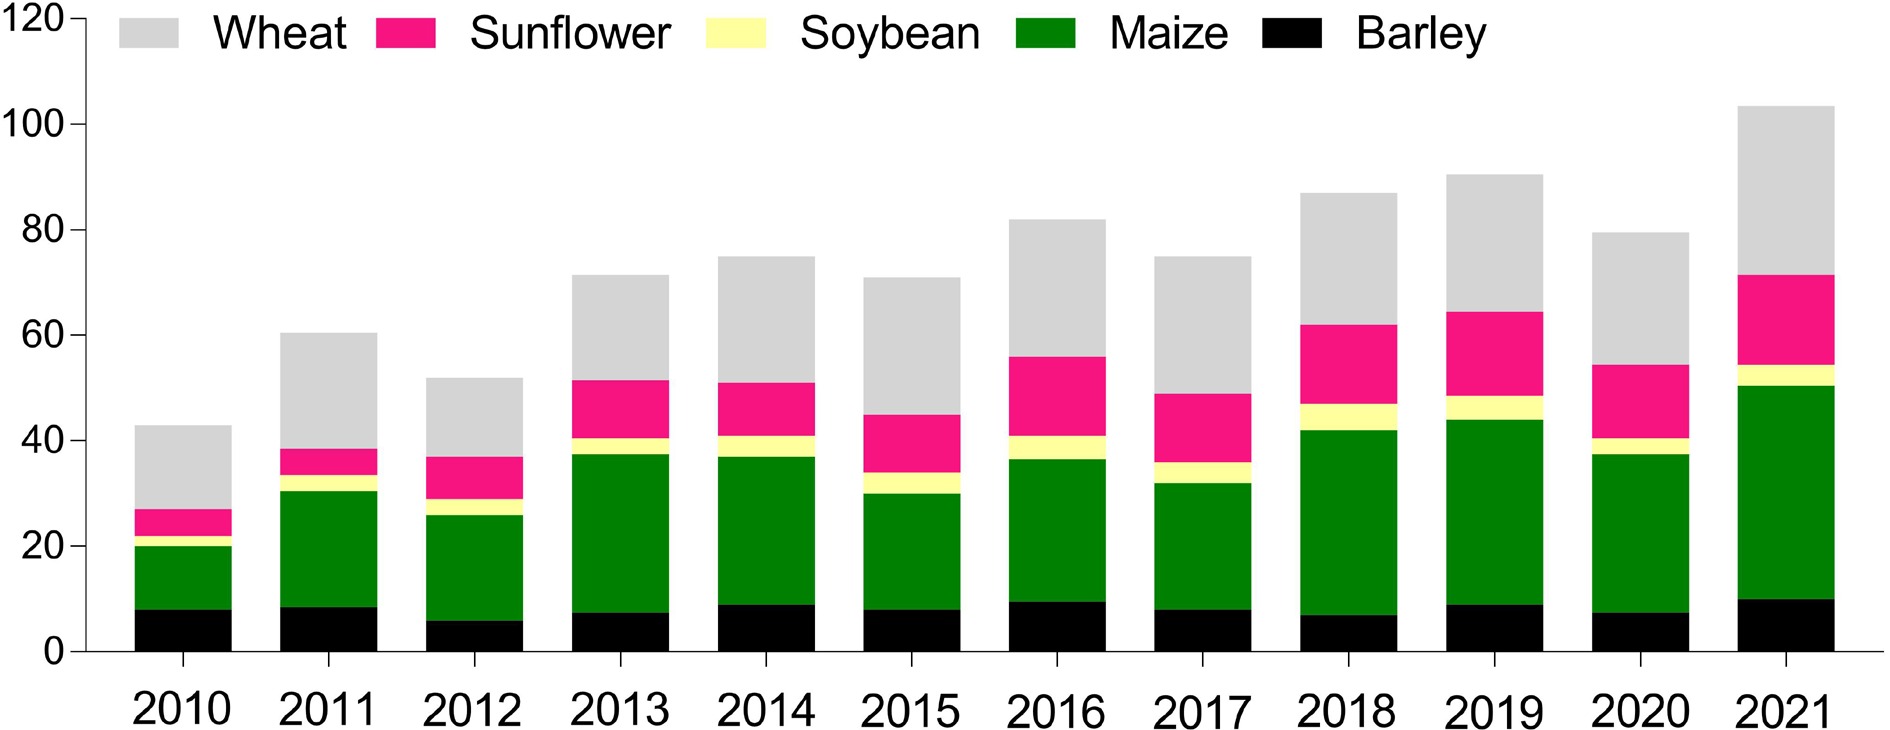
Figure 1.
Major crop production in Ukraine.
-
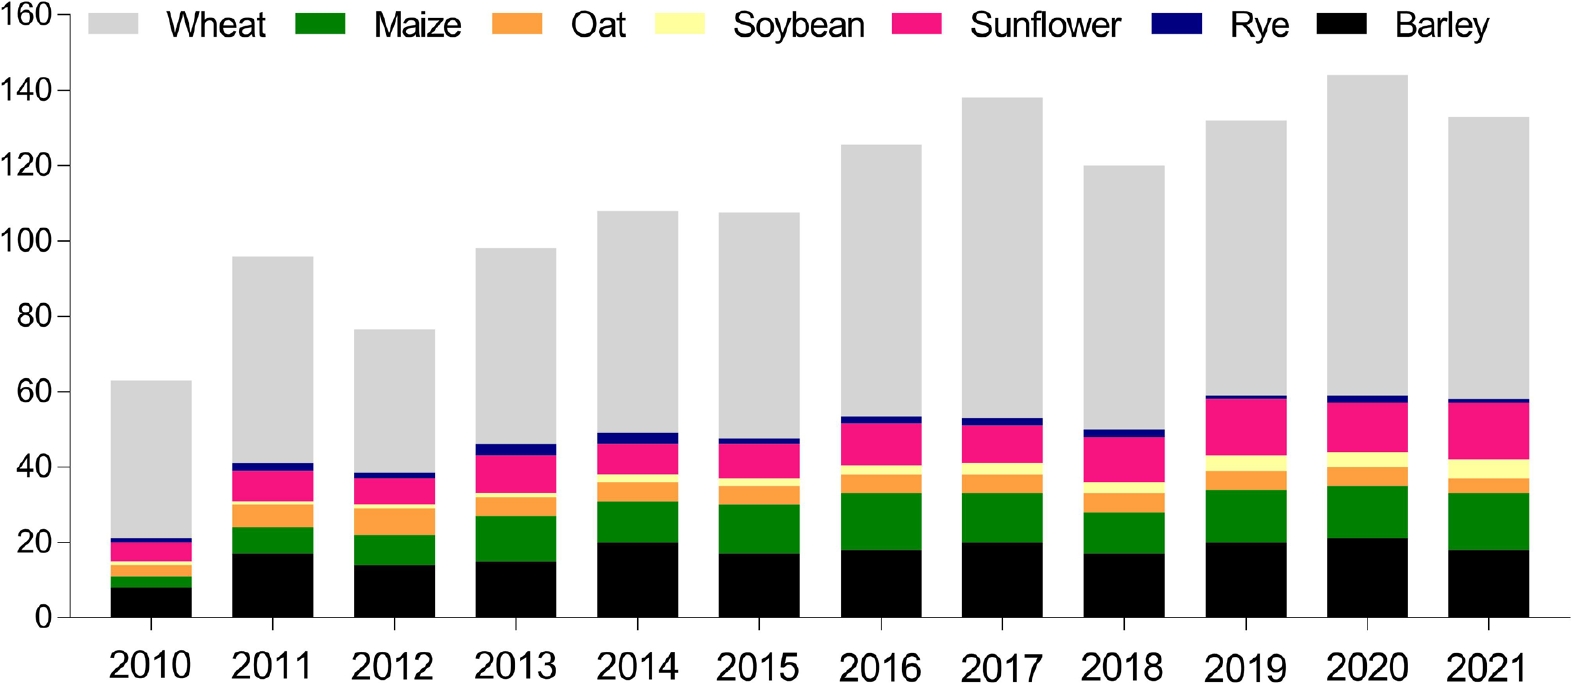
Figure 2.
Major crop production in Russia.
-
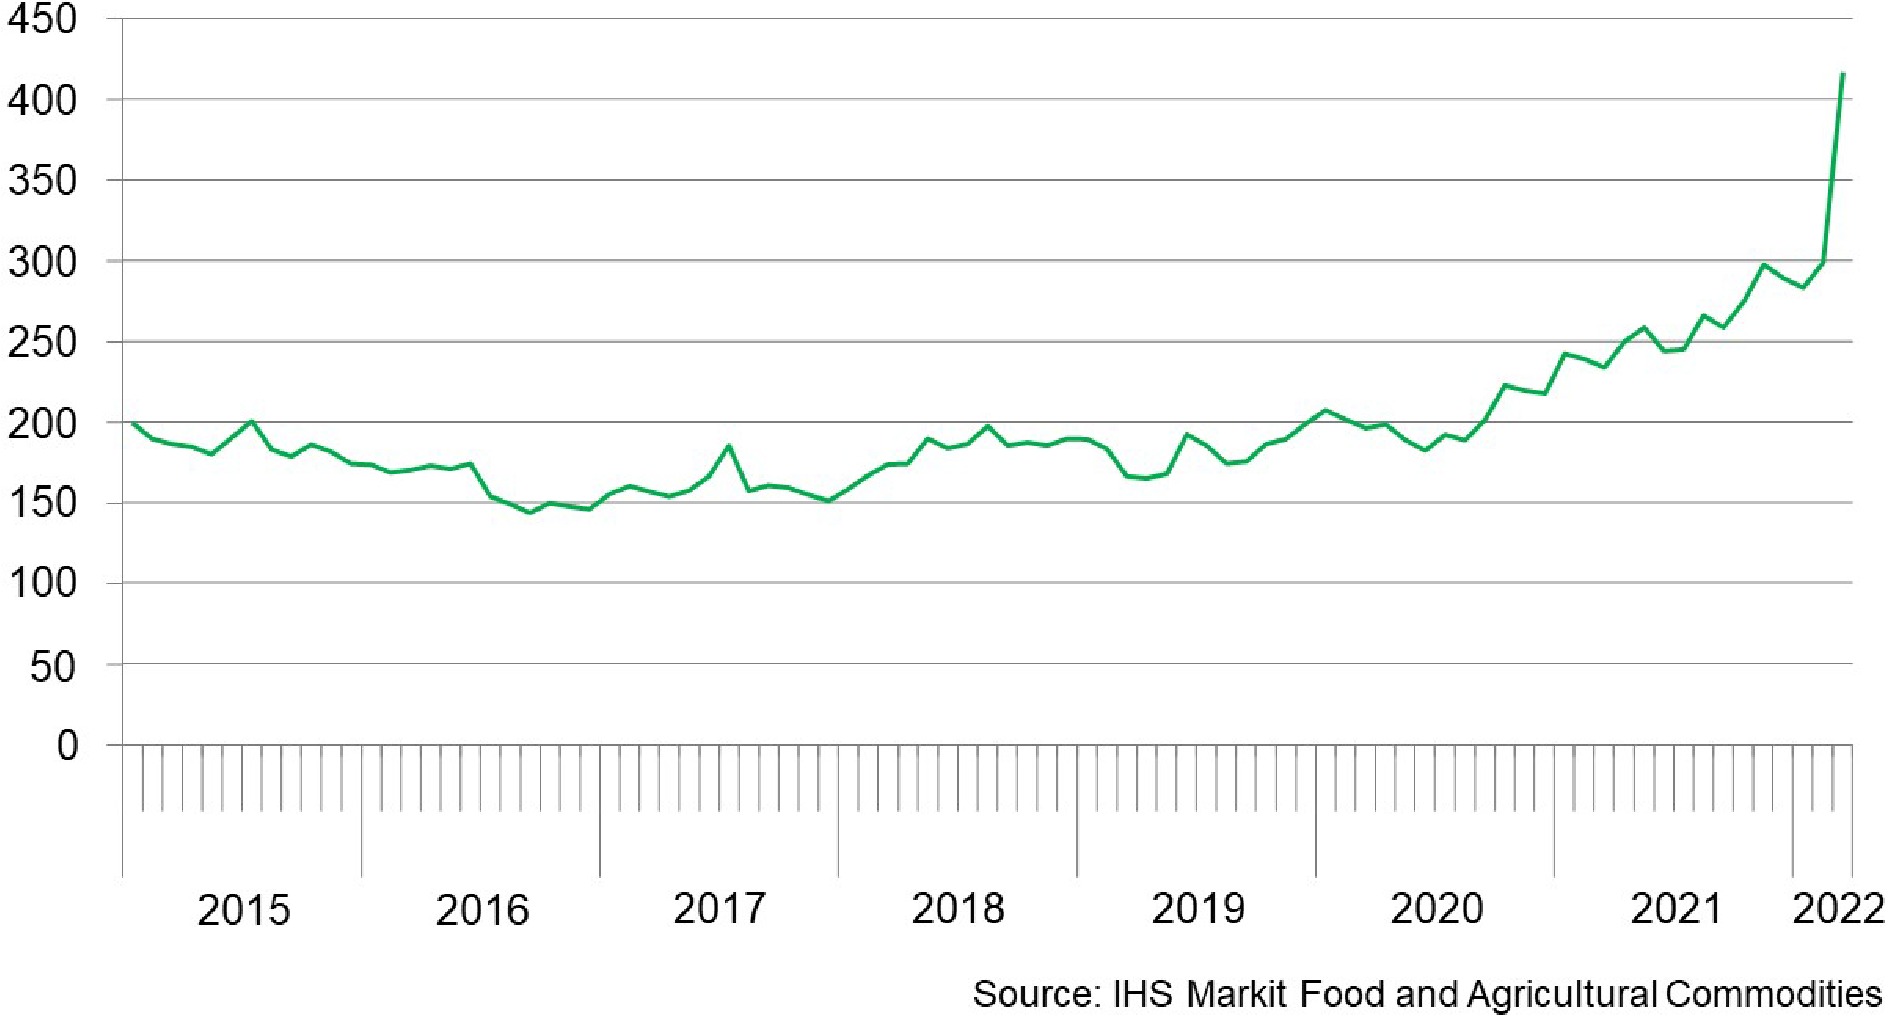
Figure 3.
Wheat-CBOT Chicago SRW Wheat Futures (USD/Ton).
-
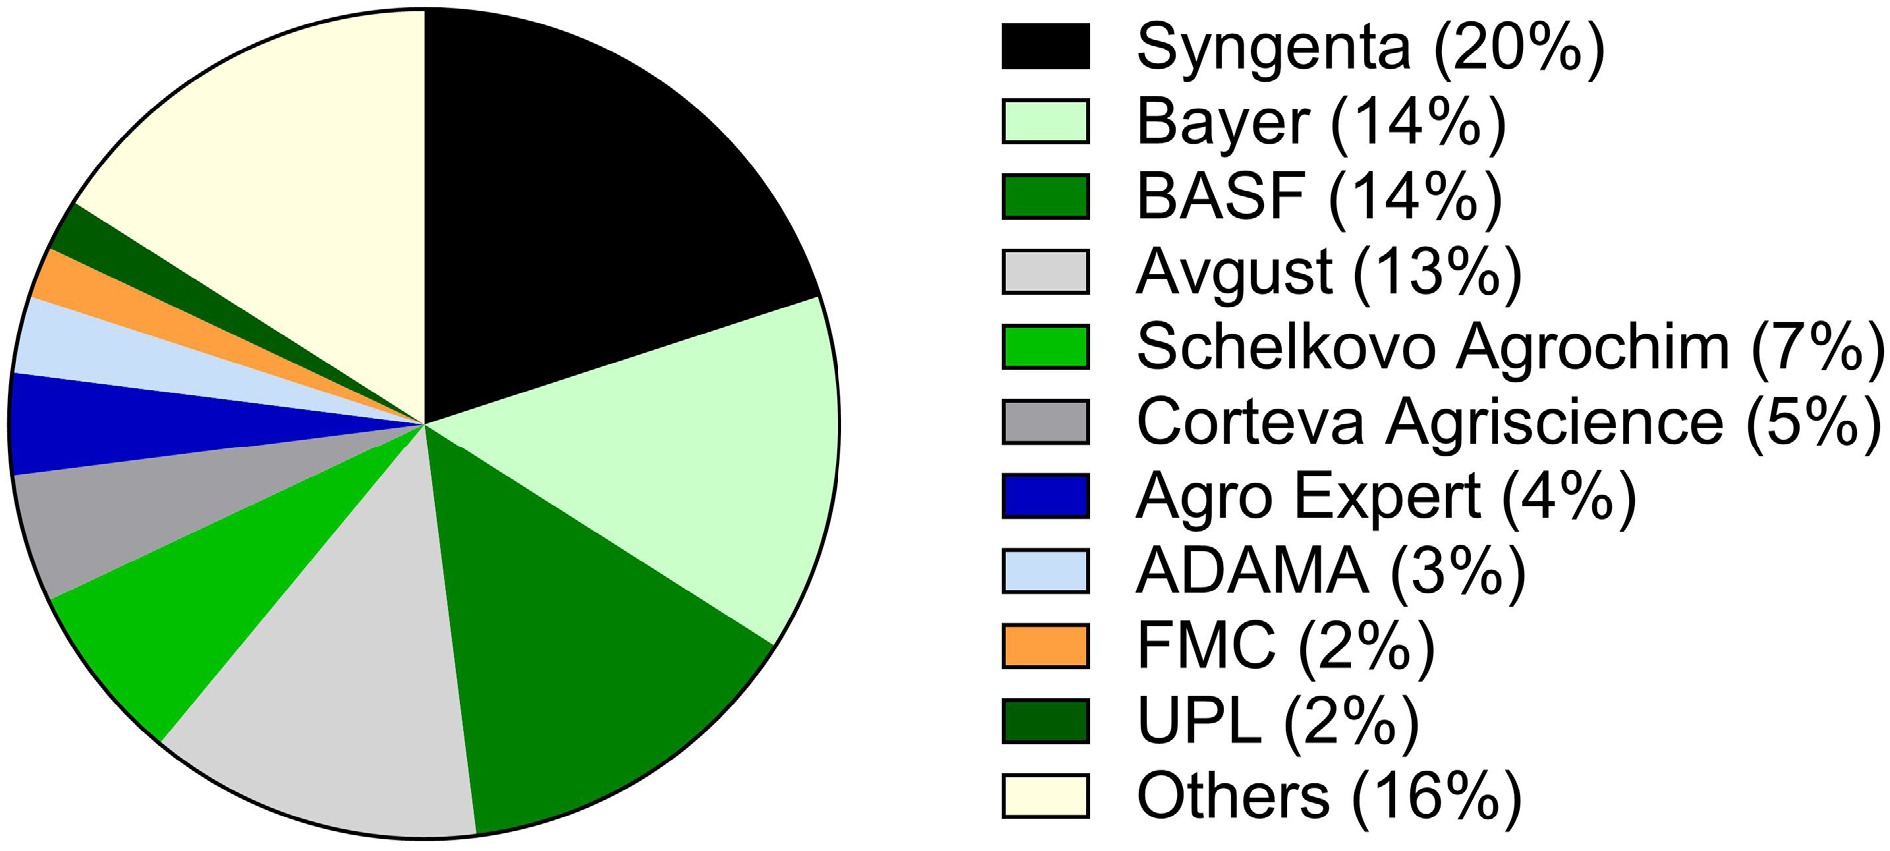
Figure 4.
Leading agrochemical players in Ukraine and Russia. Note: Splits are representative shares based on market research insights, not to be taken as exact values. Shares represent combined Ukraine and Russia market. Source: IHS Markit.
https://ihsmarkit.com/ -
Rank Ukraine Russia Destination Value of trade ( $\$ $ 

Destination Value of trade ( $\$ $ 

1 Egypt 858 Türkiye 1,802 2 Indonesia 727 Egypt 1,548 3 Türkiye 446 Azerbaijan 292 4 Pakistan 354 Nigeria 254 5 Morocco 232 Kazakhstan 215 6 Bangladesh 217 Sudan 203 7 Yemen 206 Bangladesh 188 8 Saudi Arabia 186 Latvia 176 9 Tunisia 163 Saudi Arabia 172 10 Ethiopia 161 Yemen 153 HS Code 1001
Source: IHS Markit Global Trade Atlas (https://ihsmarkit.com/products/maritime-global-trade-atlas.html )Table 1.
Major export destinations for Ukrainian and Russian wheat 2021.
Figures
(4)
Tables
(1)