-
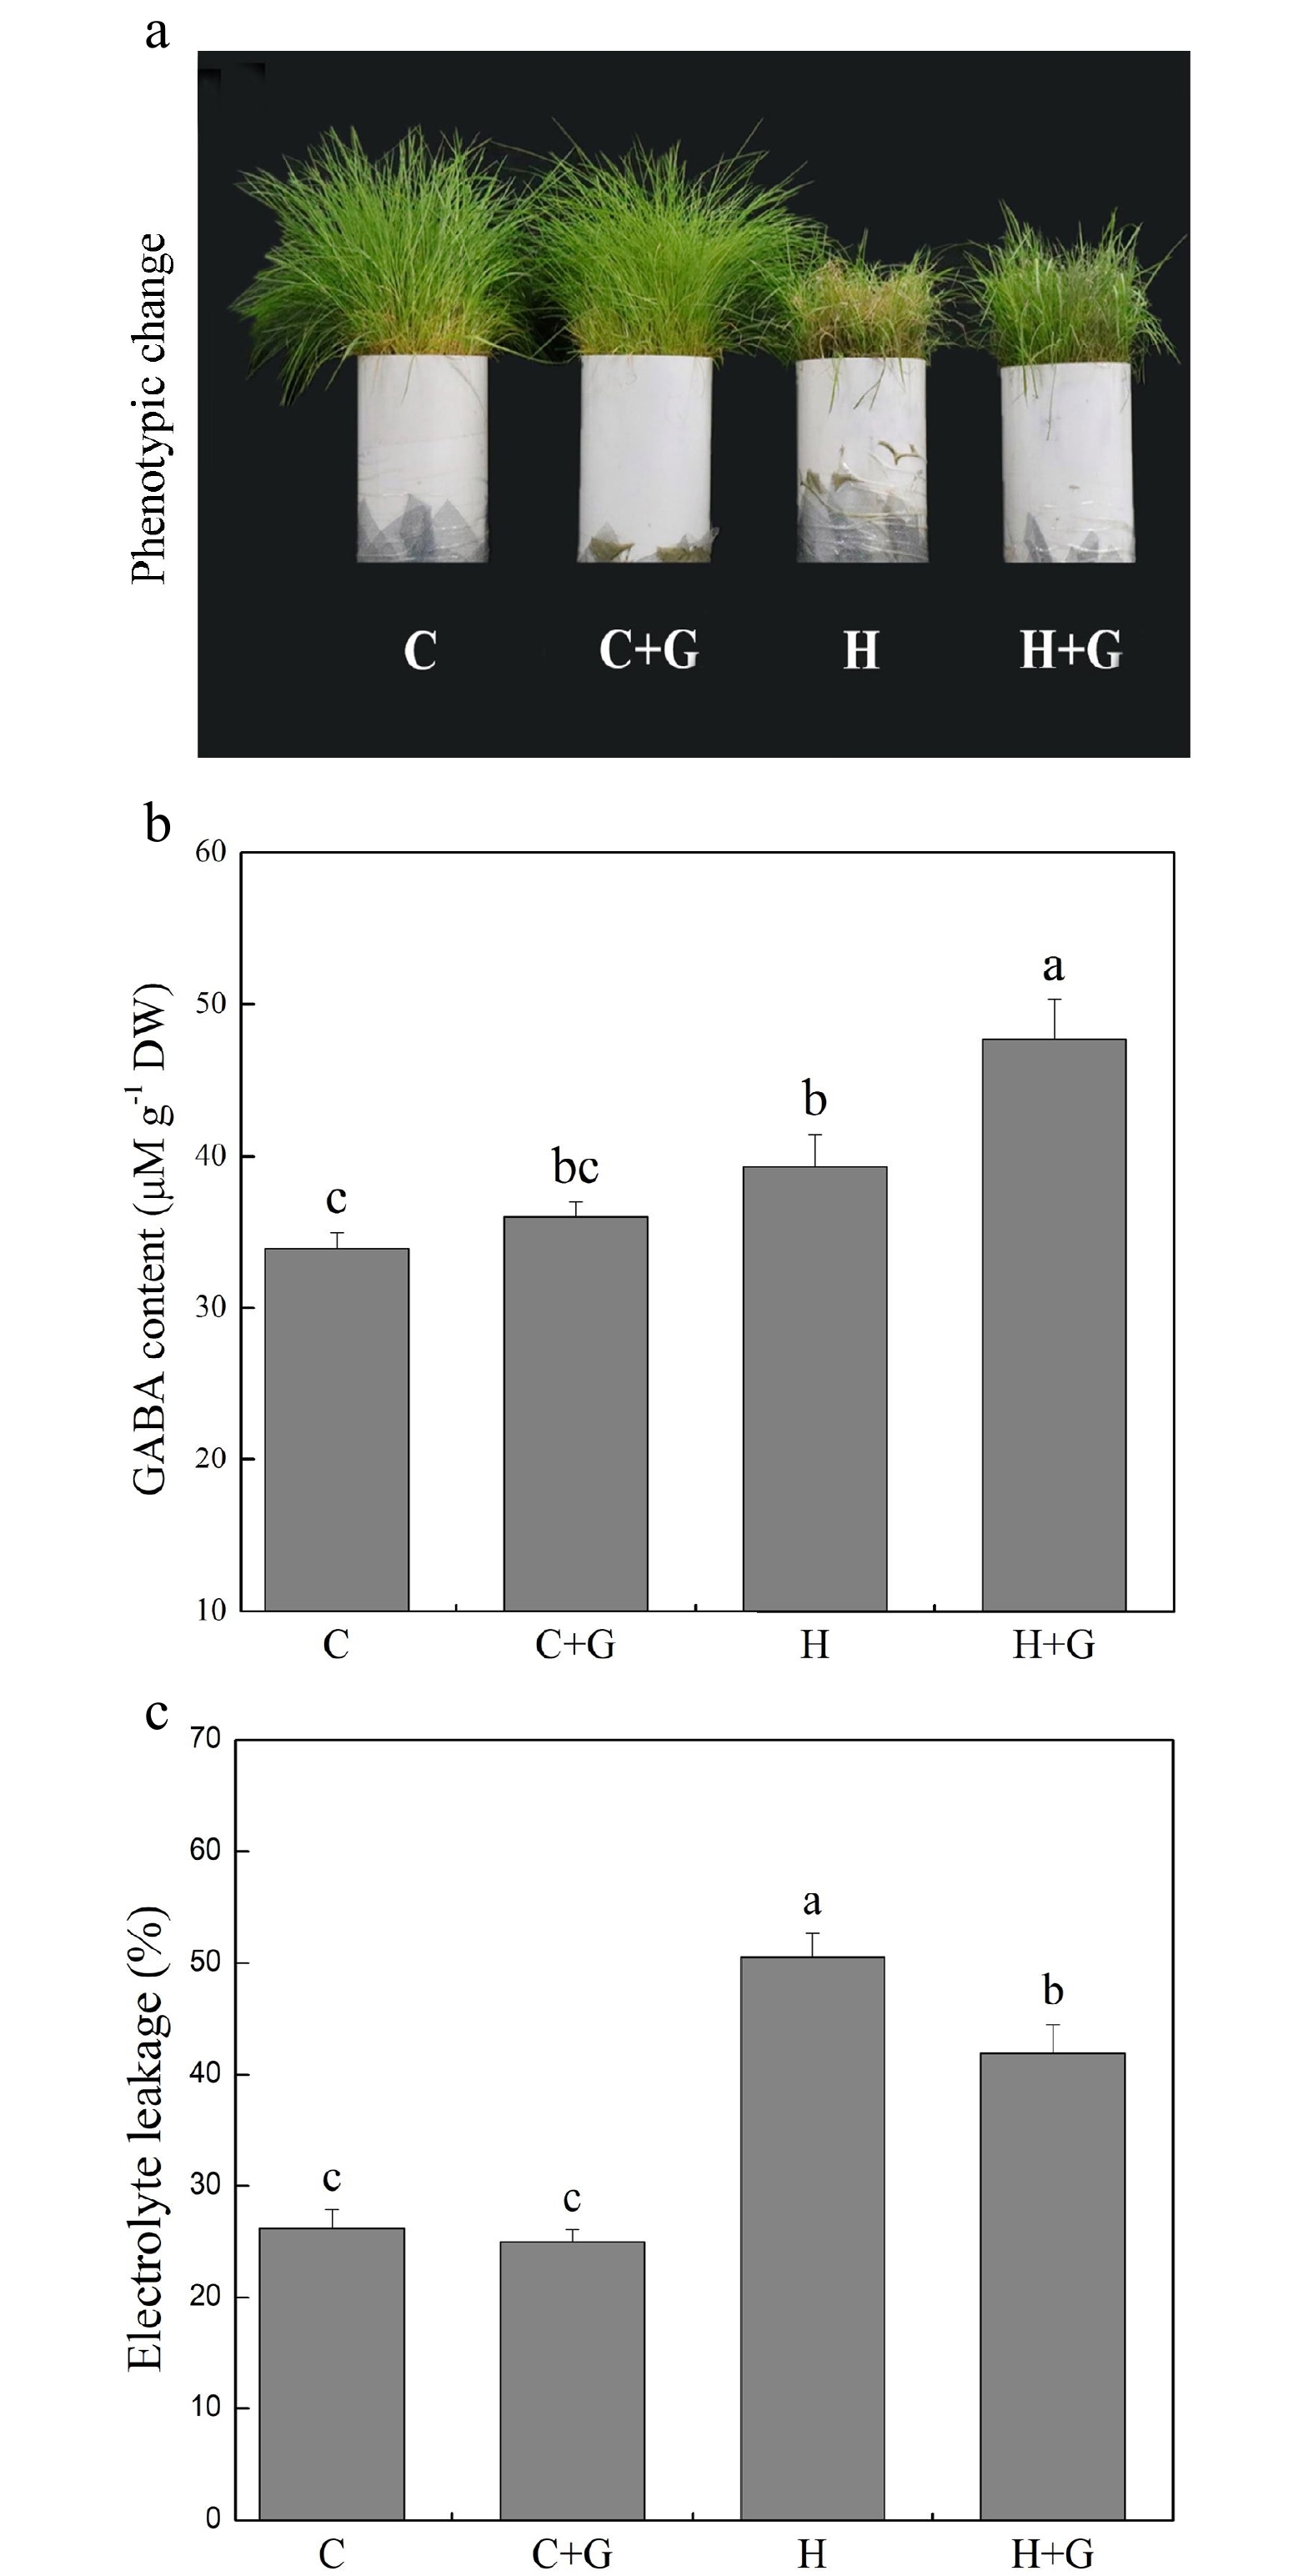
Figure 1.
Effects of γ-aminobutyric acid (GABA) on (a) phenotypic change, (b) endogenous GABA content, and (c) electrolyte leakage (EL) in non-stress control plants and heat-stressed plants at 30 d of treatment in creeping bentgrass. Vertical bars represent standard errors of the mean (n = 4). Columns marked with different letters indicate significant differences between treatments (P < 0.05). C, control; C+G, control treated with 0.5 mM GABA; H, heat stress; H+G, heat-stressed plants treated with 0.5 mM GABA.
-
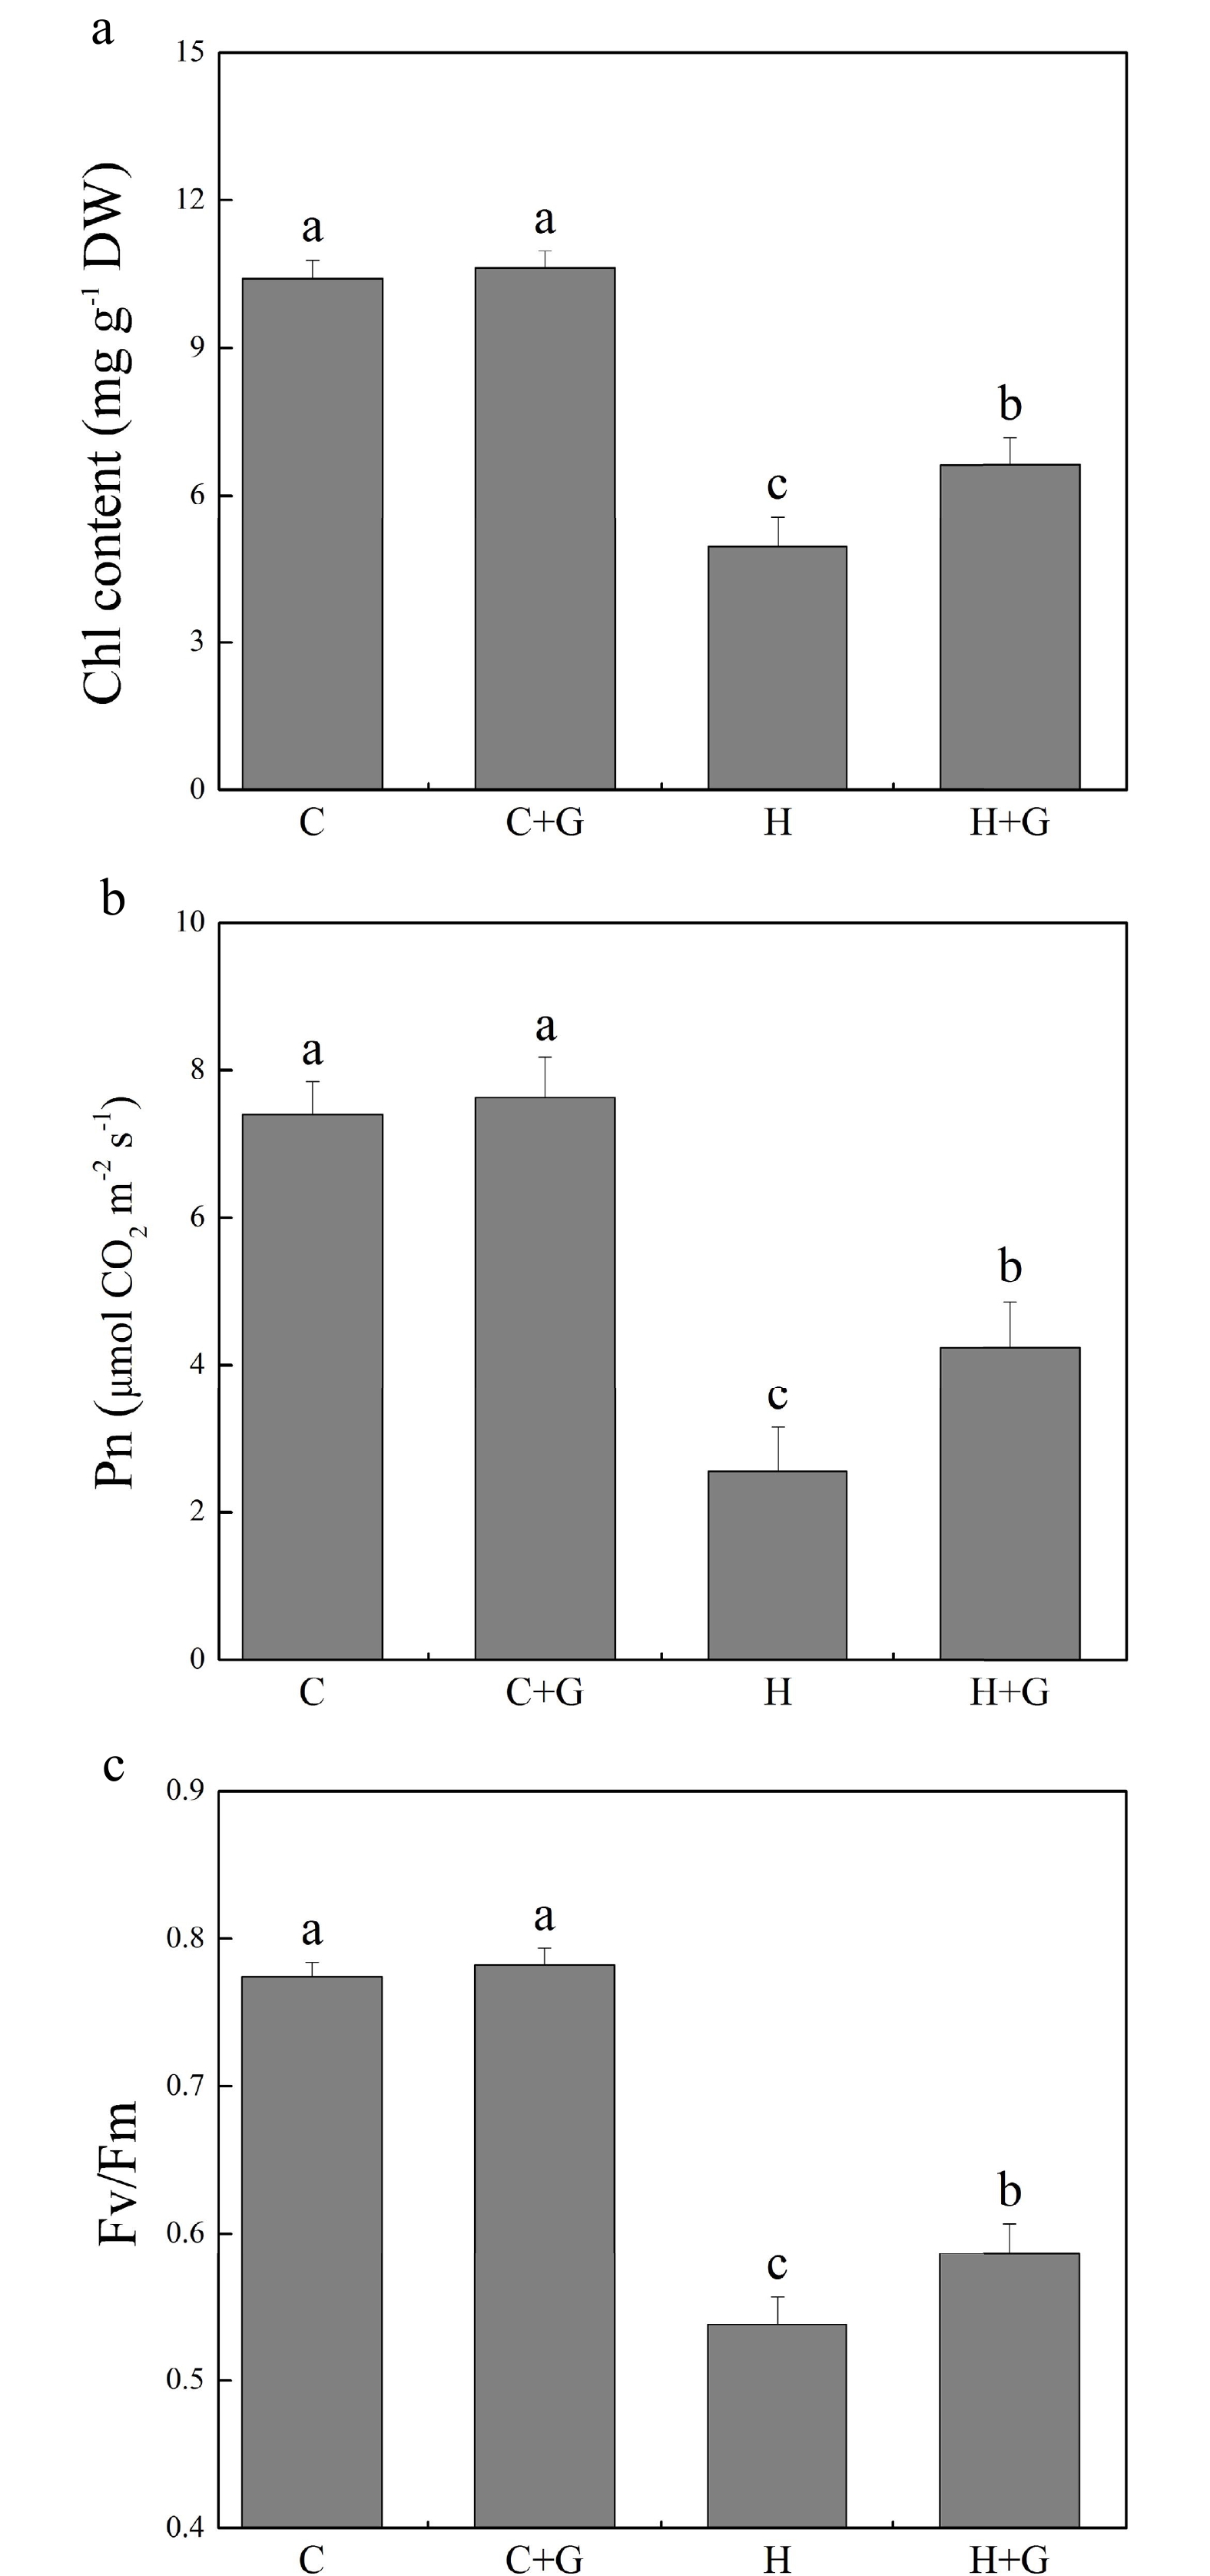
Figure 2.
Effects of γ-aminobutyric acid (GABA) on (a) chlorophyll (Chl) content, (b) net photosynthetic rate (Pn), and (c) photochemical efficiency (Fv/Fm) in non-stress control plants and heat-stressed plants at 30 d of treatment in creeping bentgrass. Vertical bars represent standard errors of the mean (n = 4). Columns marked with different letters indicate significant differences between treatments (P < 0.05). C, control; C+G, control treated with 0.5 mM GABA; H, heat stress; H+G, heat-stressed plants treated with 0.5 mM GABA.
-
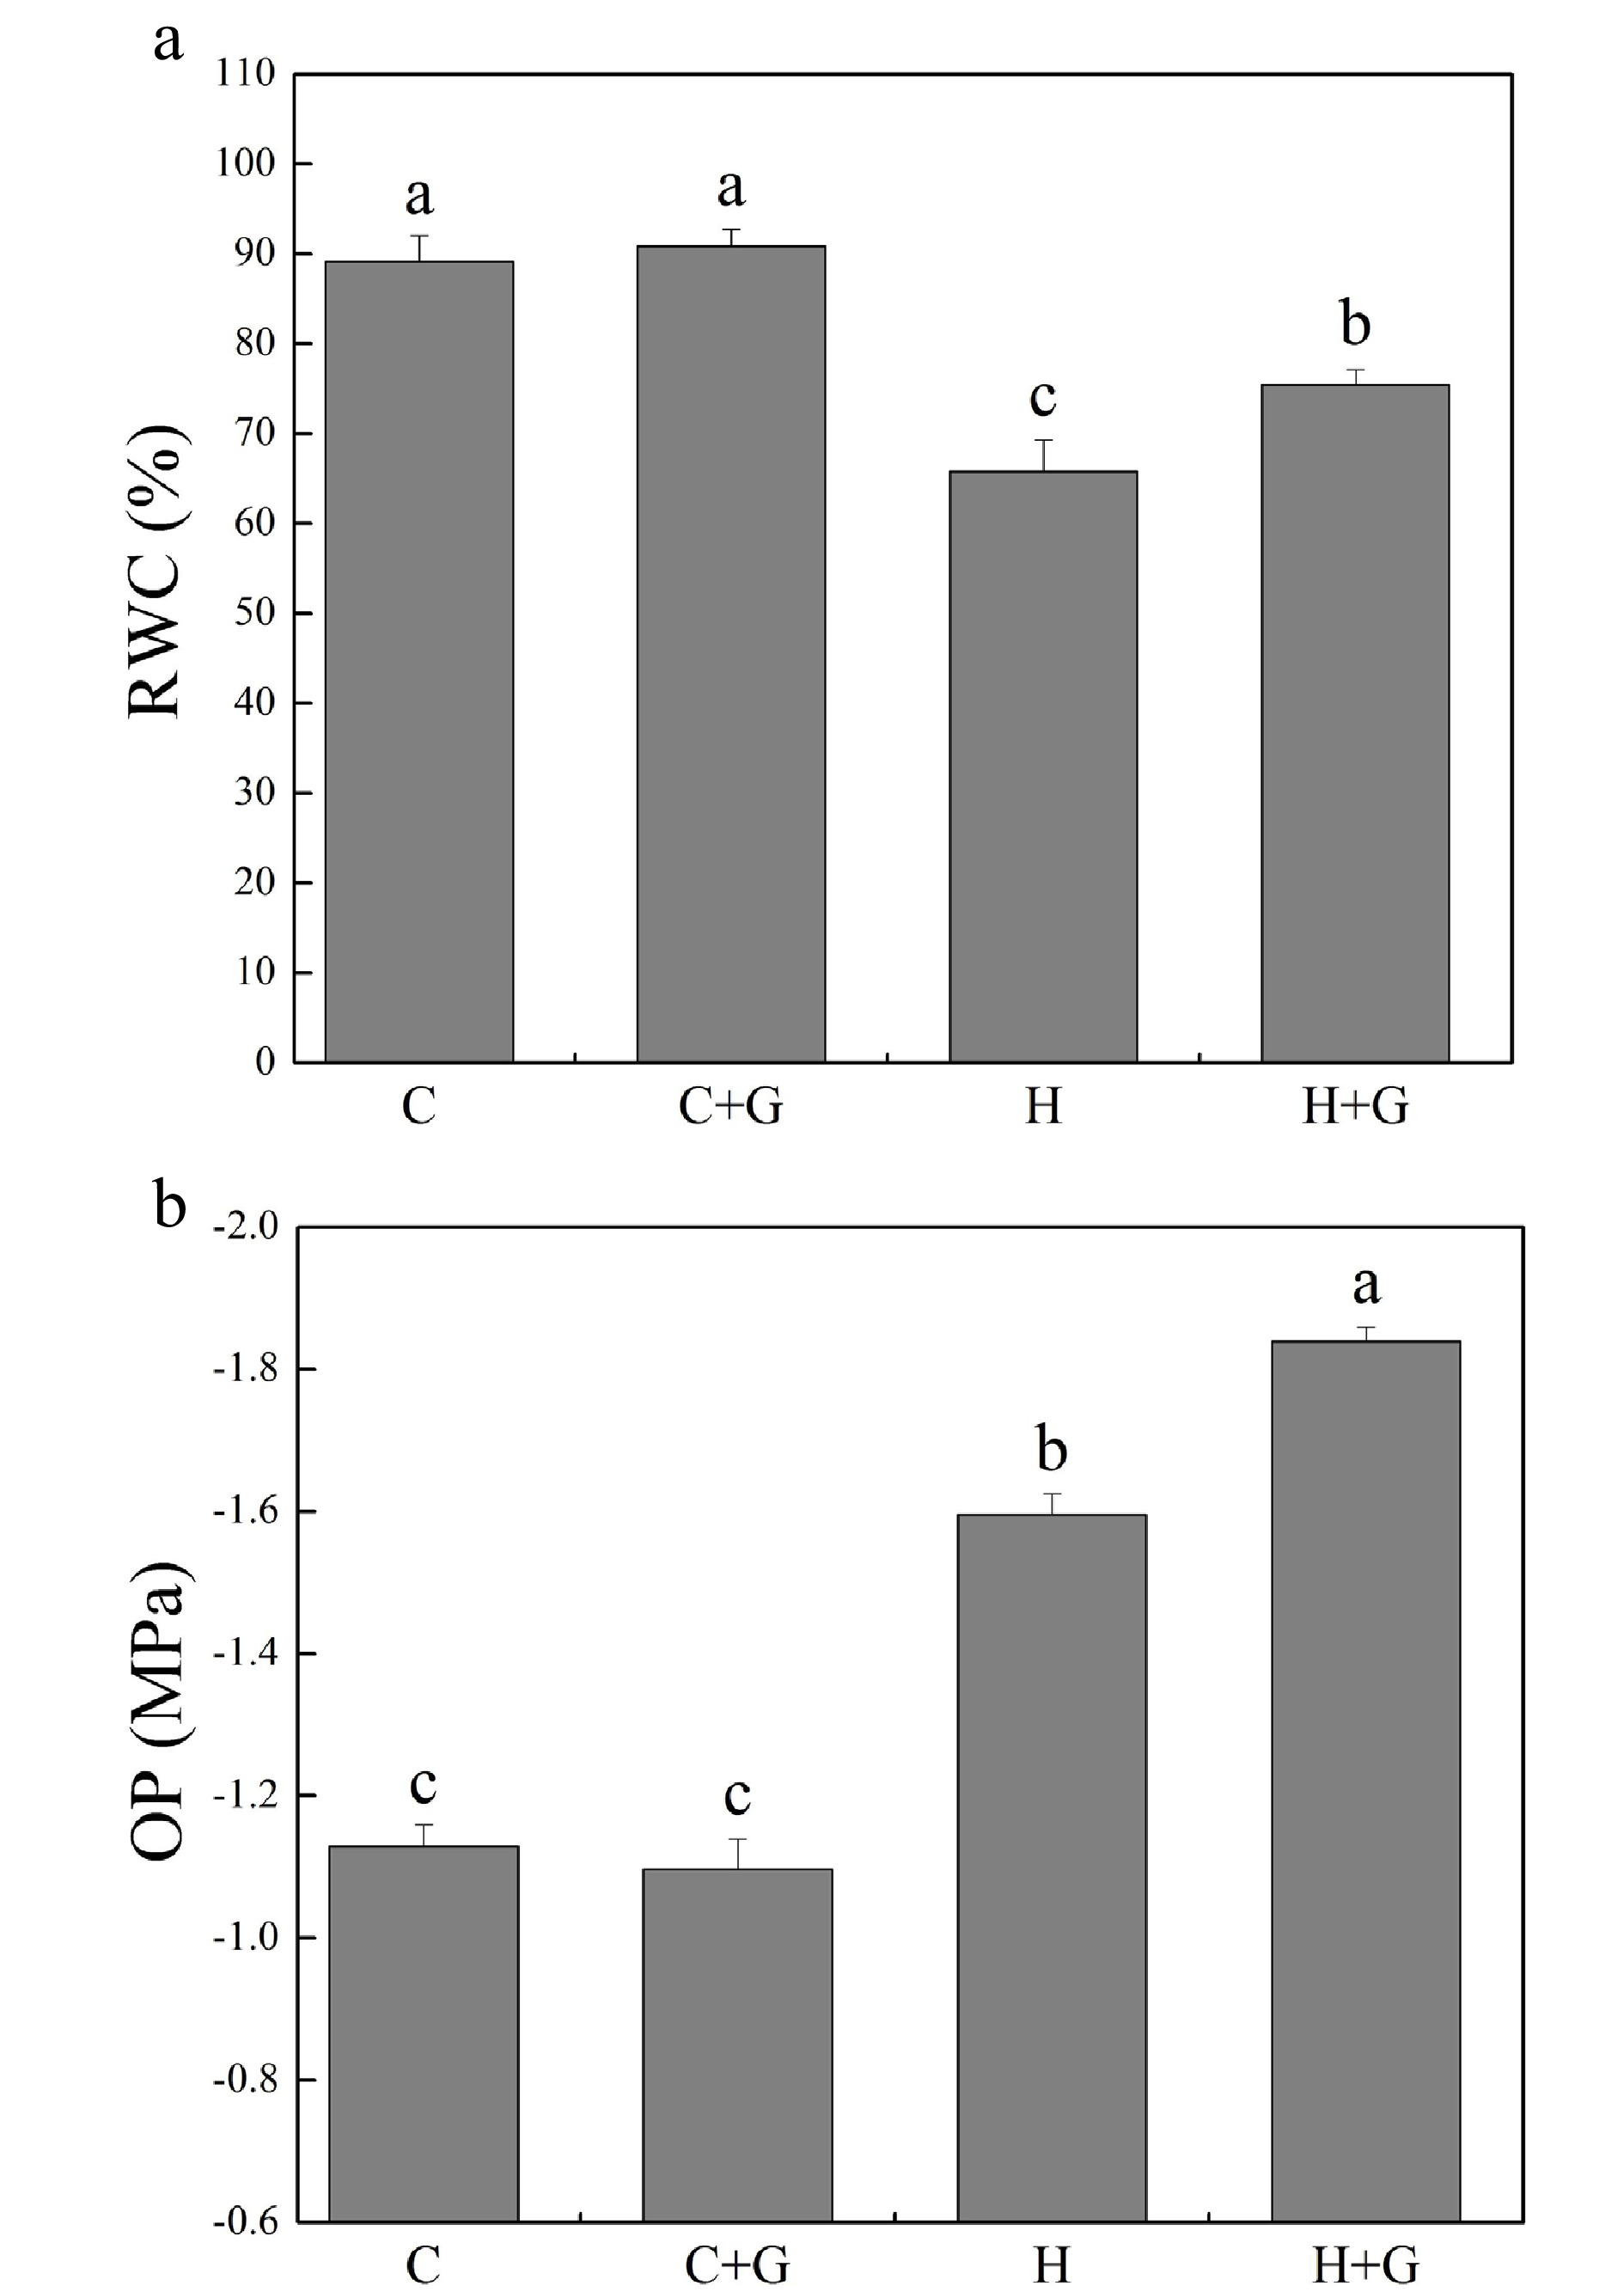
Figure 3.
Effects of γ-aminobutyric acid (GABA) on (a) relative water content (RWC) and (b) osmotic potential (OP) in non-stress control plants and heat-stressed plants at 30 d of treatment in creeping bentgrass. Vertical bars represent standard errors of the mean (n = 4). Columns marked with different letters indicate significant differences between treatments (P < 0.05). C, control; C+G, control treated with 0.5 mM GABA; H, heat stress; H+G, heat-stressed plants treated with 0.5 mM GABA.
-
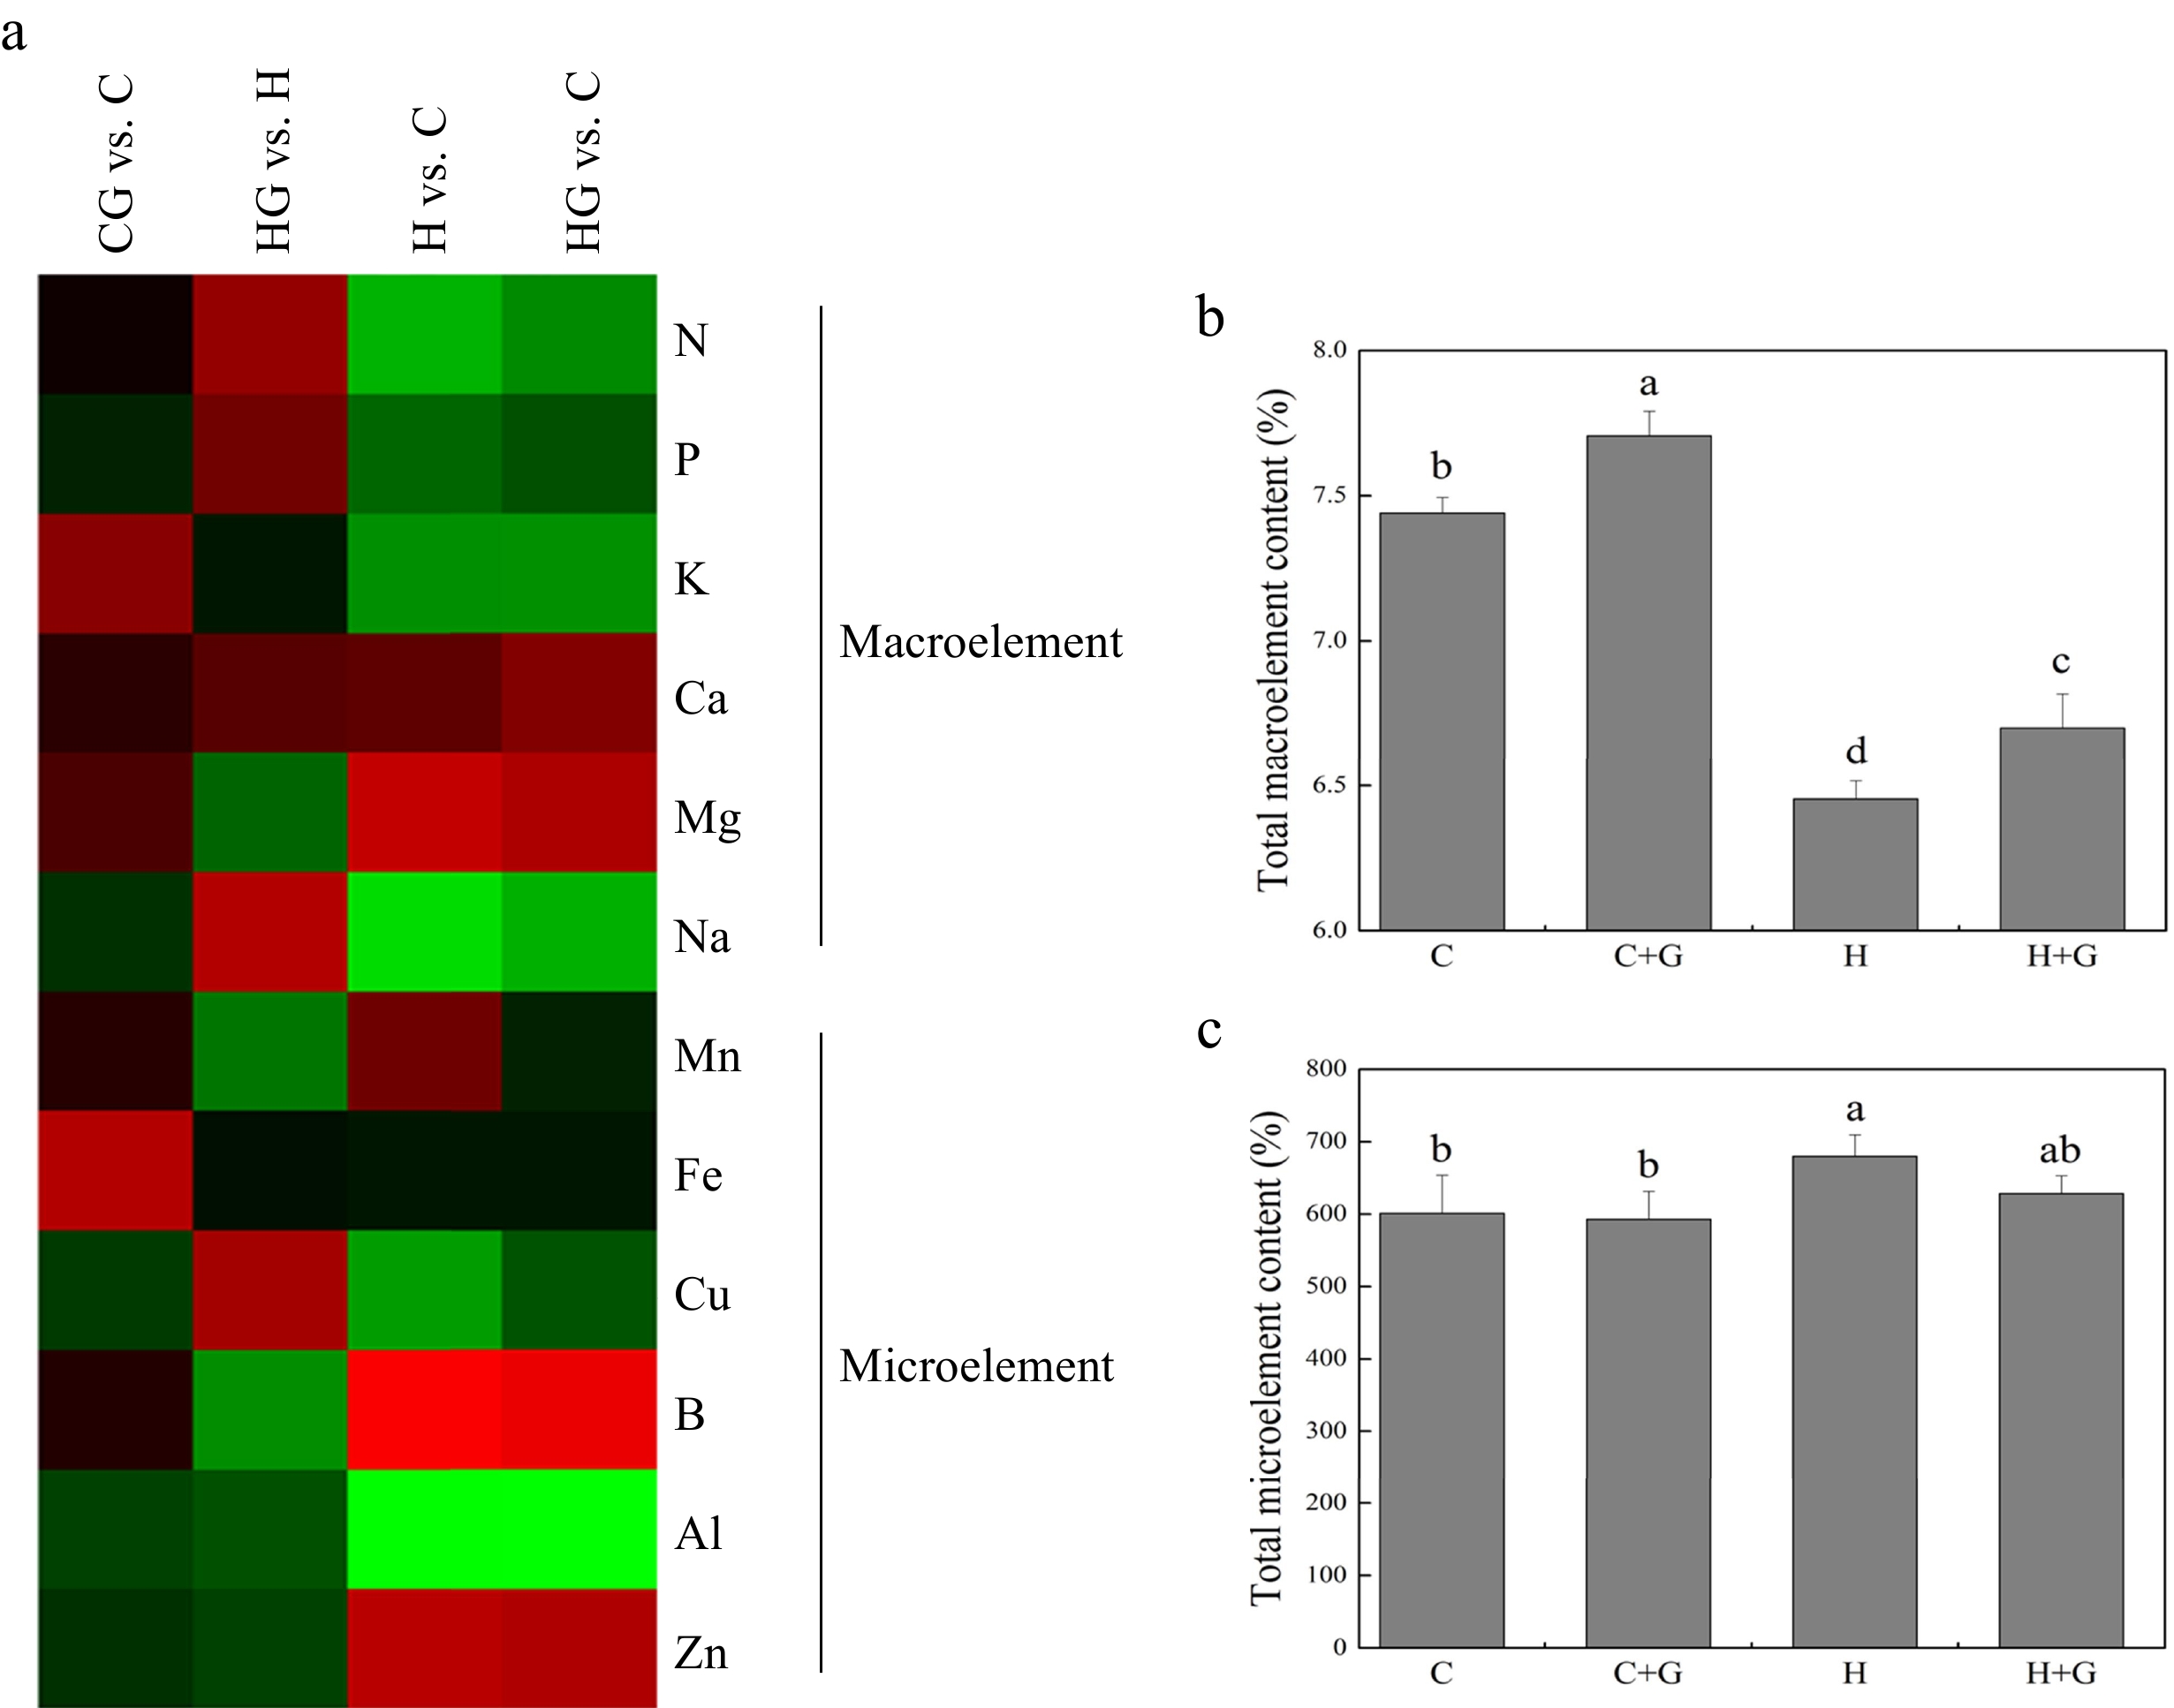
Figure 4.
(a) Heat map of changes in 12 nutrient element levels. (b) Effects of γ-aminobutyric acid (GABA) on the total macronutrient element content (%), and (c) total micronutrient element content in non-stress control plants and heat-stressed plants at 30 d of treatment in creeping bentgrass. Vertical bars represent standard errors of the mean (n = 4). Columns marked with different letters indicate significant differences between treatments (P < 0.05). C, control; C+G, control treated with 0.5 mM GABA; H, heat stress; H+G, heat-stressed plants treated with 0.5 mM GABA.
-
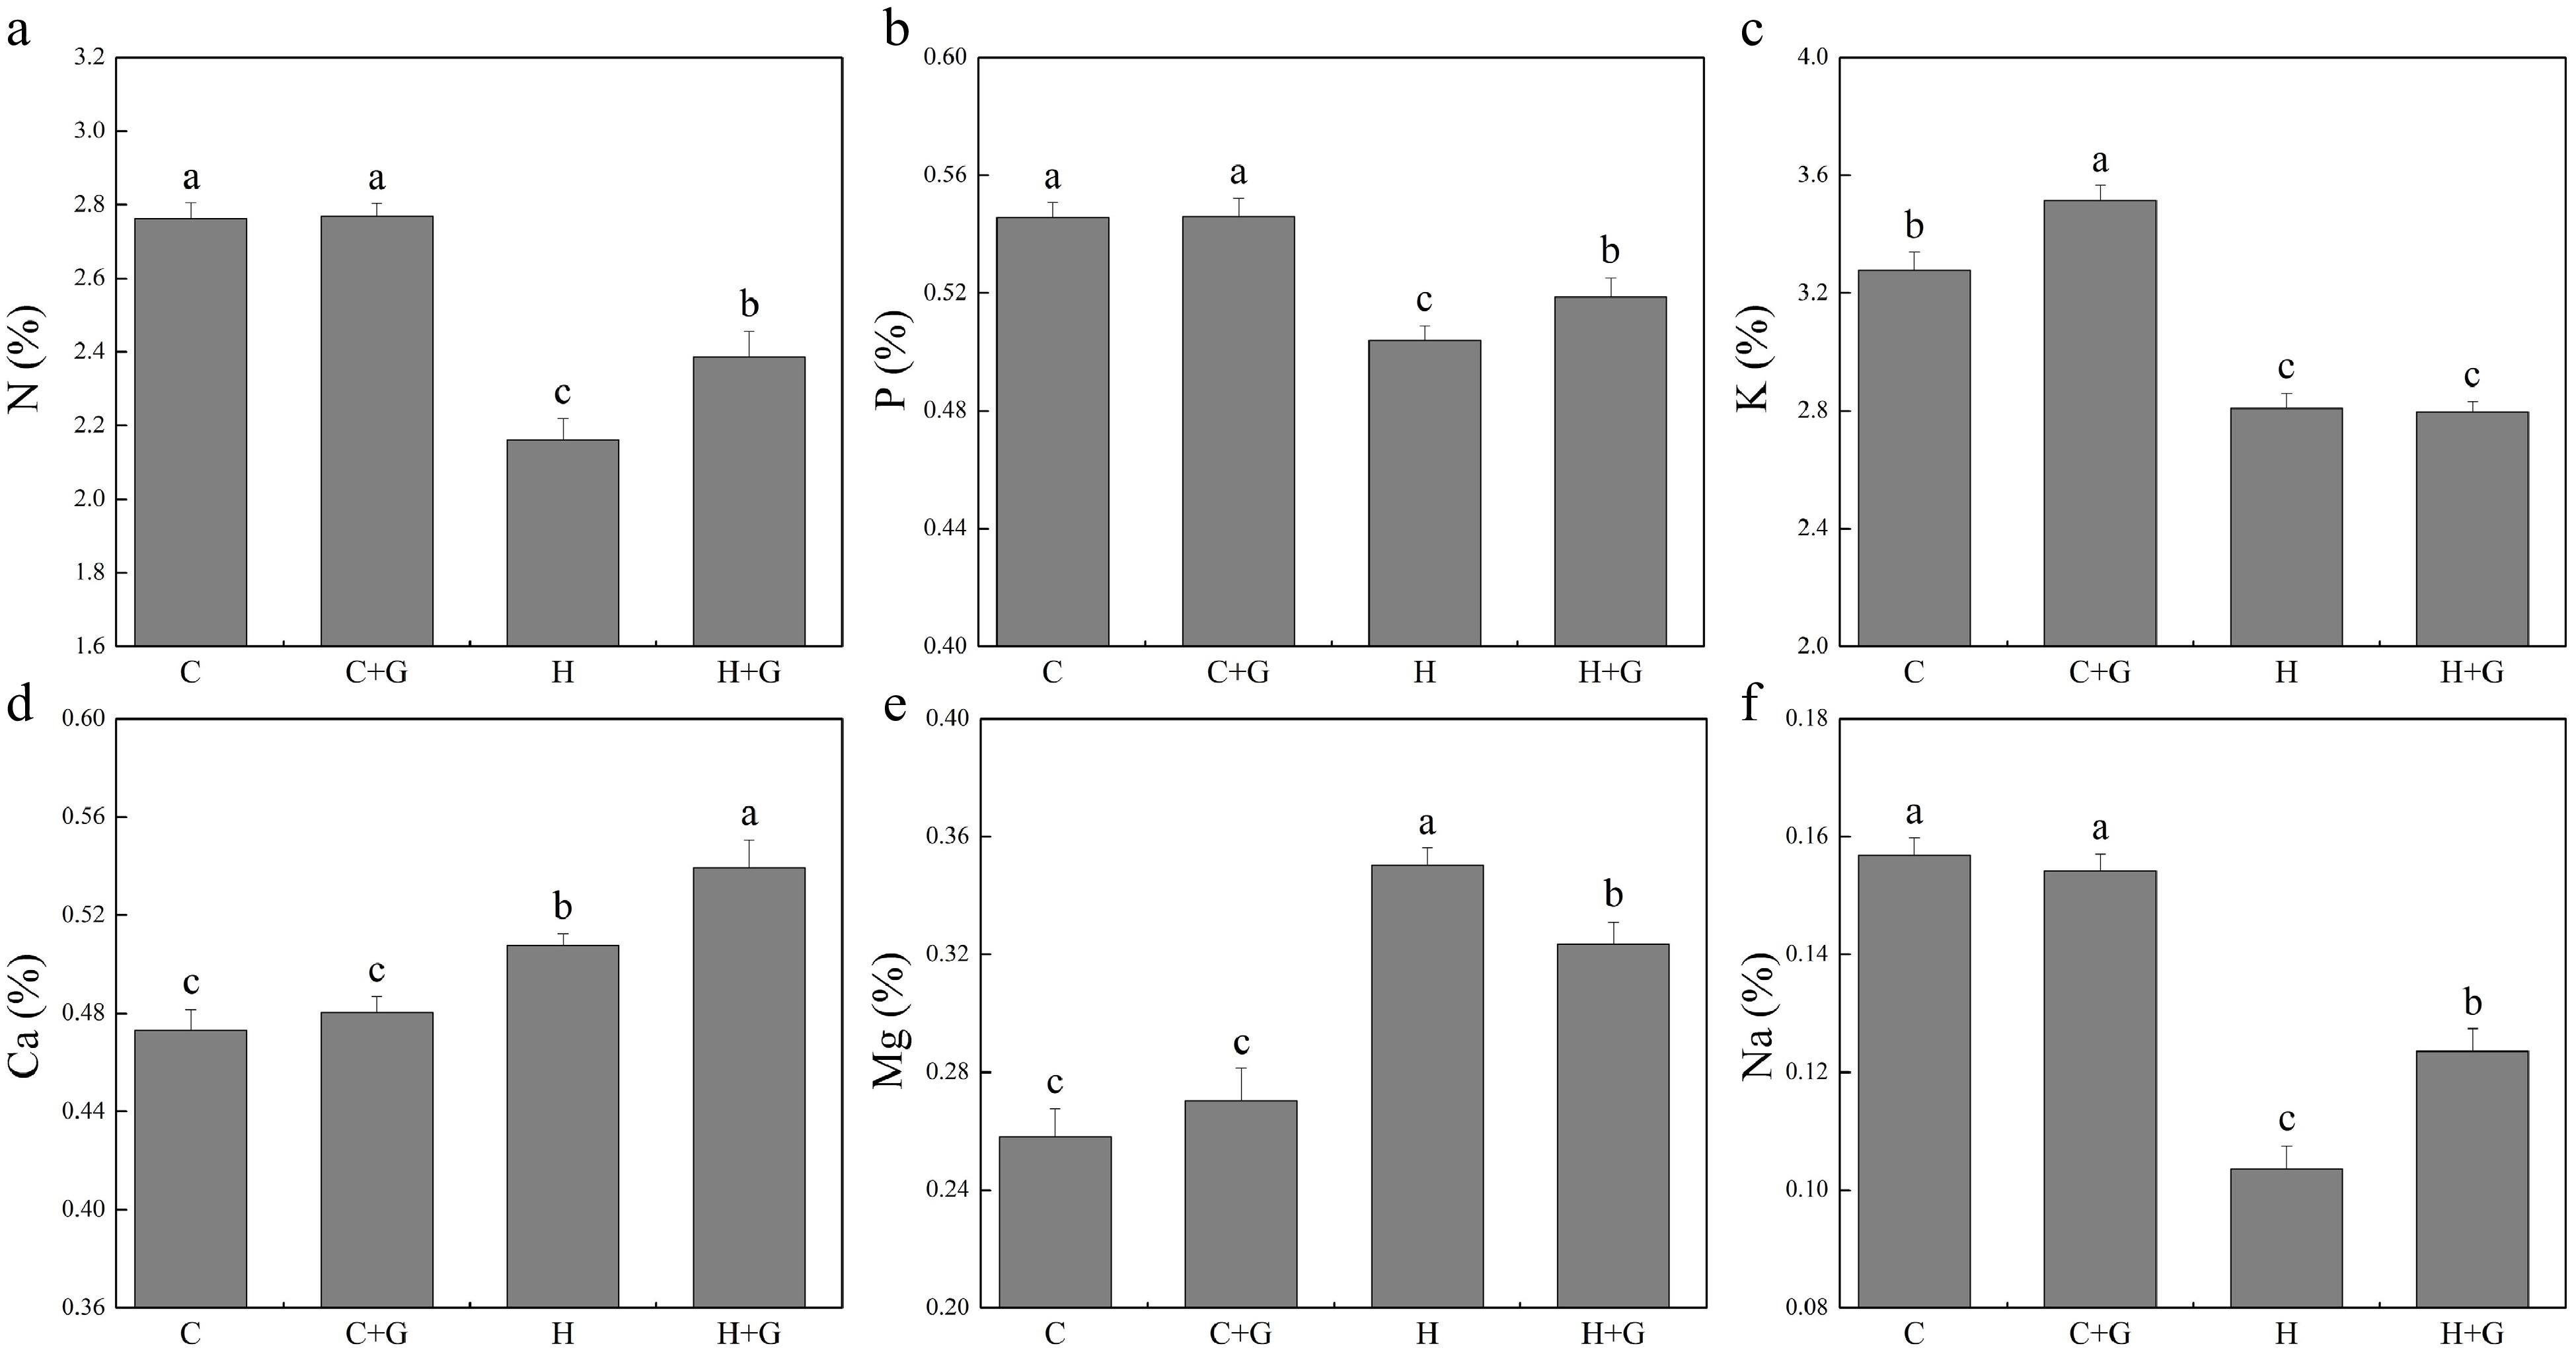
Figure 5.
Effects of γ-aminobutyric acid (GABA) on the content of (a) nitrogen (N), (b) phosphorus (P), (c) potassium (K), (d) calcium (Ca), (e) magnesium (Mg), and (f) sodium (Na) in non-stress control plants and heat-stressed plants at 30 d of treatment in creeping bentgrass. Vertical bars represent standard errors of the mean (n = 4). Columns marked with different letters indicate significant differences between treatments (P < 0.05). C, control; C+G, control treated with 0.5 mM GABA; H, heat stress; H+G, heat-stressed plants treated with 0.5 mM GABA.
-
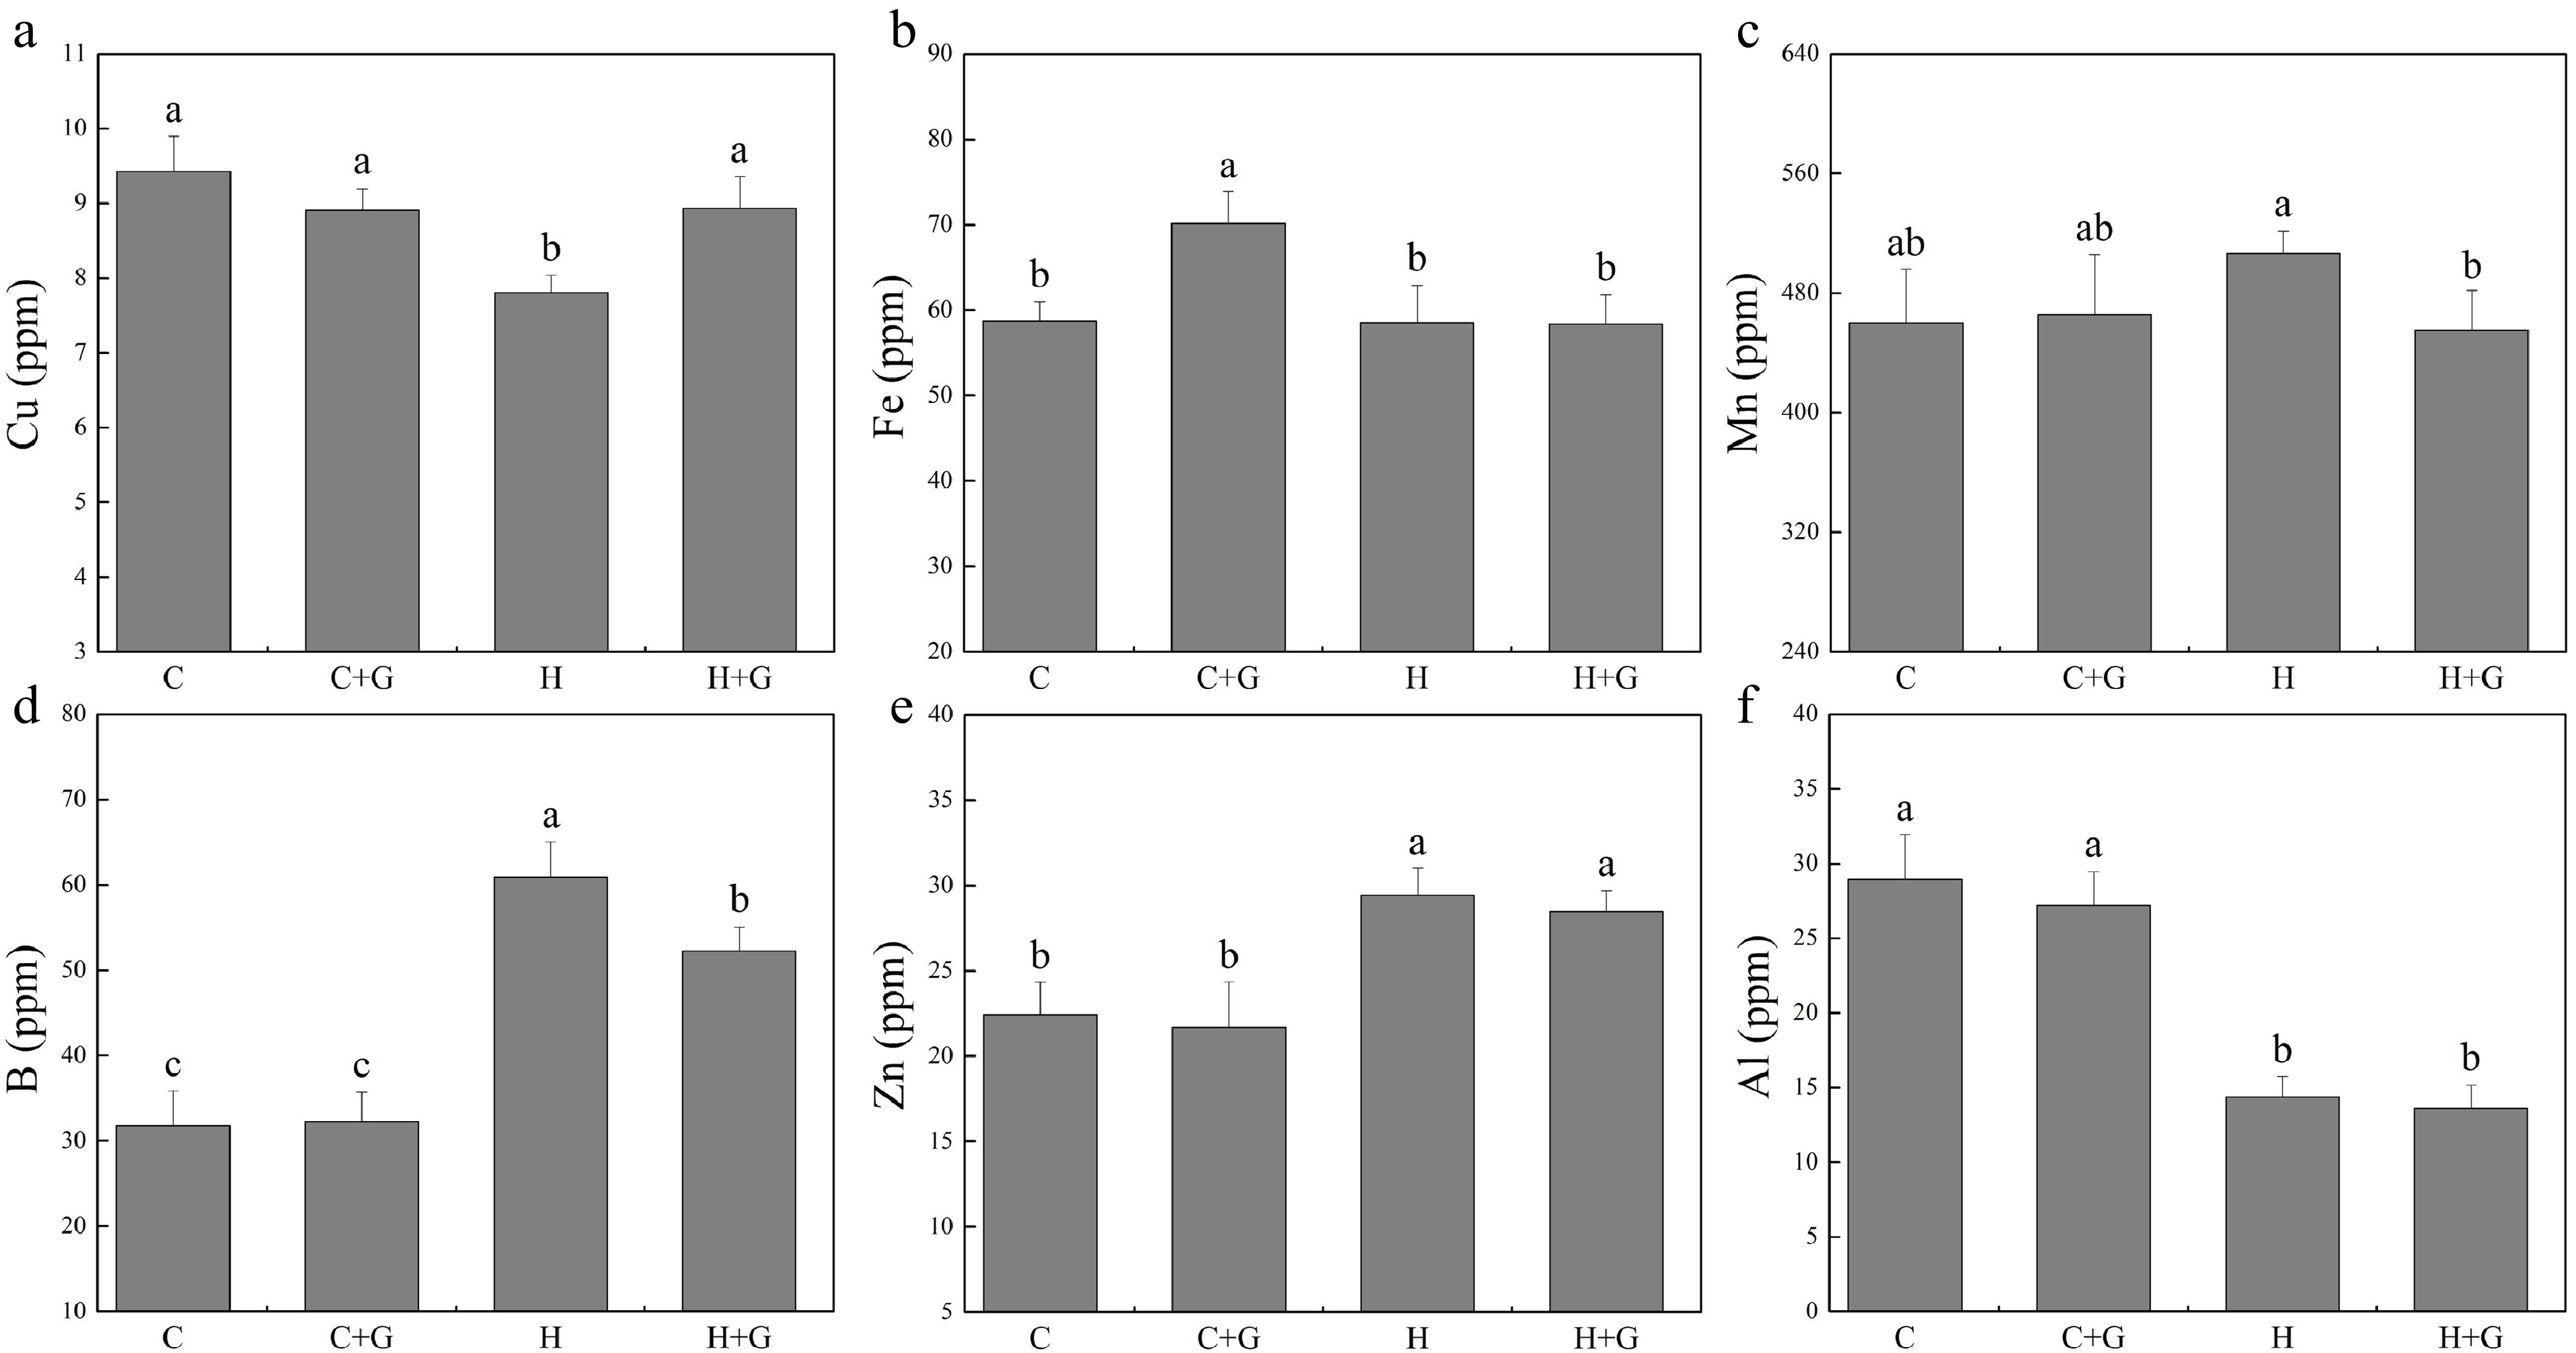
Figure 6.
Effects of γ-aminobutyric acid (GABA) on the content of (a) copper (Cu), (b) iron (Fe), (c) manganese (Mn), (d) boron (B), (e) zinc (Zn), and (f) aluminum (Al) in non-stress control plants and heat-stressed plants at 30 d of treatment in creeping bentgrass. Vertical bars represent standard errors of the mean (n = 4). Columns marked with different letters indicate significant differences between treatments (P < 0.05). C, control; C+G, control treated with 0.5 mM GABA; H, heat stress; H+G, heat-stressed plants treated with 0.5 mM GABA.
-
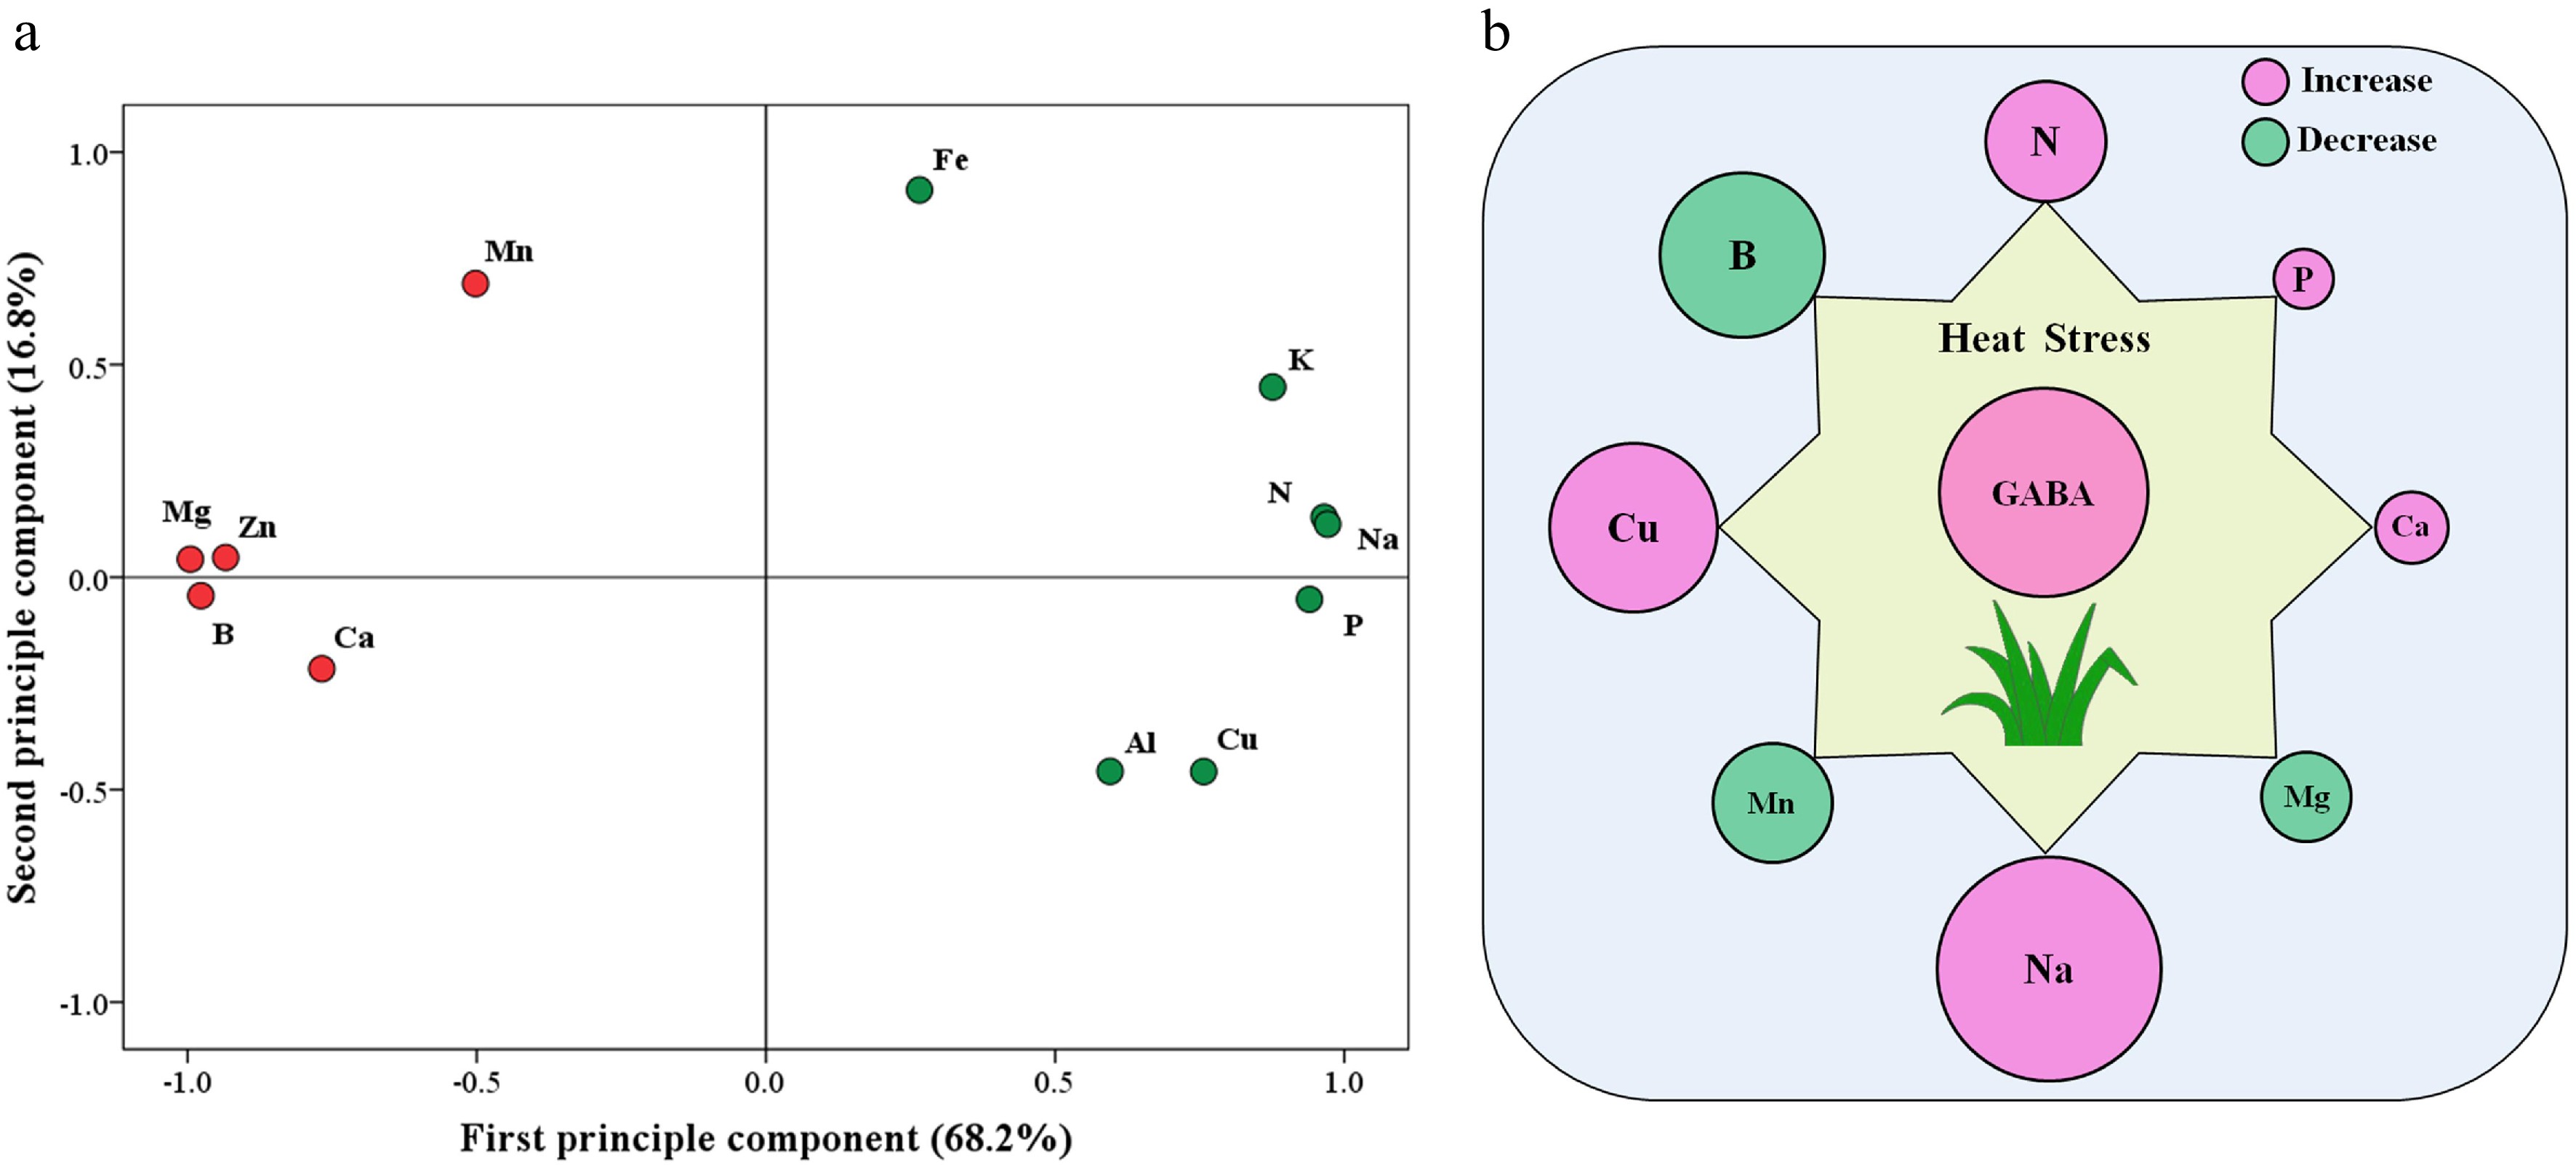
Figure 7.
(a) Principal component analysis (PCA) based on 12 different nutrient elements that were responsive to heat stress and exogenous γ-aminobutyric acid (GABA) and (b) significant effects of GABA on eight different nutrient elements that were responsive to heat stress (HG vs. H) in leaves of creeping bentgrass (the size of the circle indicates the degree of increase or decrease). H, heat stress; HG, heat-stressed plants treated with 0.5 mM GABA.
Figures
(7)
Tables
(0)