-
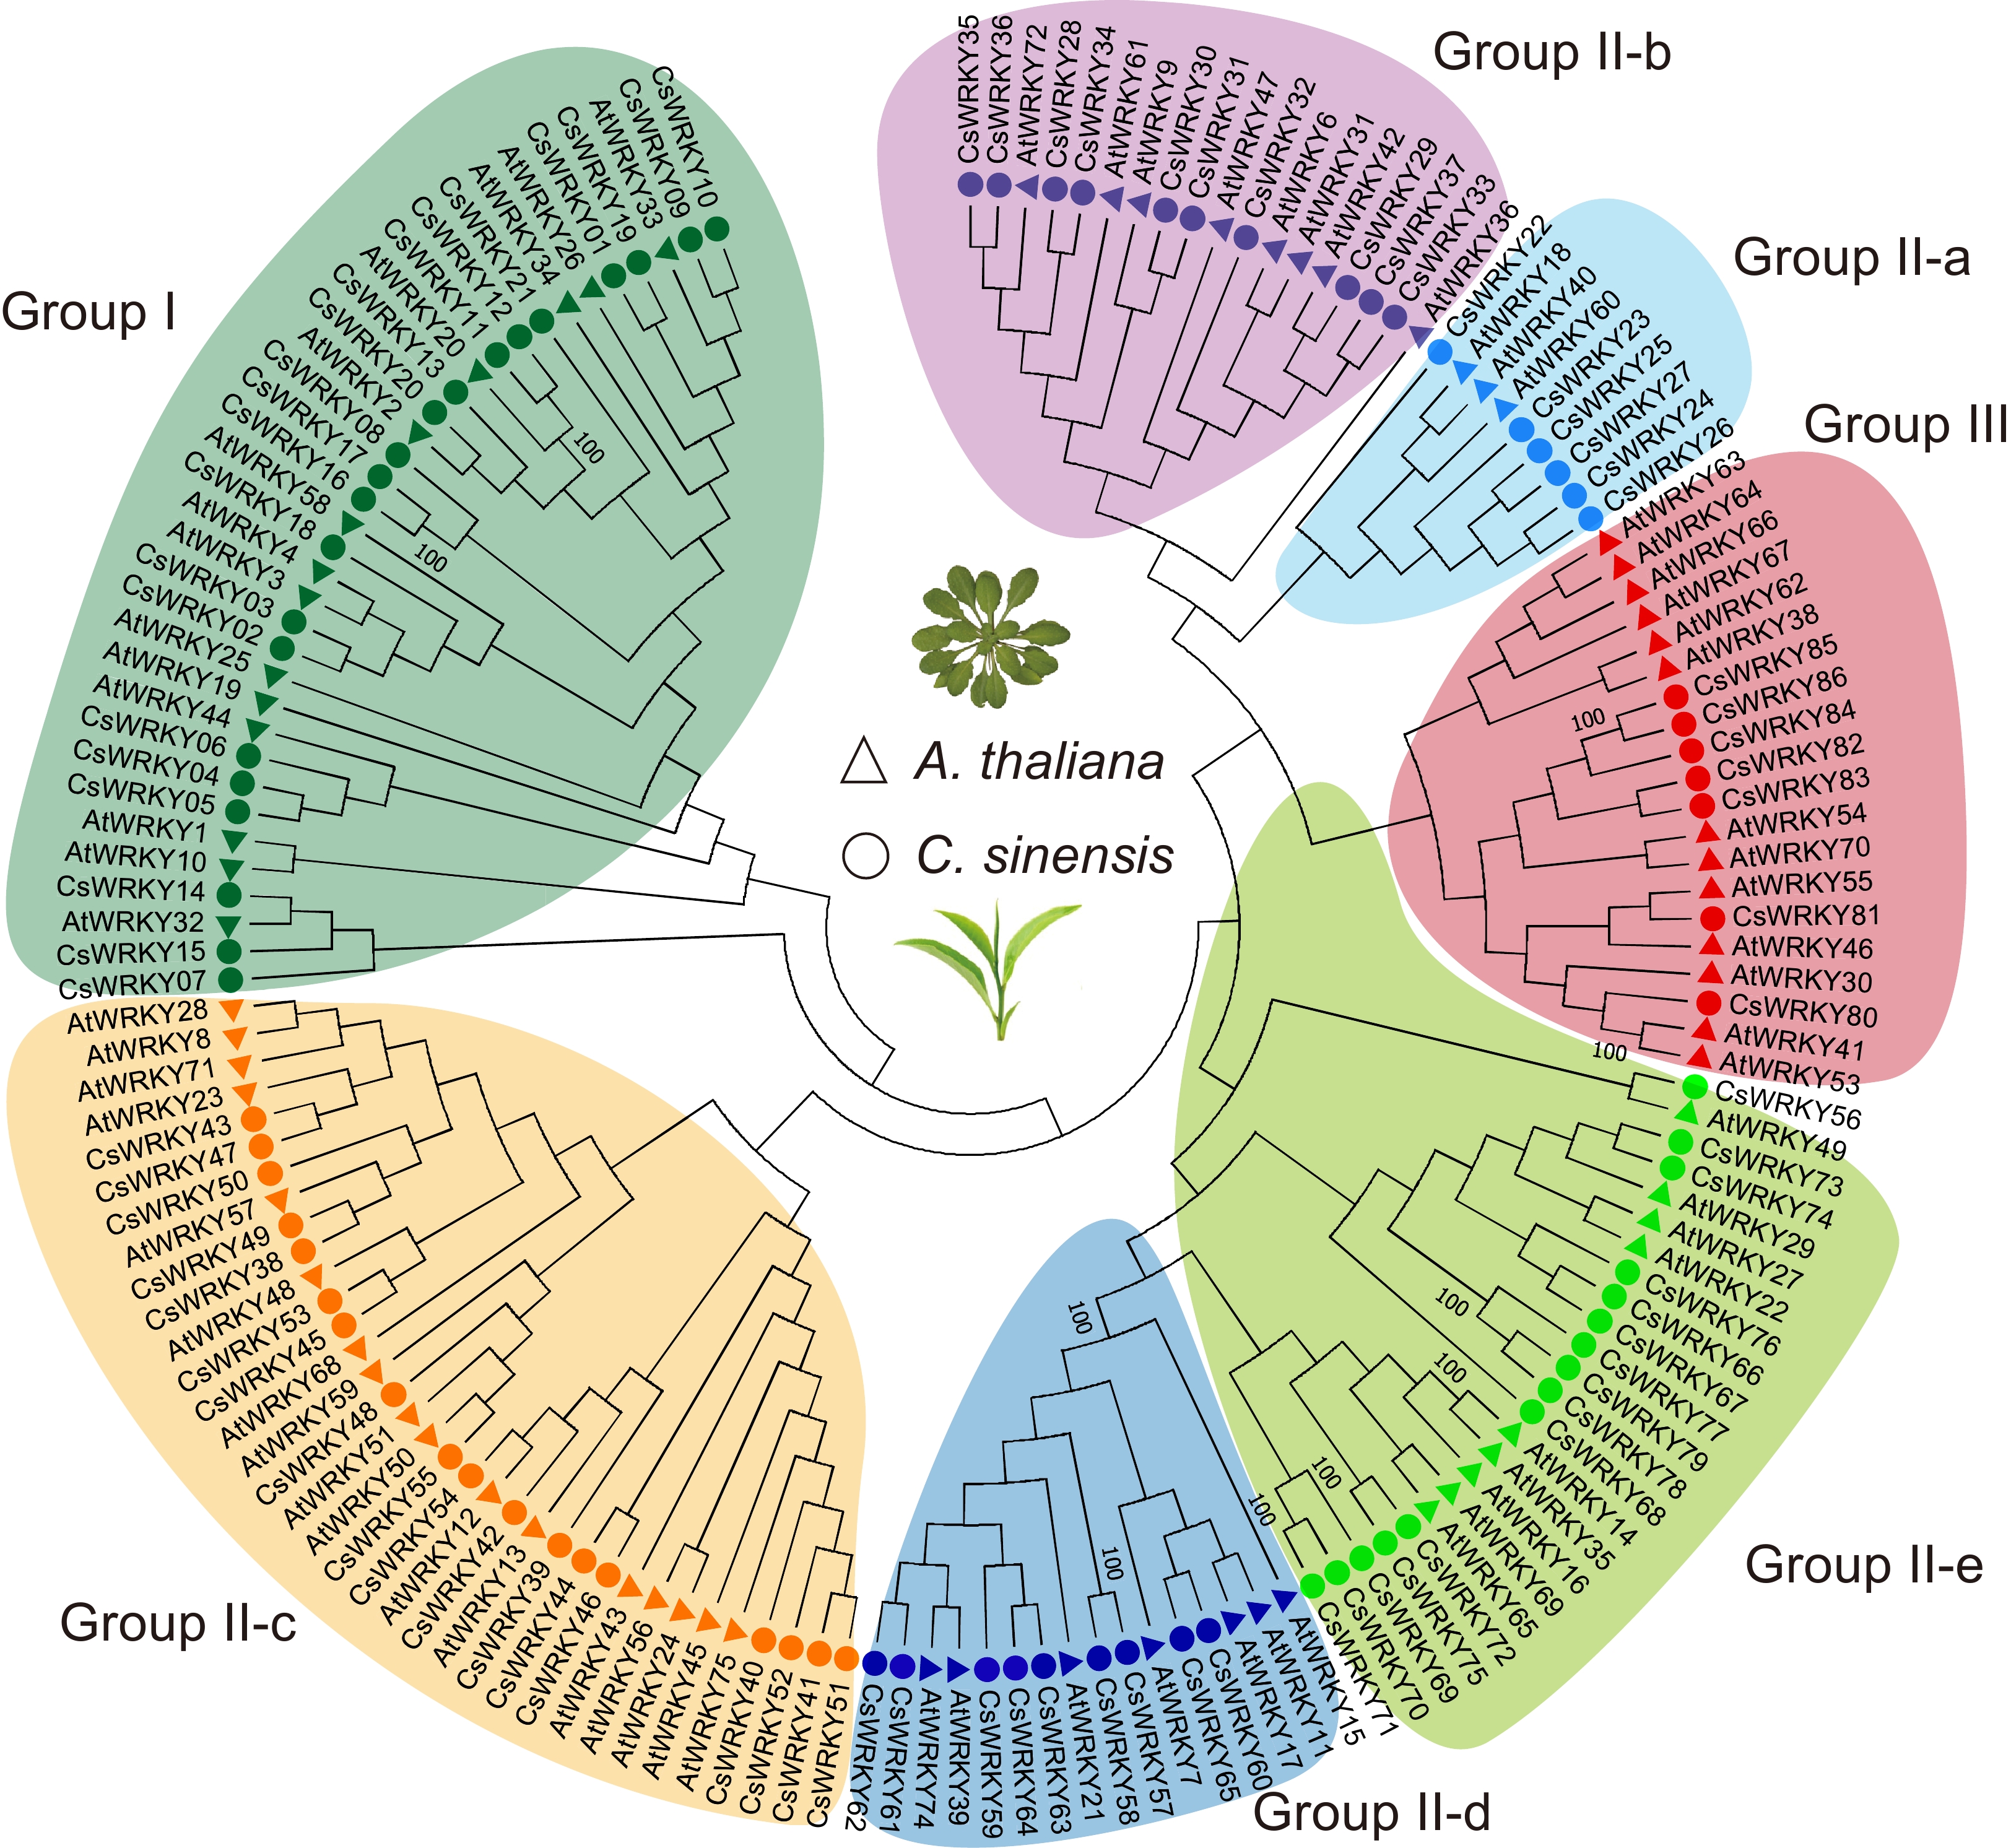
Figure 1.
Phylogeny and classification of CsWRKY genes in the tea plants. The phylogenetic tree was generated from the conserved WRKY domains obtained from tea plants and A. thaliana using the neighbor-joining method. The circles and triangles represent tea plants and Arabidopsis, respectively. Different colors represent the classes and subclasses of each WRKY class. Green: group I; blue: II-a; purple: II-b; orange: II-c; dark blue: II-d; light green: II-e; red: III. The bootstrap values for some key nodes are presented beside the branches.
-
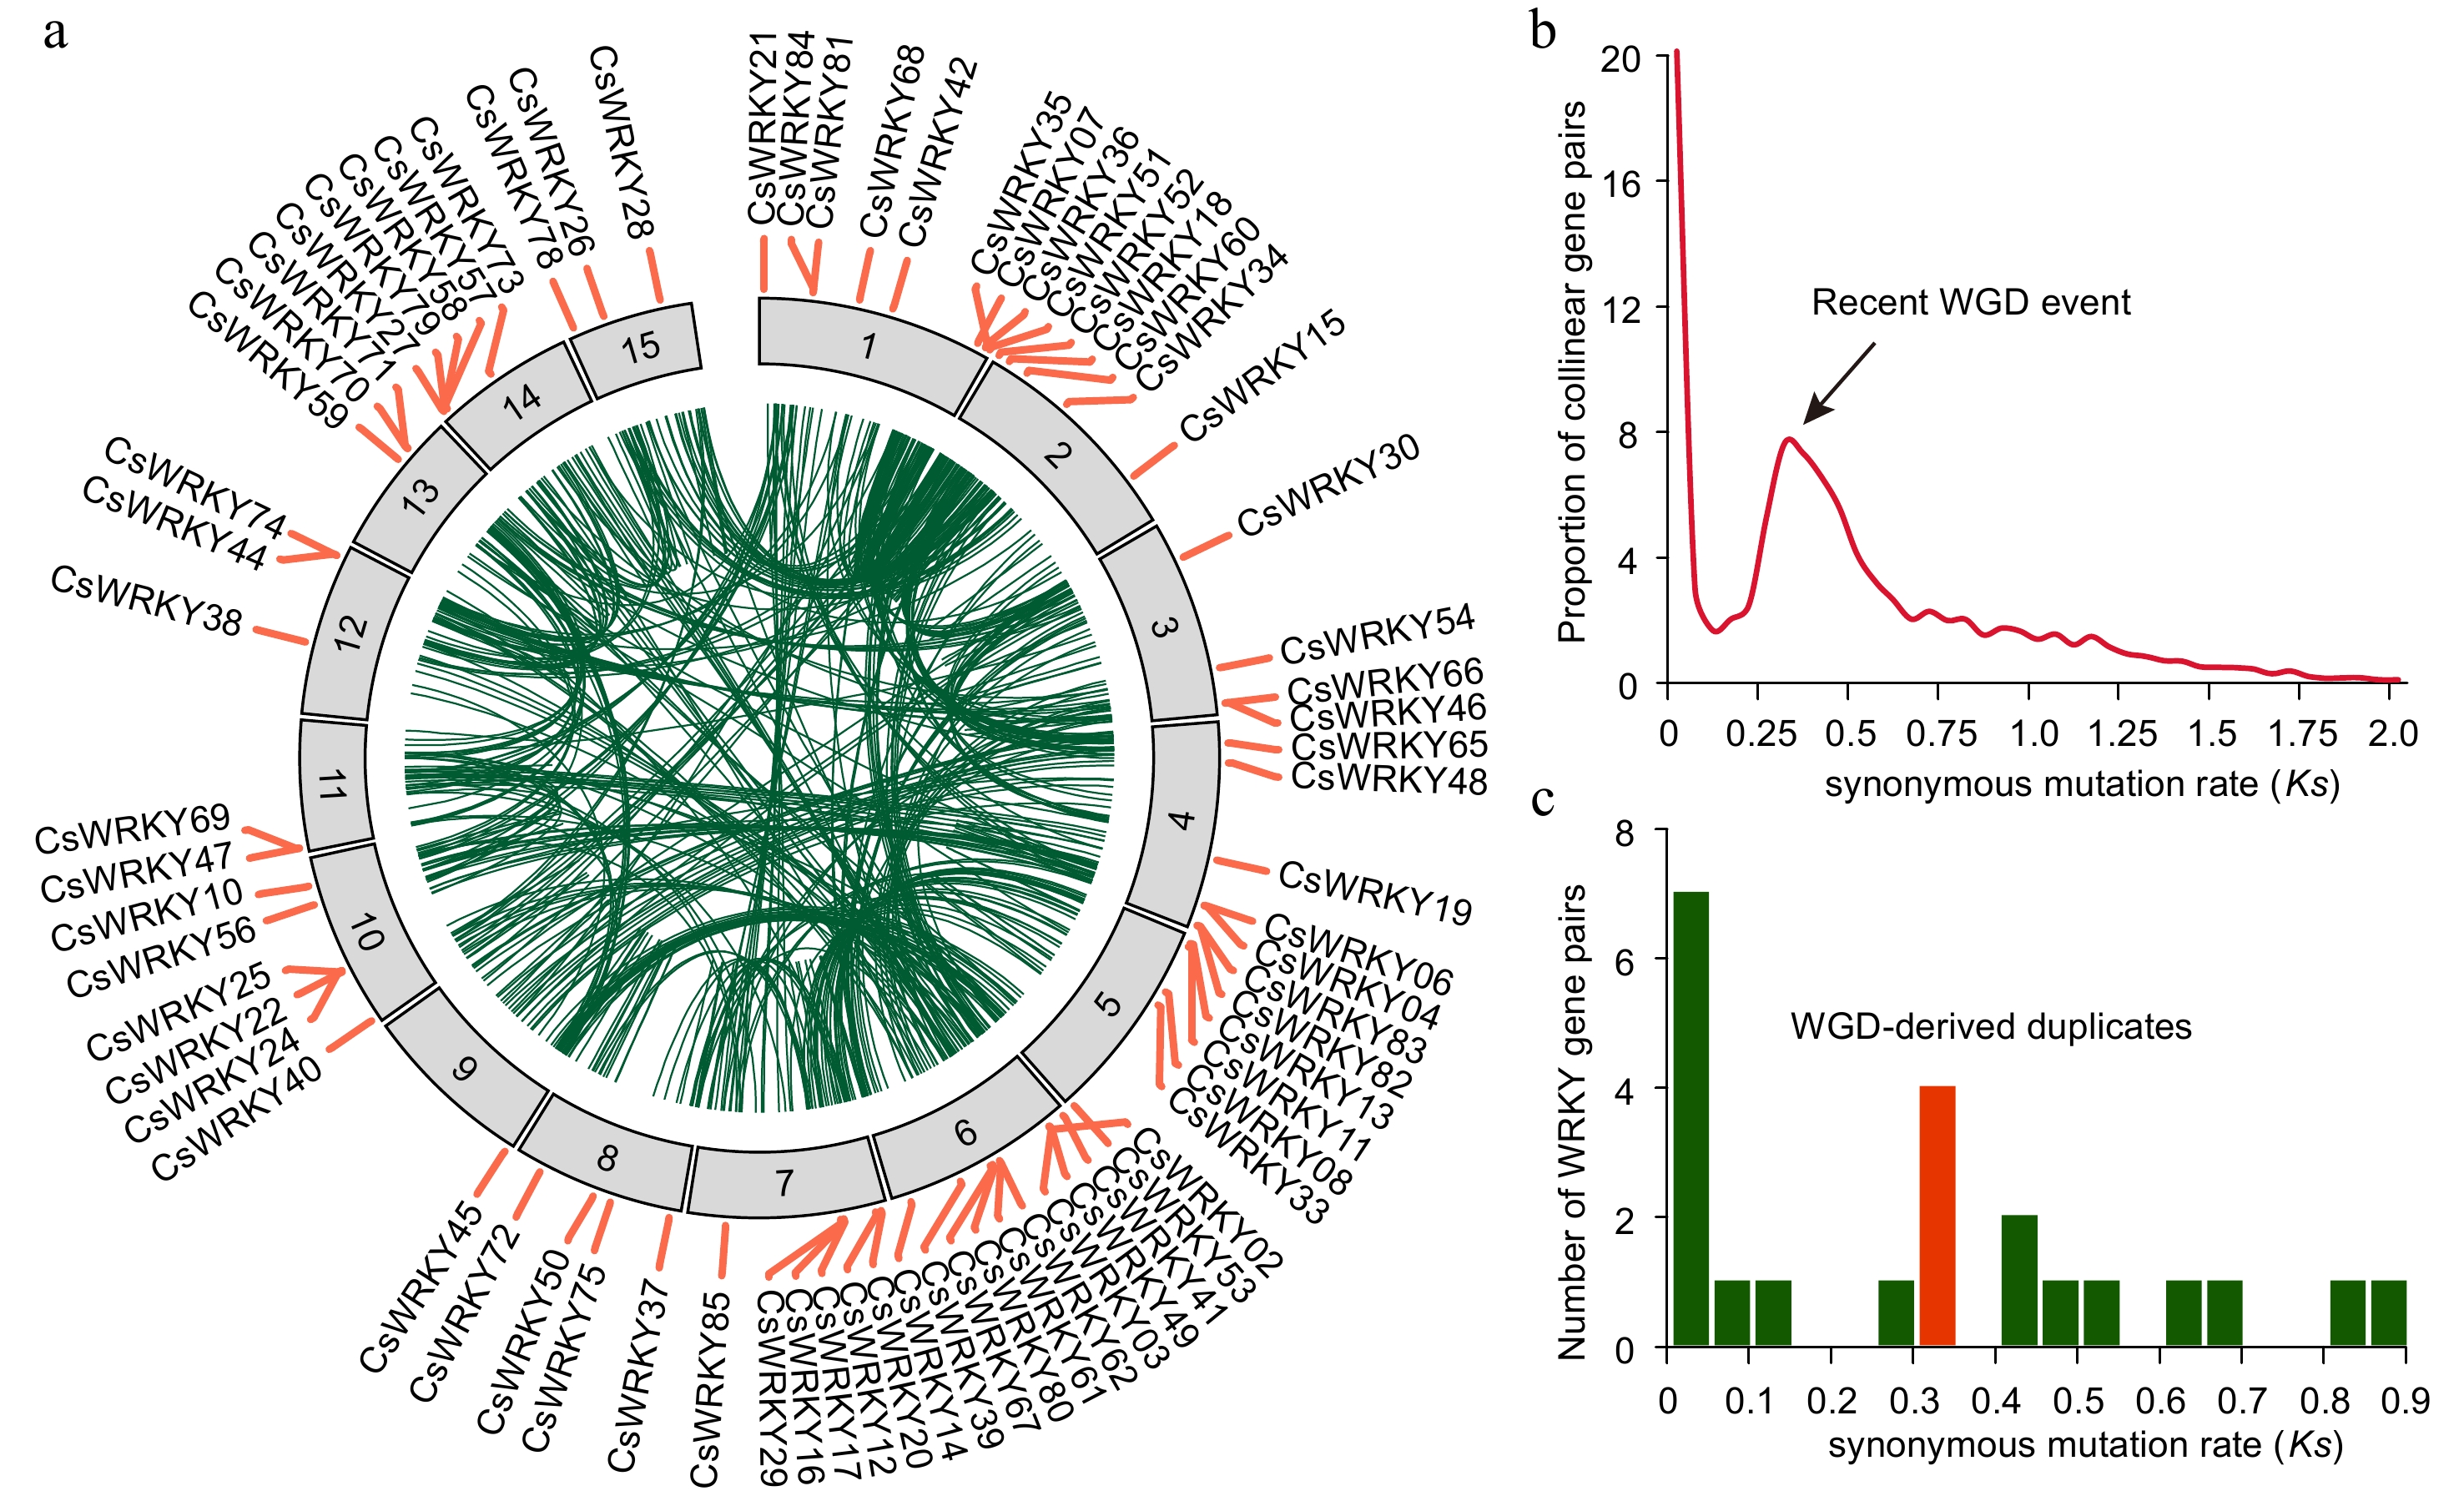
Figure 2.
Chromosome distribution and evolution of CsWRKY genes of tea plants. (a) Chromosome distribution of WRKY genes of tea plants. Only the 74 CsWRKY genes that reside on the tea chromosomes are shown. The outer circles represent the 15 chromosomes of the tea plant genome, while the inner circles exhibit the 725 genomic collinear blocks (green links) within the tea plant genome. (b) Distribution of the synonymous mutation rate (Ks) of 8,208 gene pairs located in 725 collinear blocks. The peak of Ks distribution represents the recent whole genome duplication (WGD) event that occurred in the tea plant genome. (c) Ks distribution of CsWRKY gene pairs. The red bar indicates the total number of CsWRKY gene pairs duplicated at the time of the WGD event.
-
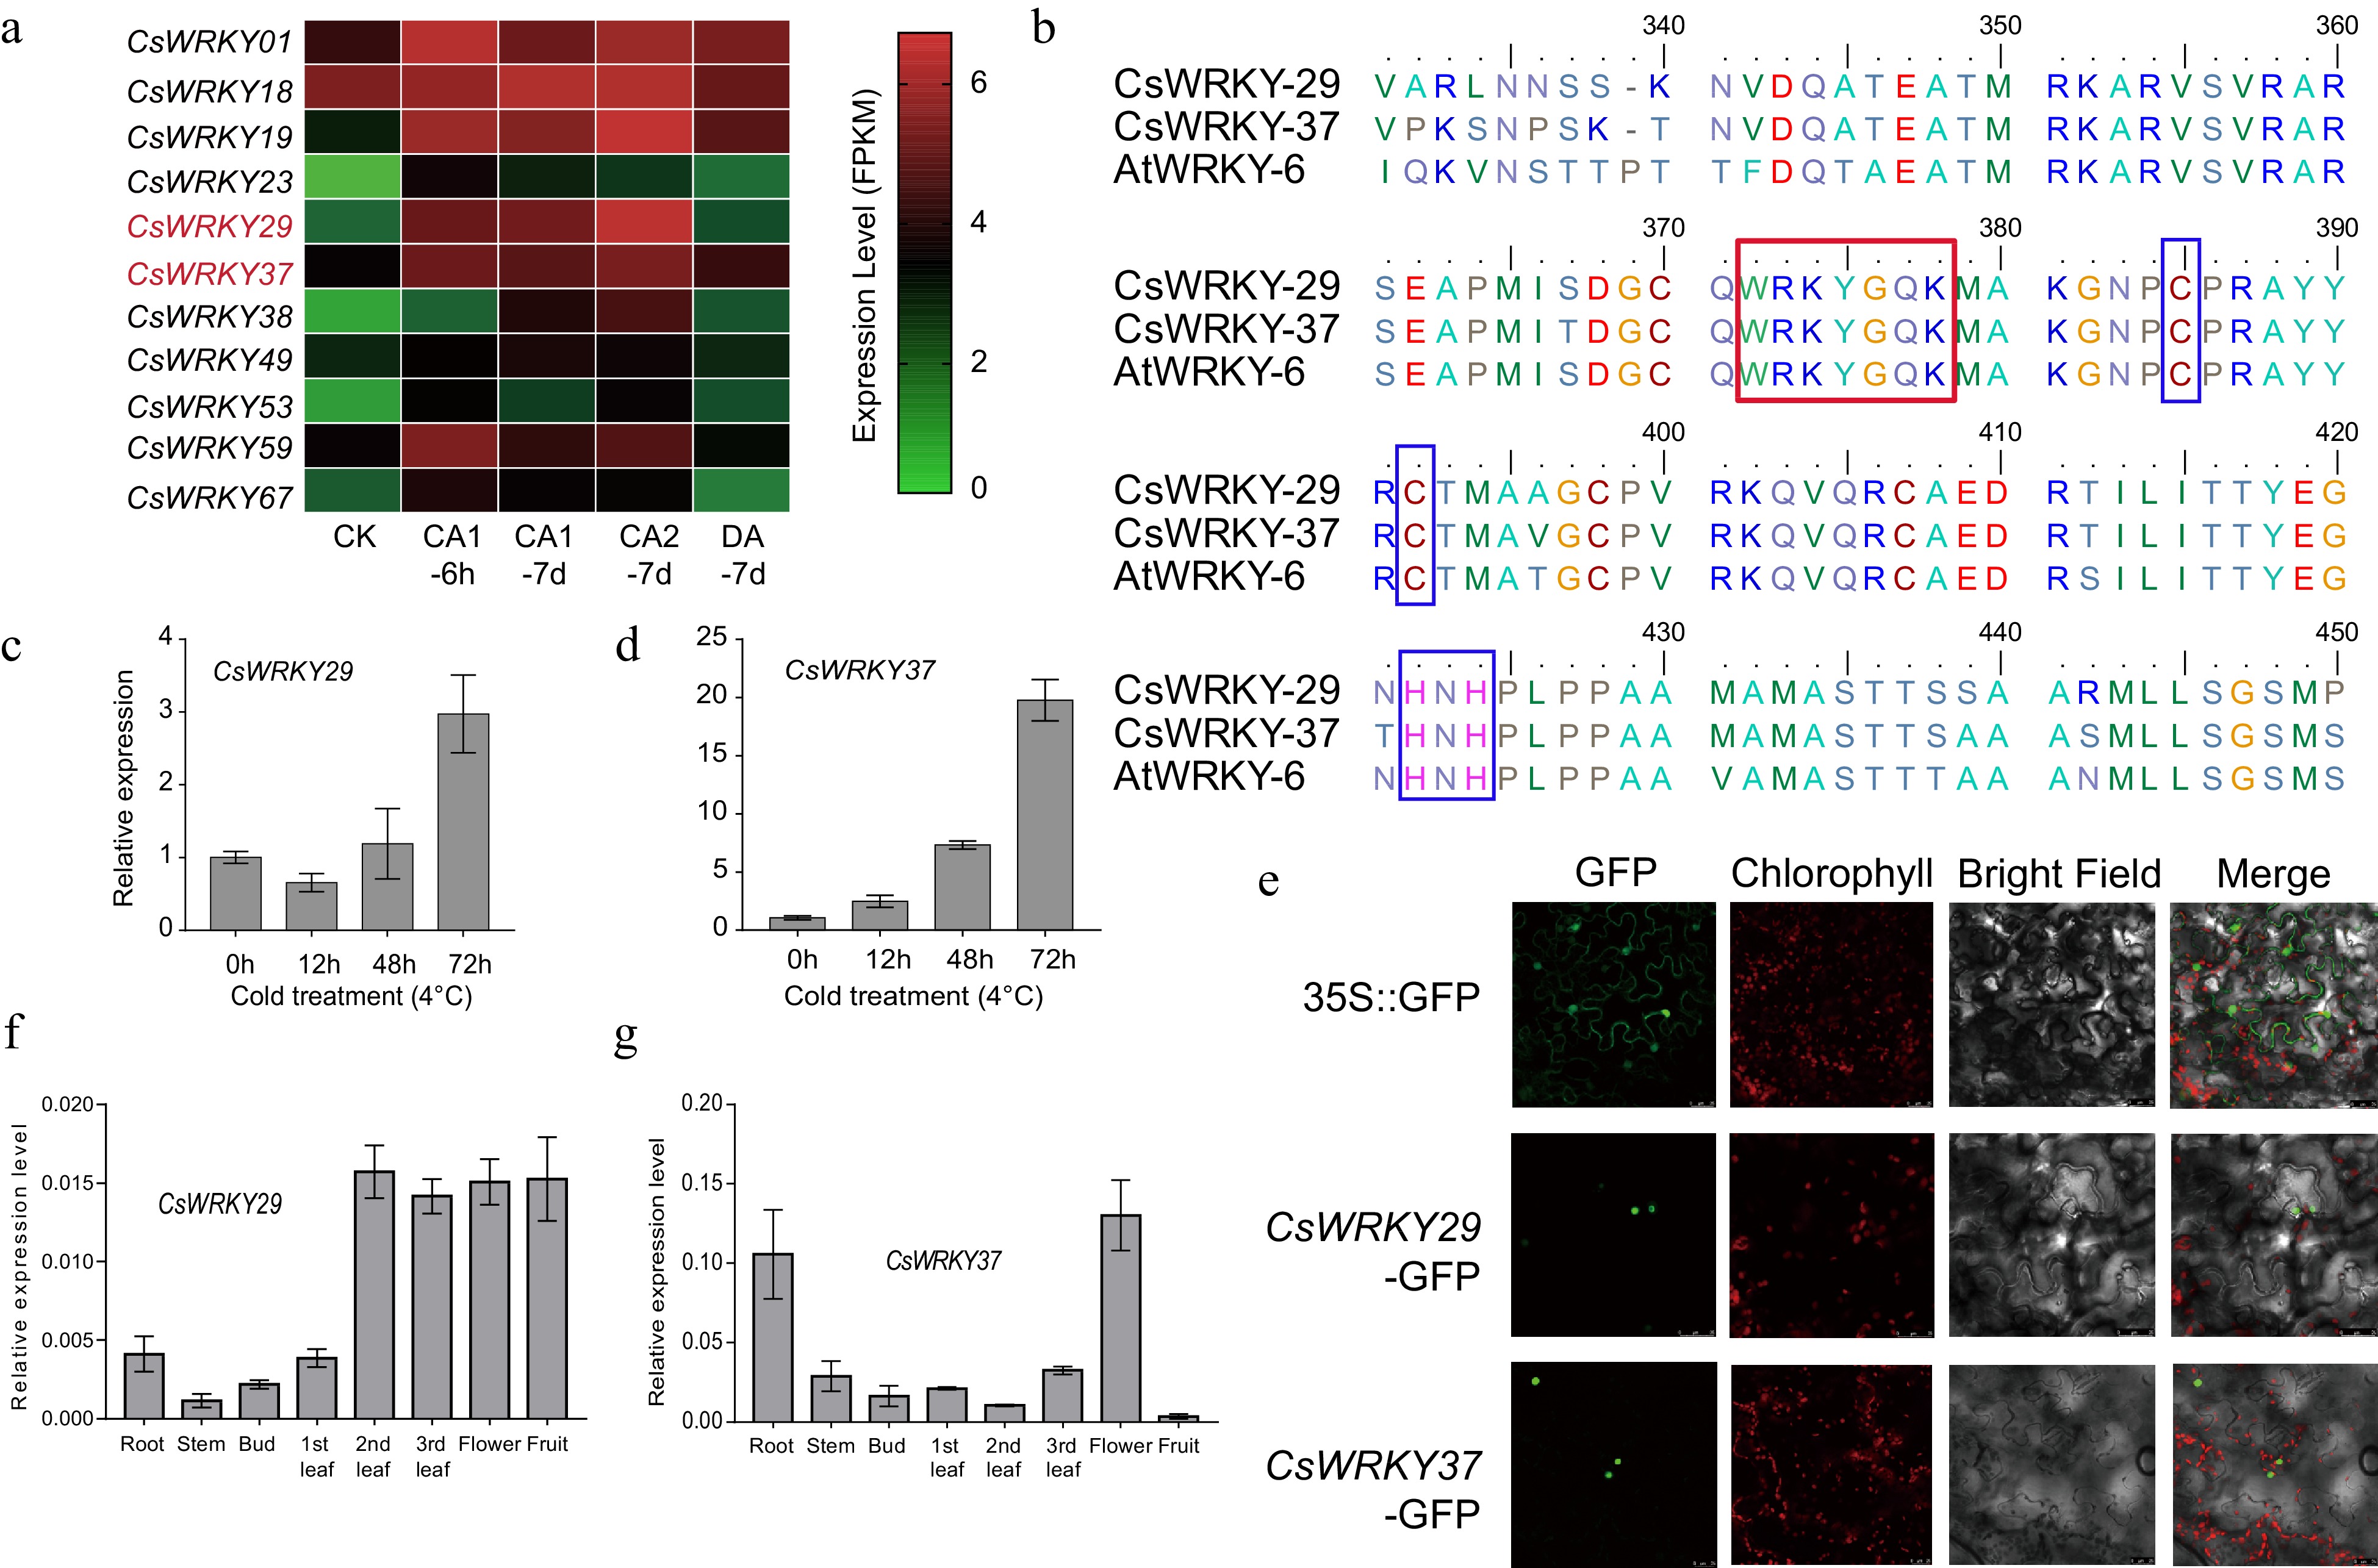
Figure 3.
Cloning and subcellular localization of two cold-responsive WRKY genes, CsWRKY29 and CsWRKY37, in tea plants. (a) Expression patterns of the 11 differentially expressed genes of tea plant during cold acclimation. CK: non-acclimated (25 °C day, 20 °C night); CA 1-6 h: fully acclimated (10 °C for 6 h); CA 1-7 d: 10 °C day and 4 °C night for 7 d; CA 2-7 d: cold response (4 °C day, 0 °C night for 7 d); DA-7 d: recovering (25 °C day, 20 °C night for 7 d). (b) Multiple sequence alignment of CsWRKY29, CAWRKY37, and their homologous in Arabidopsis (AtWRKY6). The red and blue boxes represent the WRKY domain and C2H2 type zinc-finger motif, respectively. (c) Relative expression levels of CsWRKY29 and (d) CsWRKY37 genes under cold treatments (4 °C) were revealed by qRT-PCR experiments. (e) Subcellular localization of CsWRKY29 and CsWRKY37 proteins. Expression patterns of CsWRKY29 (f) and CsWRKY37 (g) among different tissues of tea plants.
-
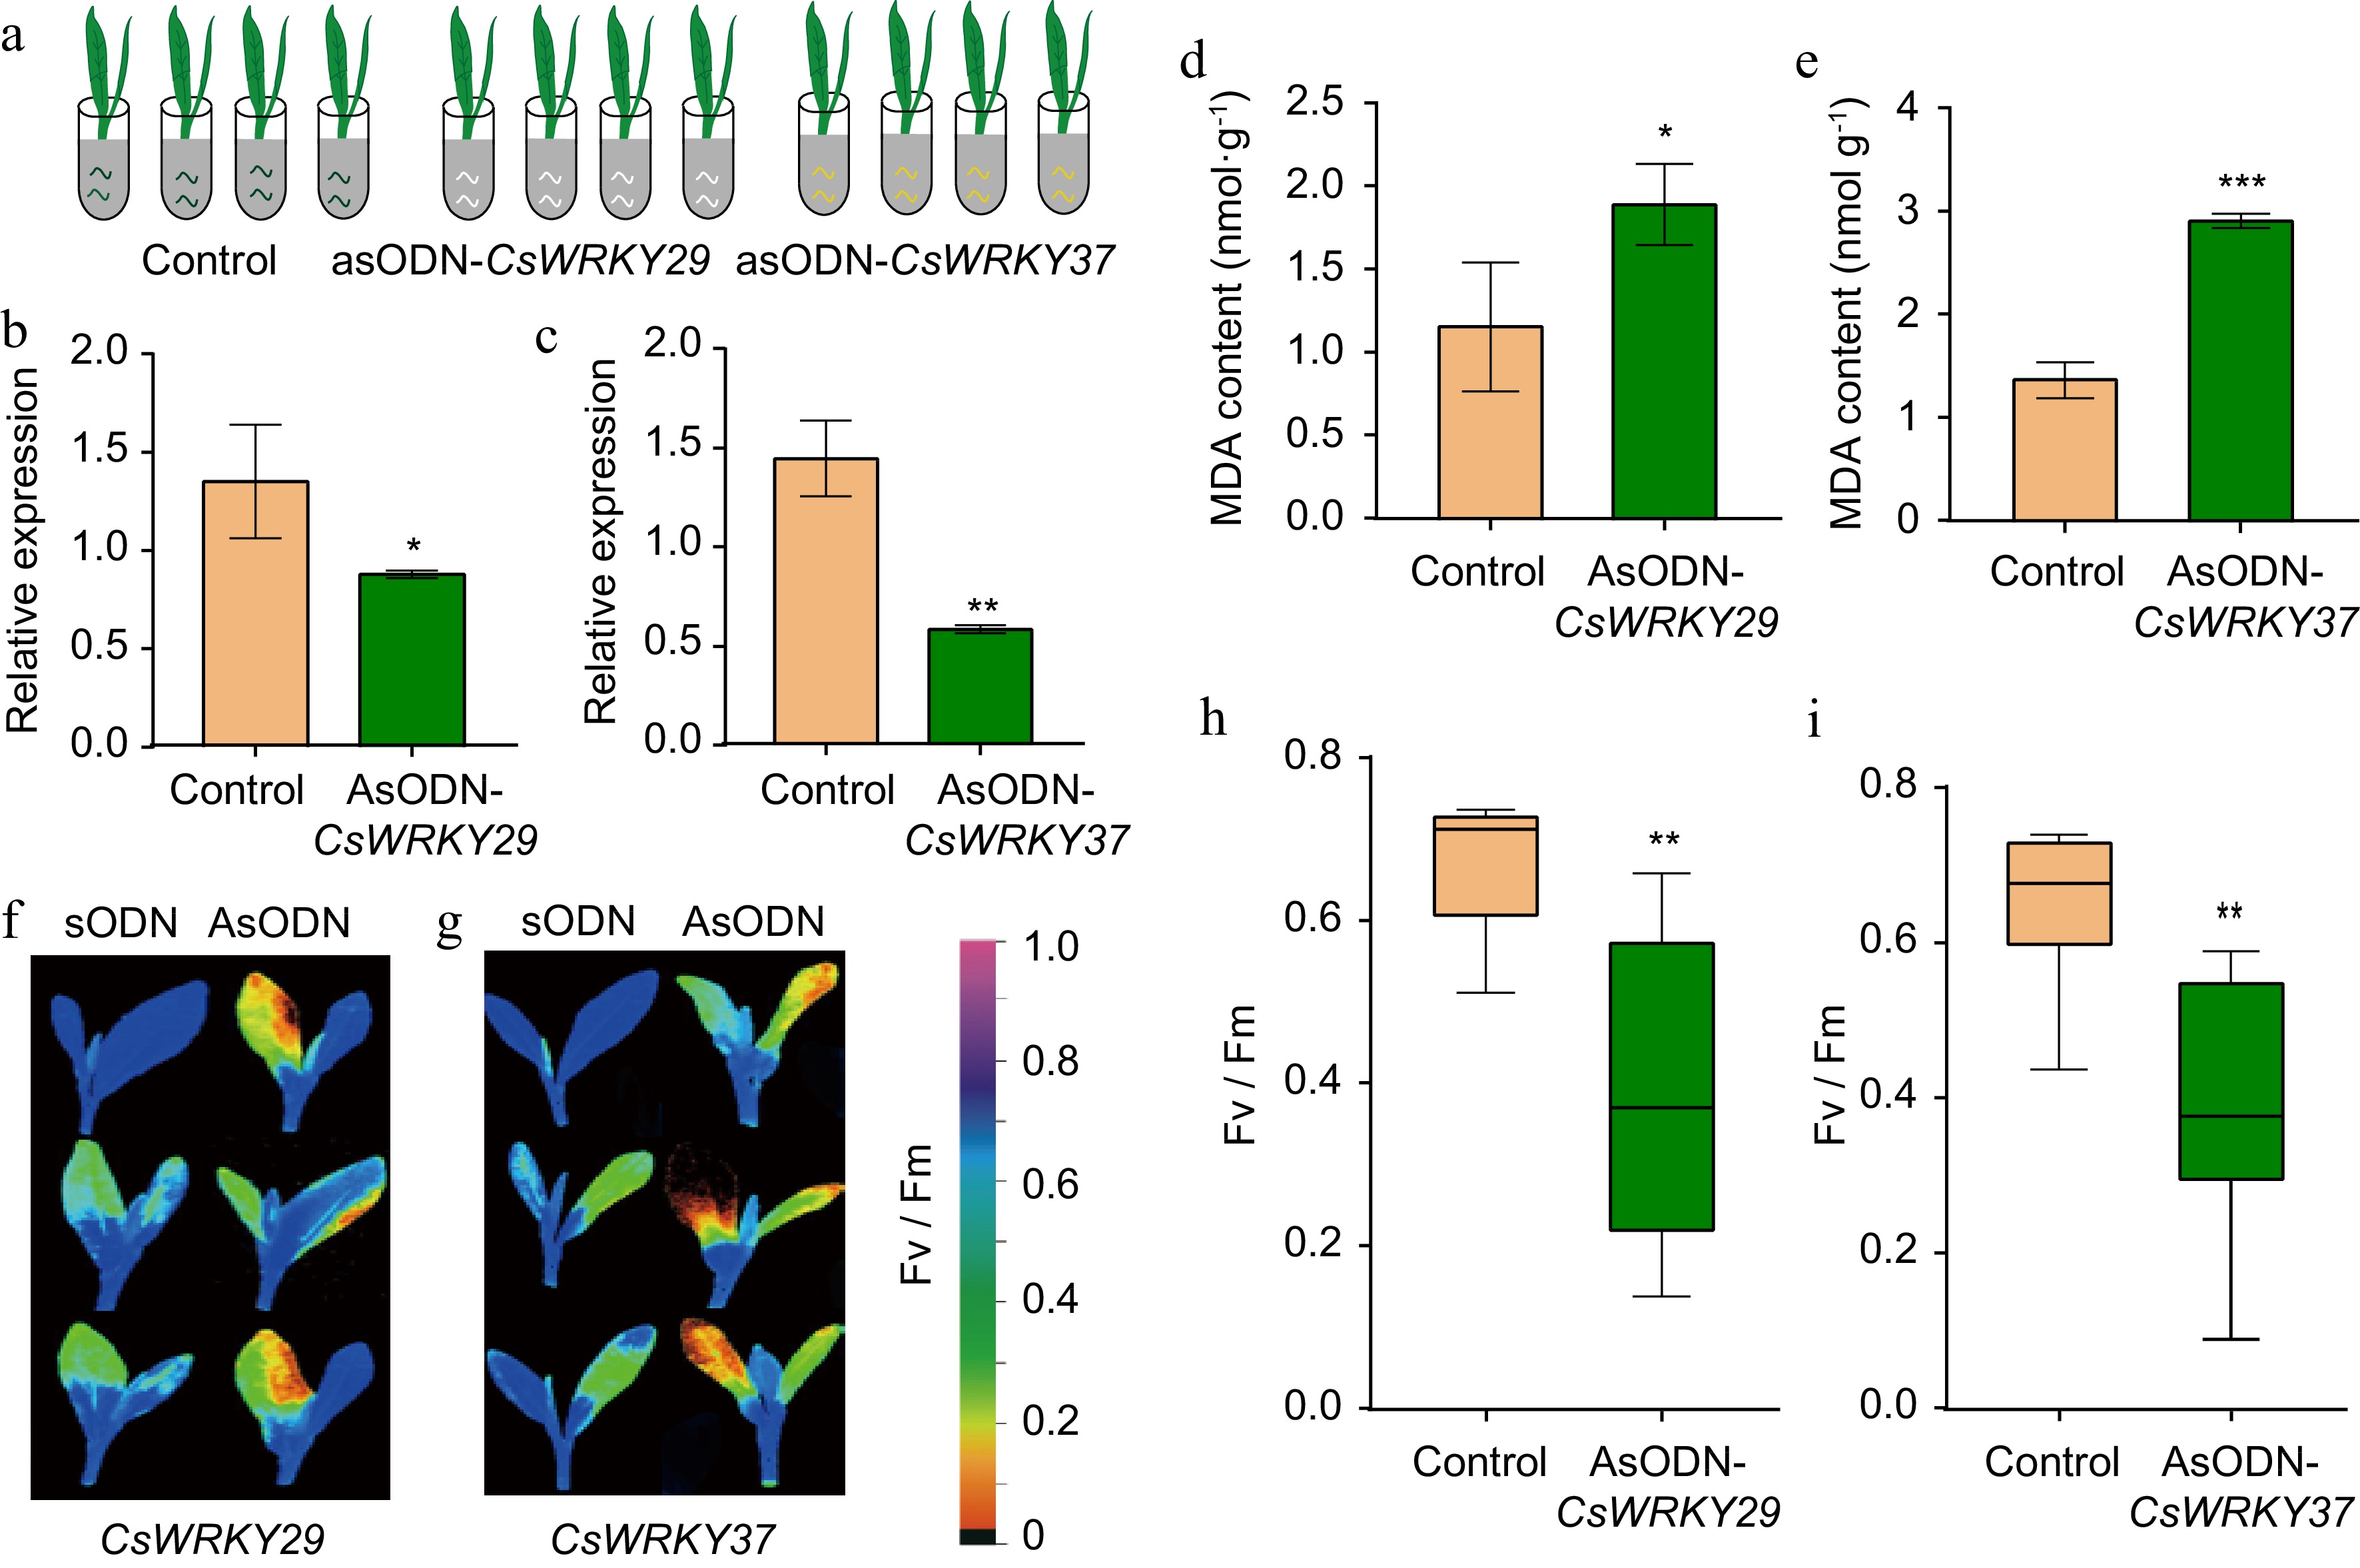
Figure 4.
Antisense oligodeoxynucleotides- based gene silencing of CsWRKY29 and CsWRKY37 in tender leaves of tea plants. (a) A schematic diagram of AsODN silencing of CsWRKY29 and CsWRKY37. (b) Relative expression levels of CsWRKY29 and (c) CsWRKY37 feeding with AsODN compared to control. (d) MDA contents in CsWRKY29 and (e) CsWRKY37-silenced tea plant seedlings compared to control. (f) Determination of the net photosynthetic rate and maximum photochemical efficiency of photosystem II (Fv/Fm) in CsWRKY29- and (g) CsWRKY37-silenced and control tea plants. (h), (i) Fv/Fm values in CsWRKY29/37-silenced and control tea plants.
-
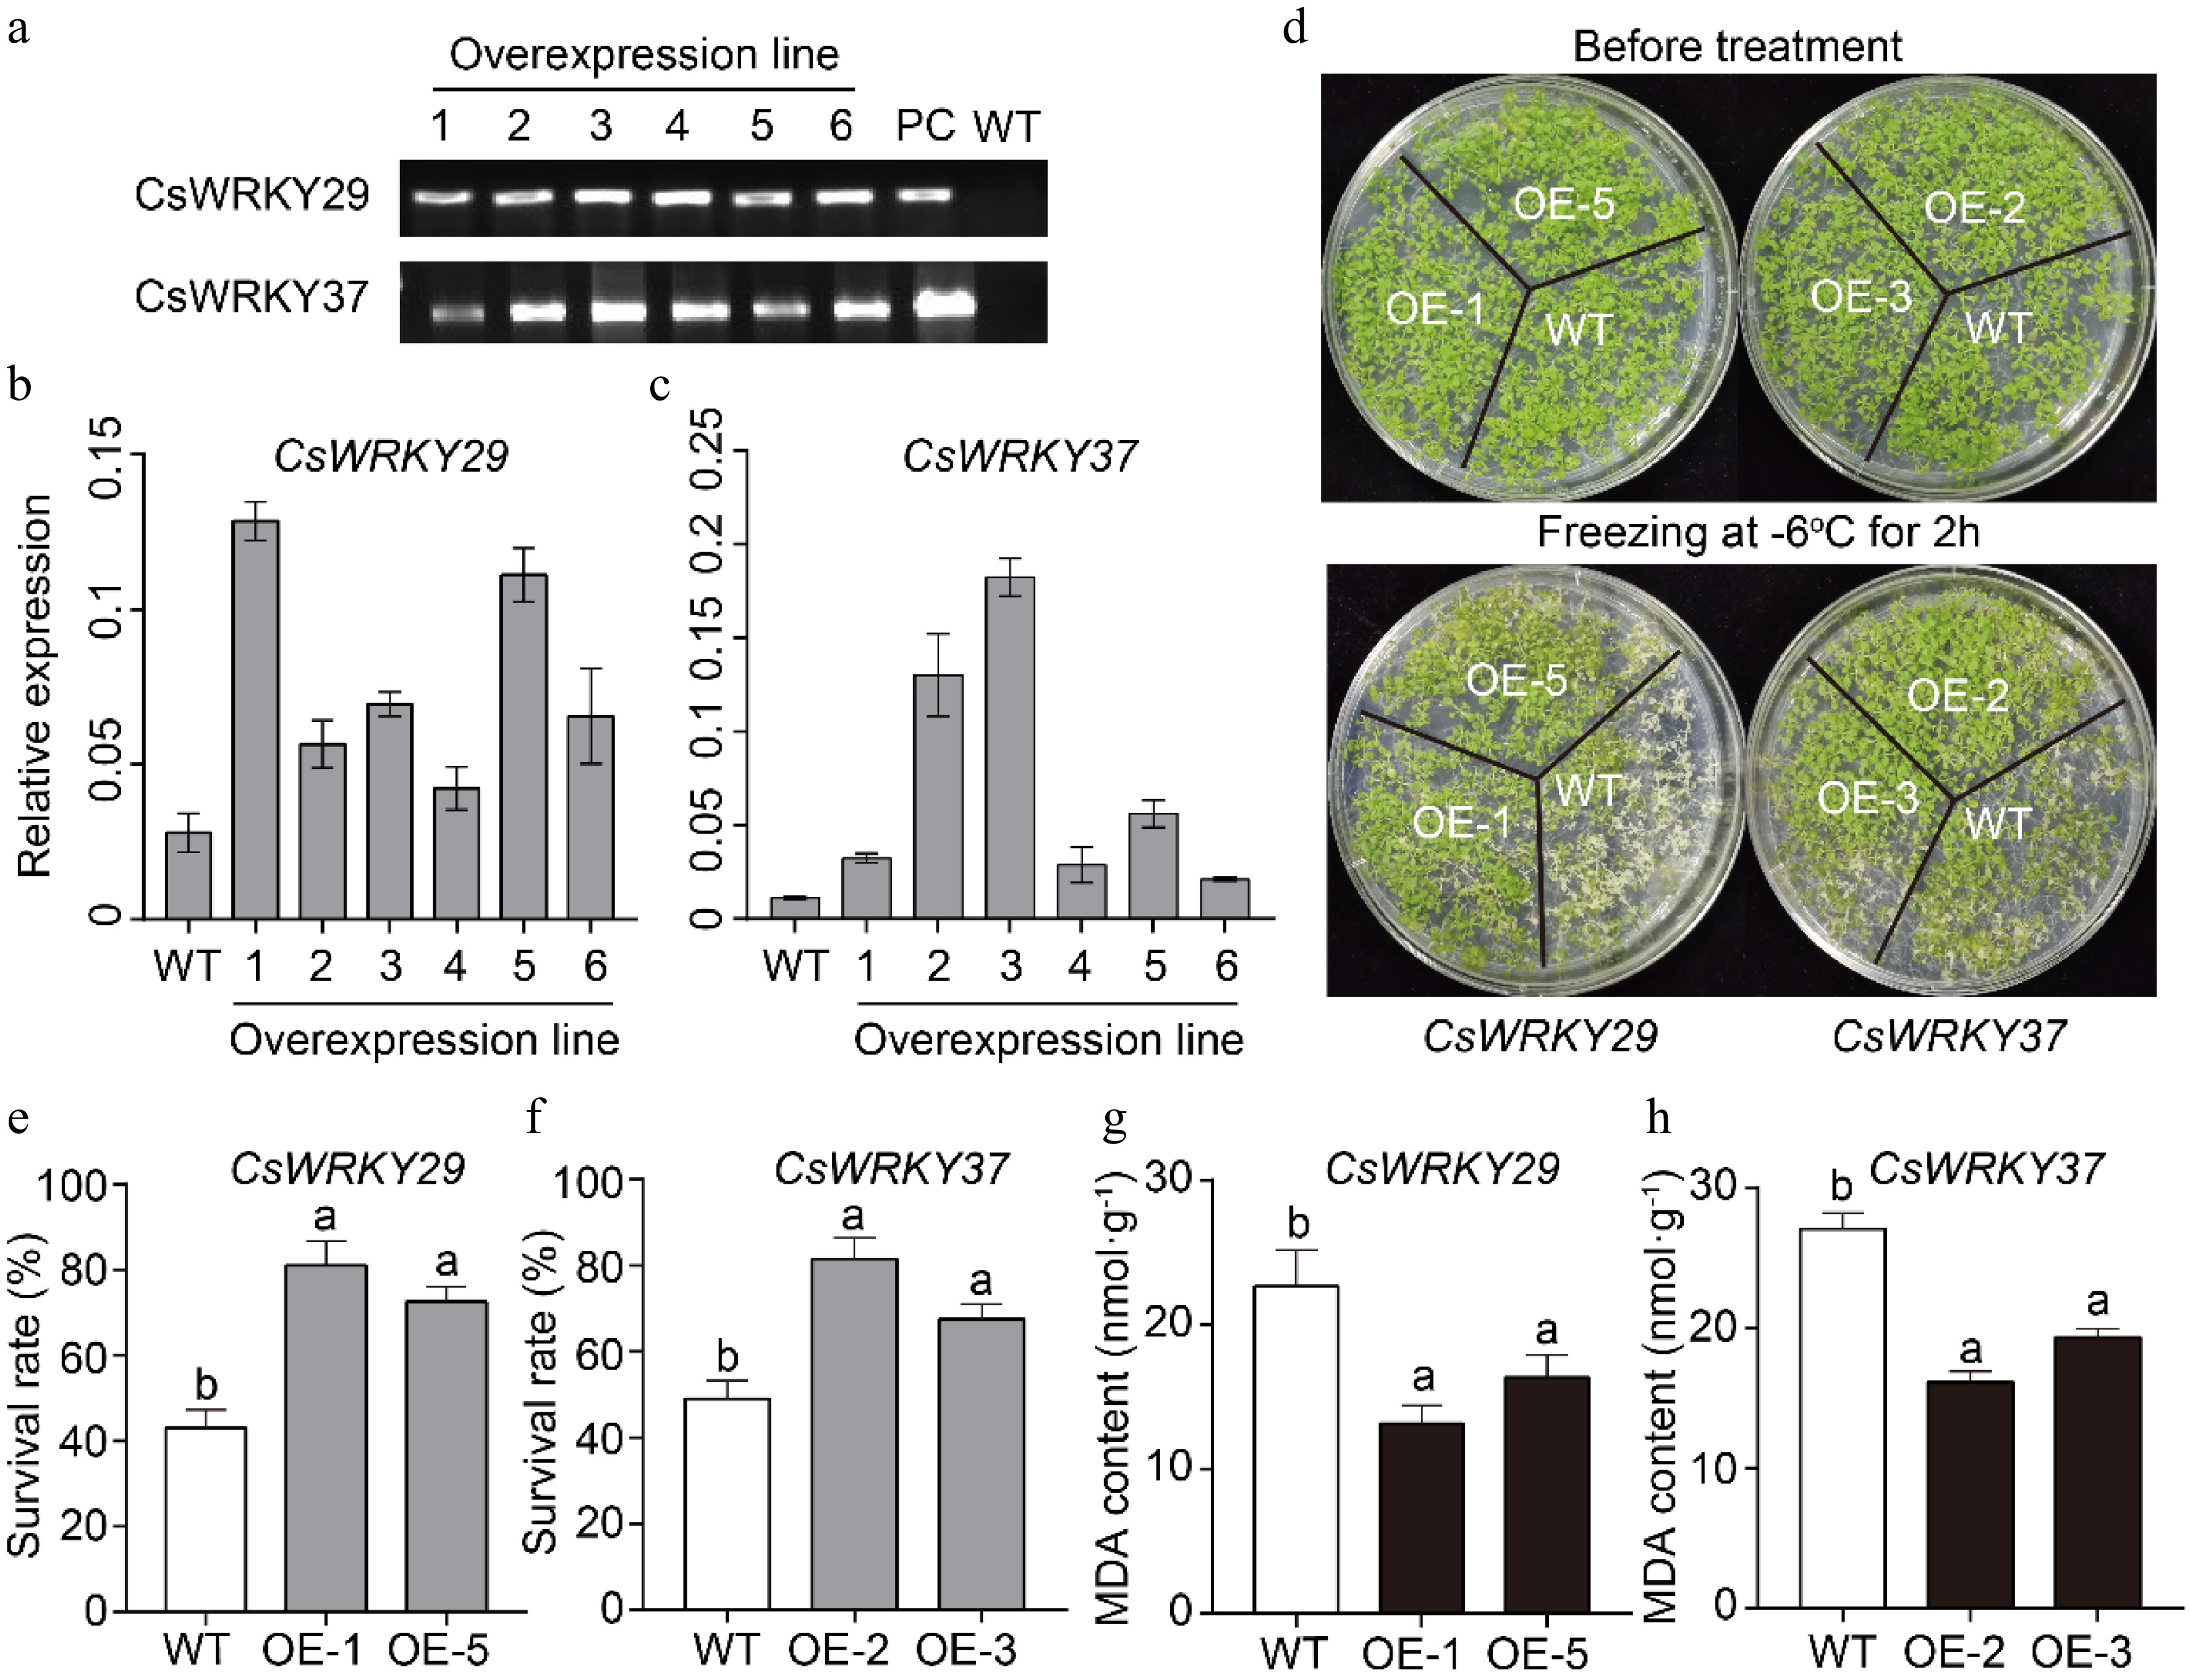
Figure 5.
Overexpression of the CsWRKY29 and CsWRKY37 in Arabidopsis plants. (a) Screening and PCR validation of CsWRKY29/37 transgenic Arabidopsis plants. OE1-6: overexpression line 1−6; PC: positive control; WT: wild-type. (b, c) Expression levels of CsWRKY29/37 genes in six transgenic Arabidopsis plants. (d) The top panel shows the phenotypes of wild-type and transgenic plants growing normally for 2 weeks, while the bottom panel illustrates the phenotypes of wild-type and transgenic plants after cold treatments at −6 °C for 2 h. (e, f) Survival rates of wild-type and transgenic Arabidopsis plants (p < 0.05) after cold treatments. (g, h) MDA contents of wild-type and transgenic Arabidopsis plants (p < 0.05) after cold treatments.
-
Duplicated gene pairs Group Ka Ks Ka/Ks Time
(MYA)CsWRKY01 CsWRKY19 I 0.1536 0.6681 0.2299 51.39 CsWRKY04 CsWRKY06 I 0.0055 0.0091 0.6063 0.70 CsWRKY04 CsWRKY05 I 0.1134 0.4451 0.2547 34.24 CsWRKY05 CsWRKY06 I 0.1156 0.4440 0.2603 34.15 CsWRKY08 CsWRKY16 I 0.1544 0.2985 0.5172 22.96 CsWRKY08 CsWRKY17 I 0.1544 0.3037 0.5084 23.36 CsWRKY09 CsWRKY10 I 0.0007 0.0051 0.1458 0.40 CsWRKY14 CsWRKY15 I 0.1189 0.3433 0.3463 26.41 CsWRKY23 CsWRKY26 II-a 0.2264 0.8721 0.2596 67.09 CsWRKY35 CsWRKY36 II-b 0.0027 0.0041 0.6473 0.32 CsWRKY39 CsWRKY54 II-c 0.2139 0.8251 0.2592 63.47 CsWRKY45 CsWRKY53 II-c 0.1079 0.4813 0.2242 37.02 CsWRKY59 CsWRKY63 II-d 0.1410 0.5340 0.2640 41.08 CsWRKY61 CsWRKY62 II-d 0.0062 0.0093 0.6667 0.72 CsWRKY63 CsWRKY64 II-d 0.0463 0.0463 0.9987 3.56 CsWRKY64 CsWRKY59 II-d 0.1484 0.6345 0.2339 48.81 CsWRKY69 CsWRKY71 II-e 0.1527 0.3213 0.4755 24.71 CsWRKY69 CsWRKY70 II-e 0.1506 0.3213 0.4689 24.71 CsWRKY77 CsWRKY78 III 0.0260 0.0305 0.8539 2.34 CsWRKY77 CsWRKY79 III 0.0352 0.1048 0.3354 8.07 CsWRKY78 CsWRKY79 III 0.0305 0.0869 0.3516 6.68 CsWRKY82 CsWRKY83 III 0.0067 0.0094 0.7077 0.72 Table 1.
Estimation of Ka/Ks and divergence time of duplicated WRKY gene pairs of tea plants.
Figures
(5)
Tables
(1)