-
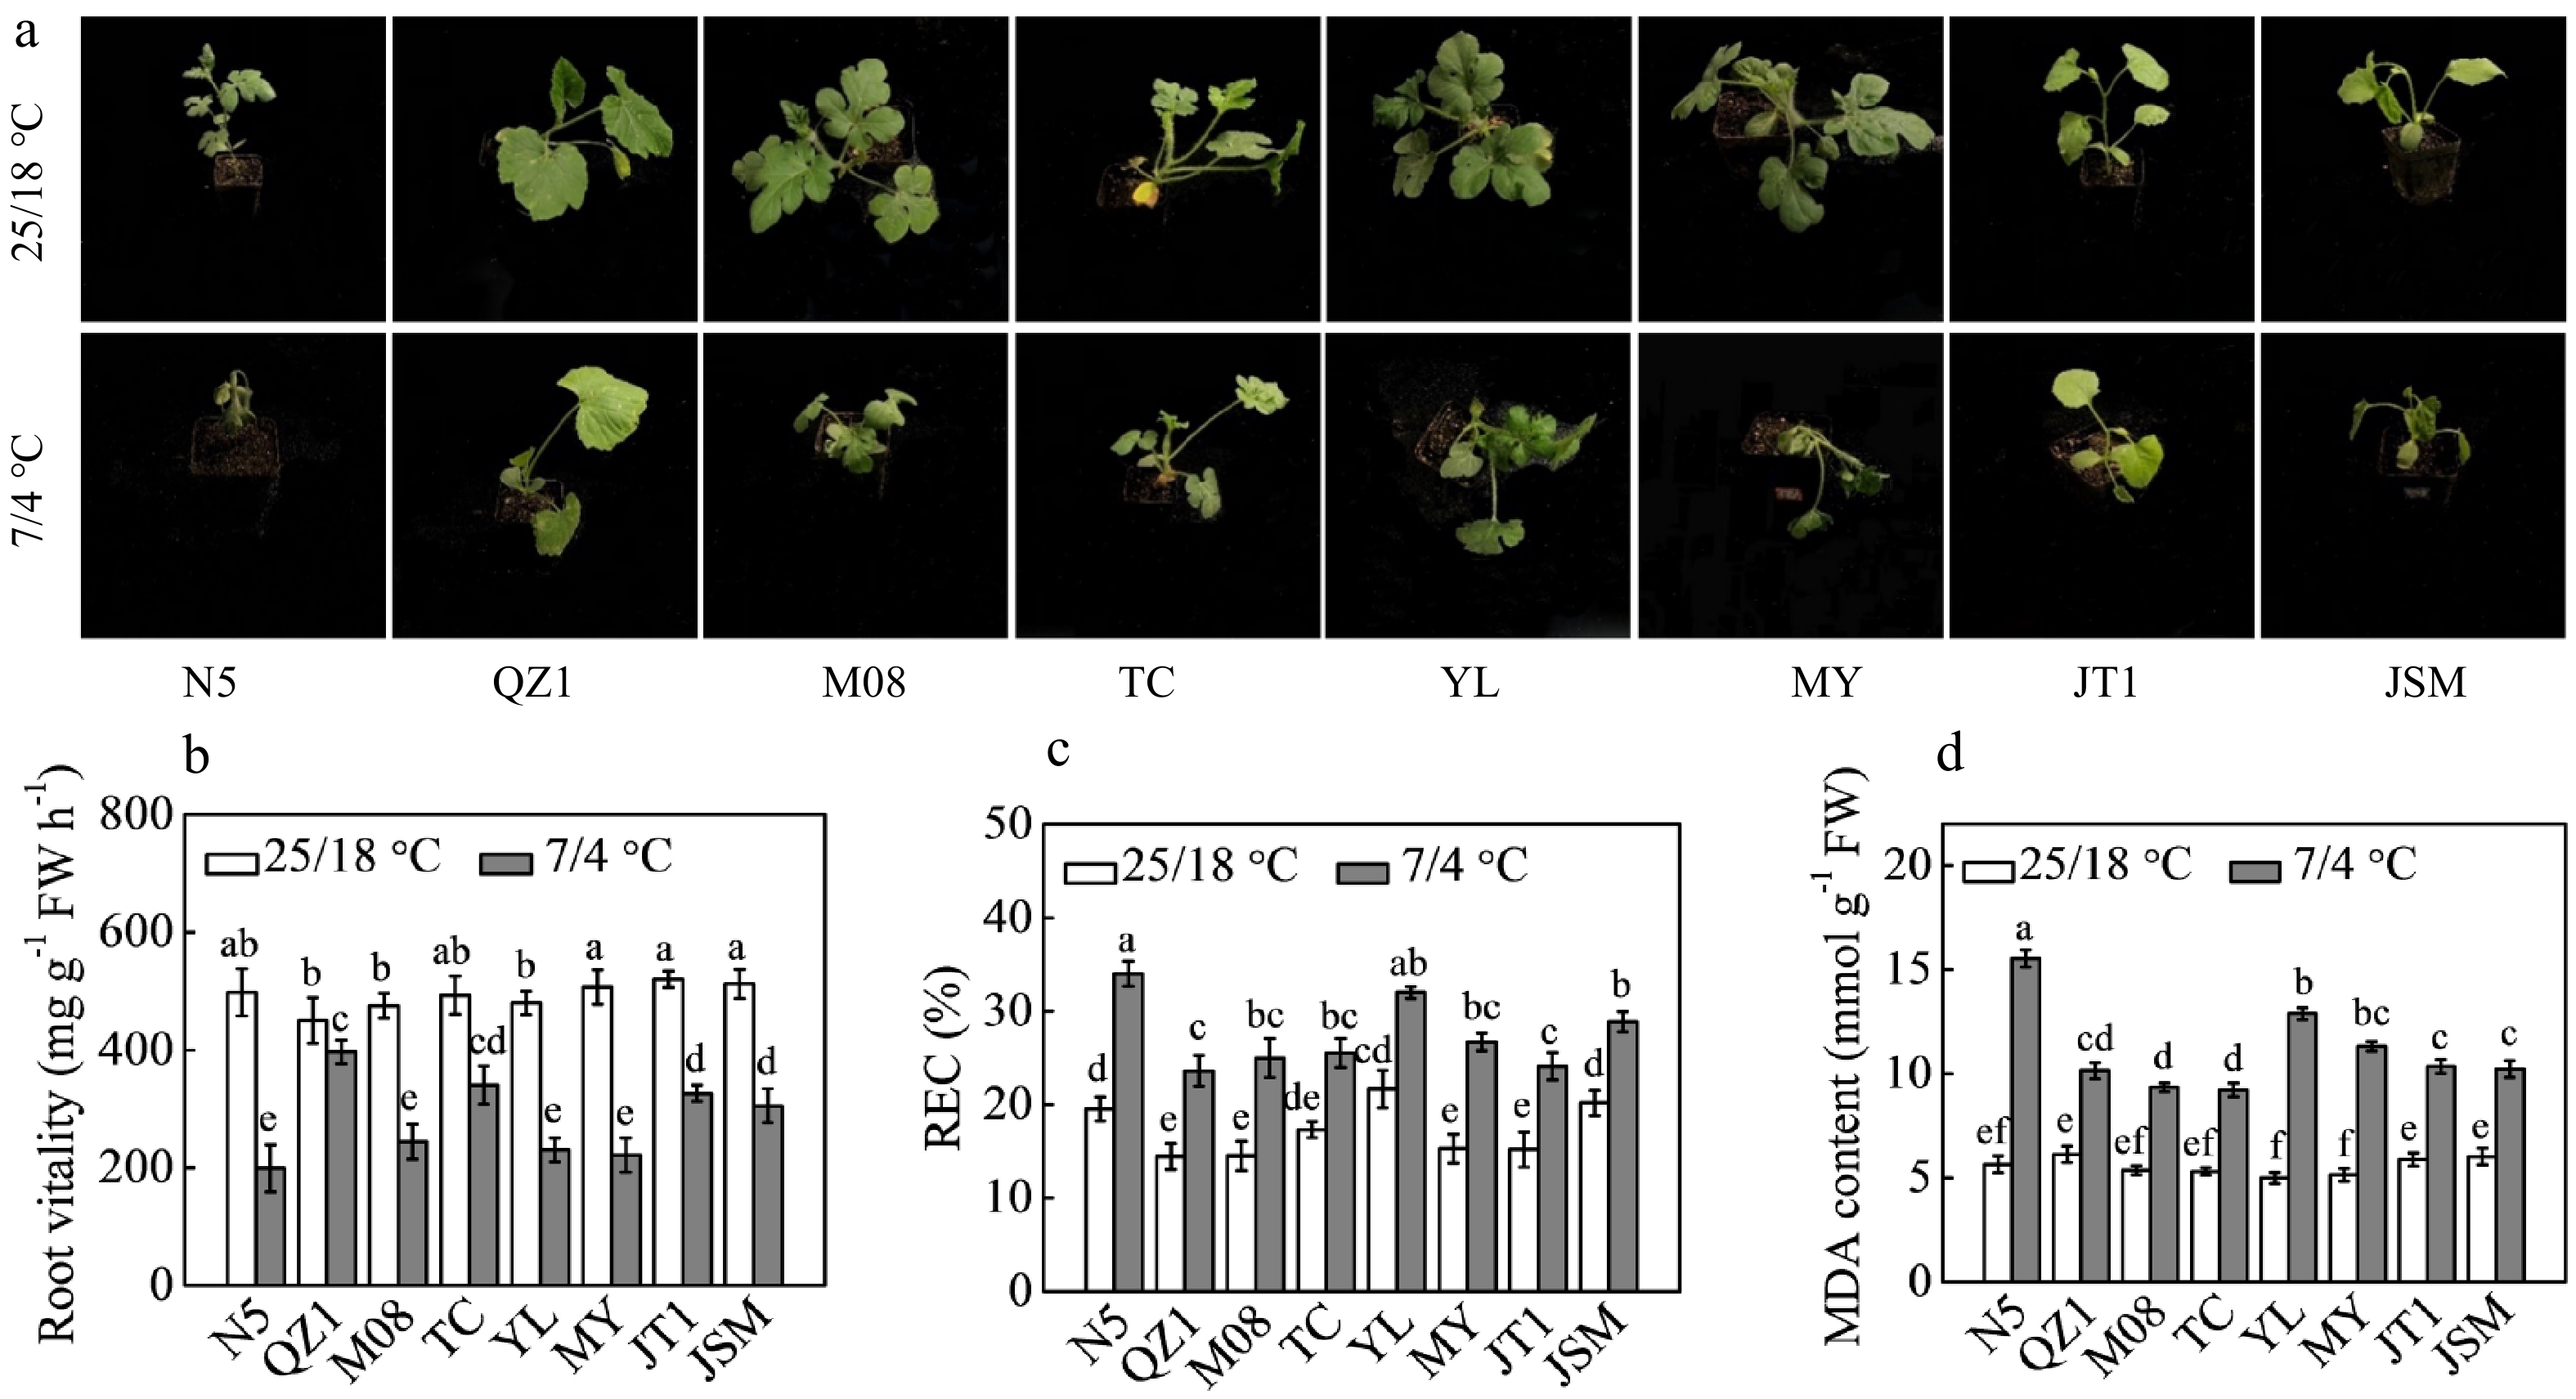
Figure 1.
Responses of eight different Cucurbit germplasms to chilling stress. (a) Plant phenotypes. (b) The maximum photochemical efficiency of PSII (Fv/Fm). (c) Relative electrical conductivity (REC). (d) Malonaldehyde (MDA) content in the eight Cucurbit germplasms. Seedlings at three- or four-leaf stage were transferred into growth chambers maintained at 25/18 °C (day/night) for the control groups or the 7/4 °C (day/night) for chilling treatment groups for 48 h. Data are presented as the means (± SDs) of three replicates. Different superscripts denote significant differences at P < 0.05.
-
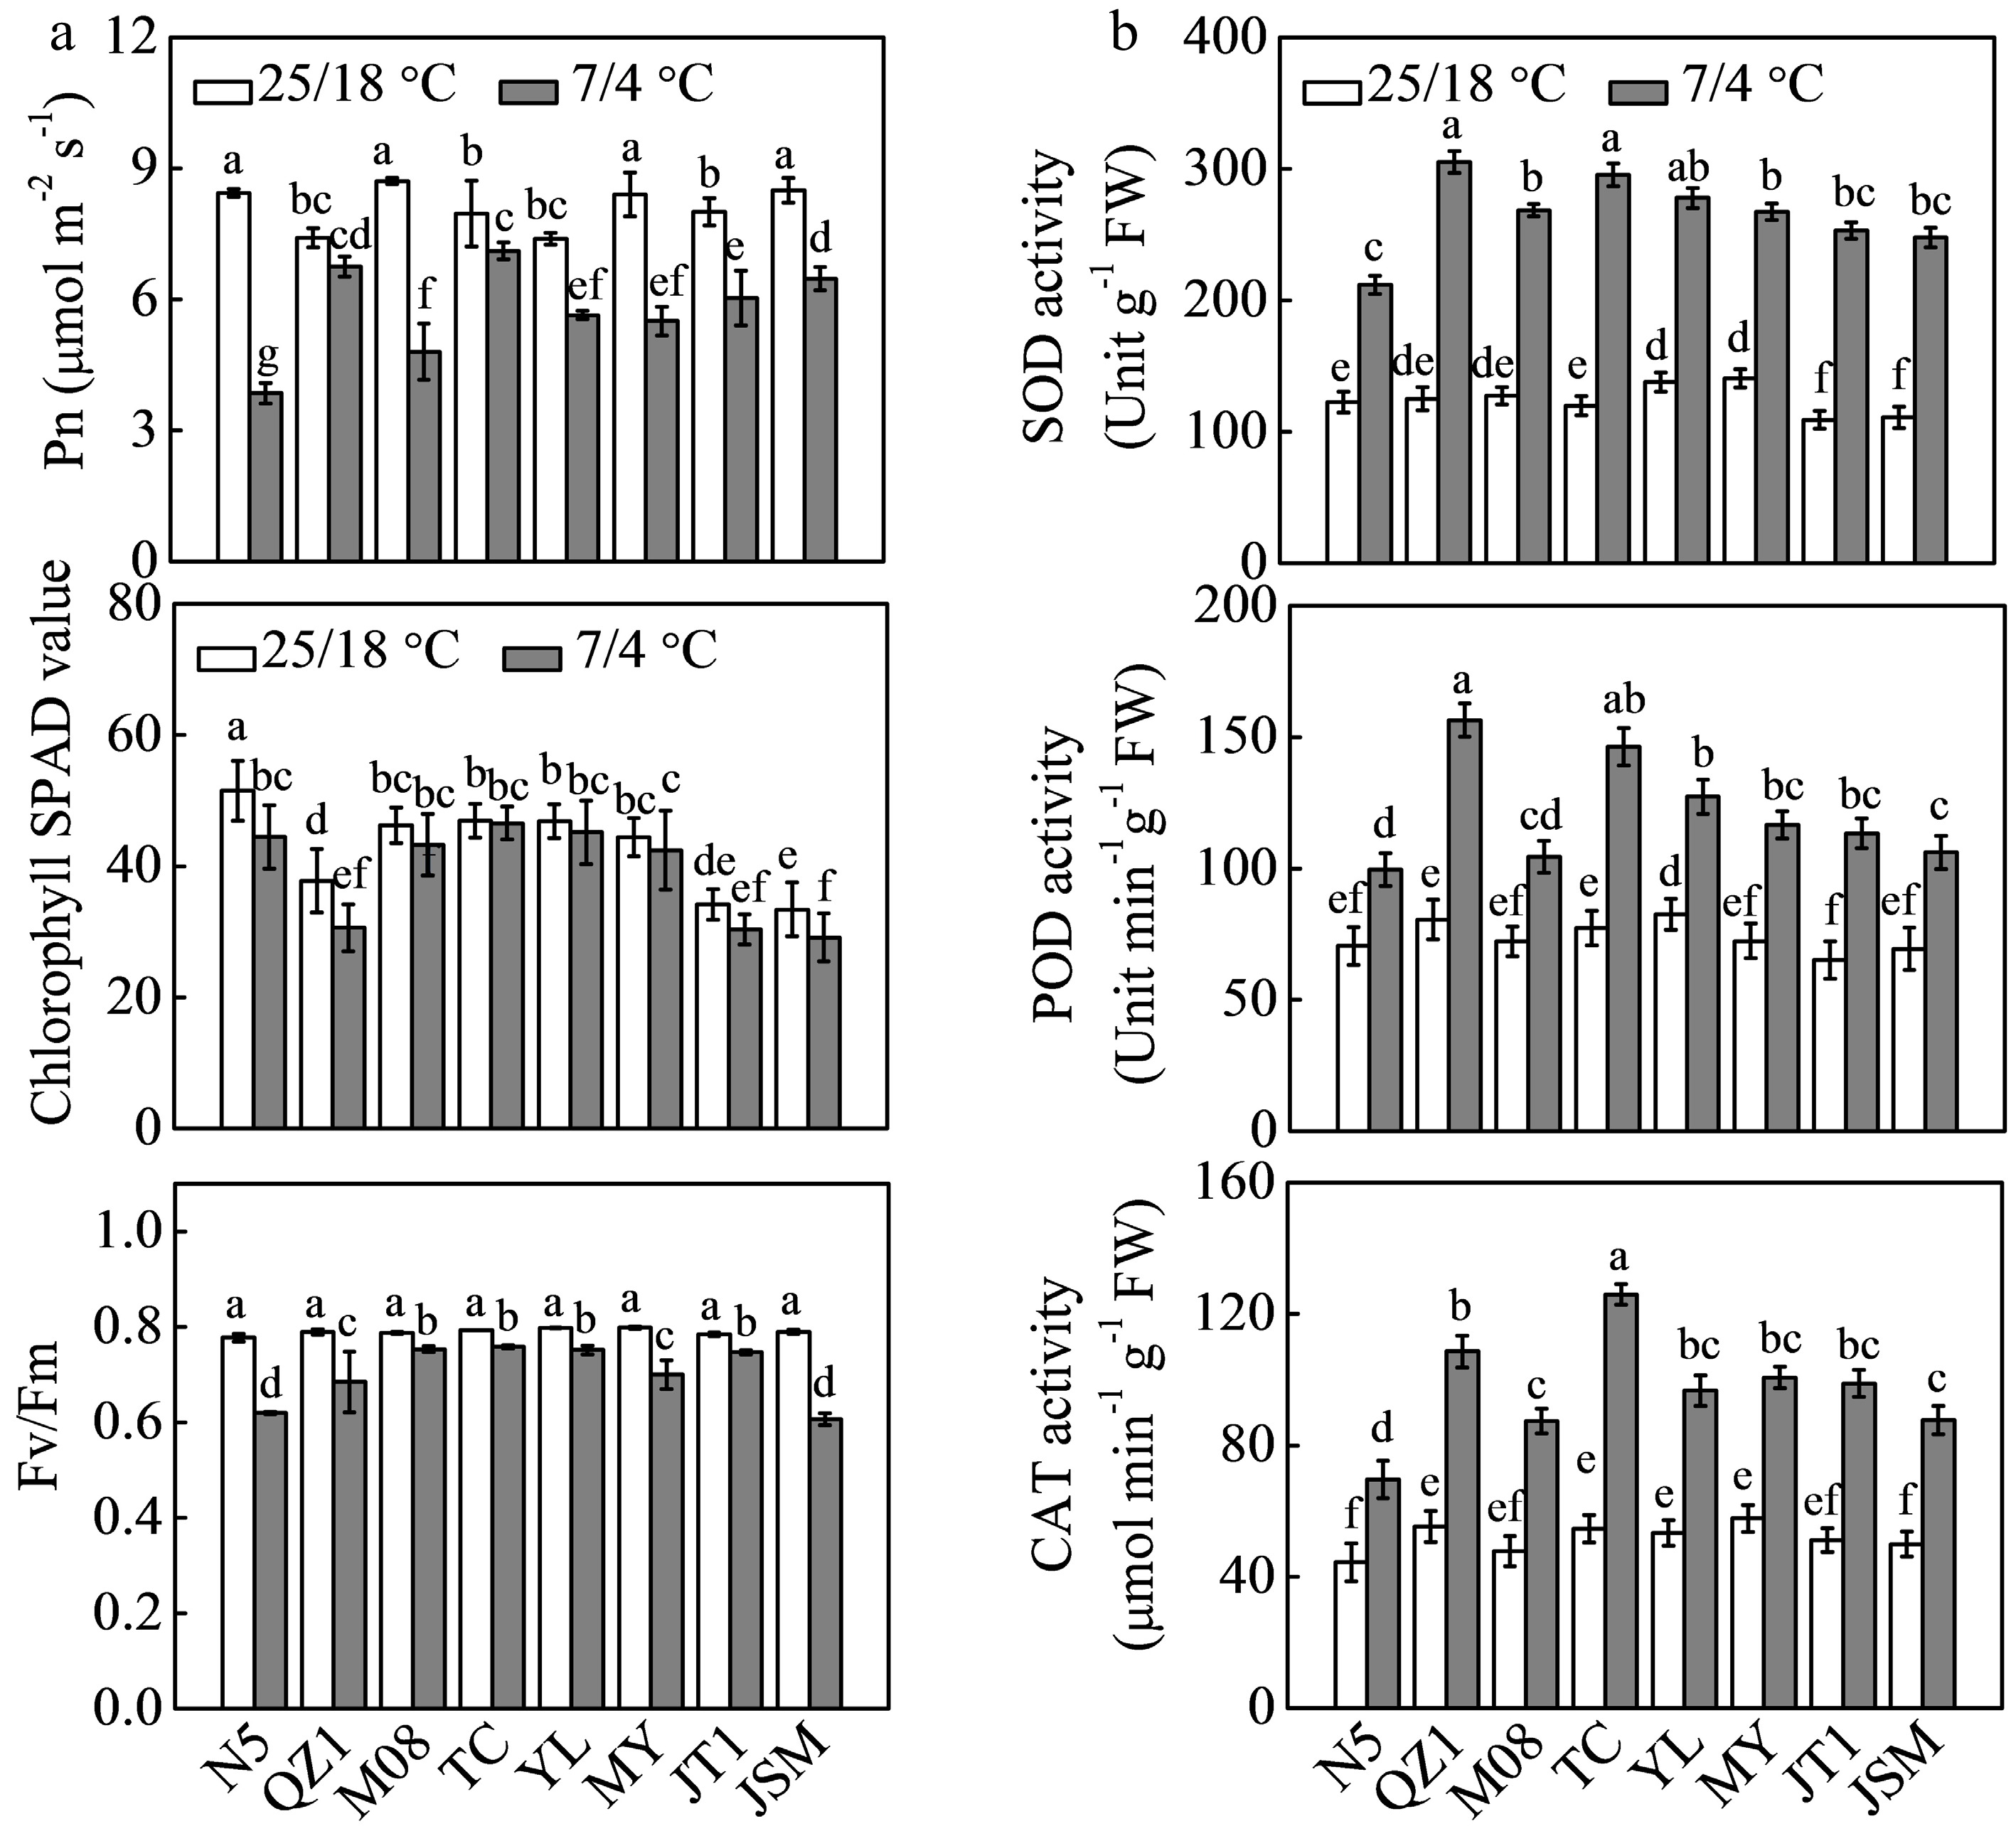
Figure 2.
Effects of chilling stress on (a) photosynthetic ability and (b) antioxidant enzyme activities in eight different Cucurbit germplasms. Seedlings received the same treatments as described in Fig. 1. Data are expressed as the means (±SDs) of three replicates. Different superscripts indicate significant differences at P < 0.05. Pn, net photosynthetic rate; Fv/Fm, maximum photochemical efficiency of PSII; SOD, superoxide dismutase; POD, peroxidase; CAT, catalase.
-
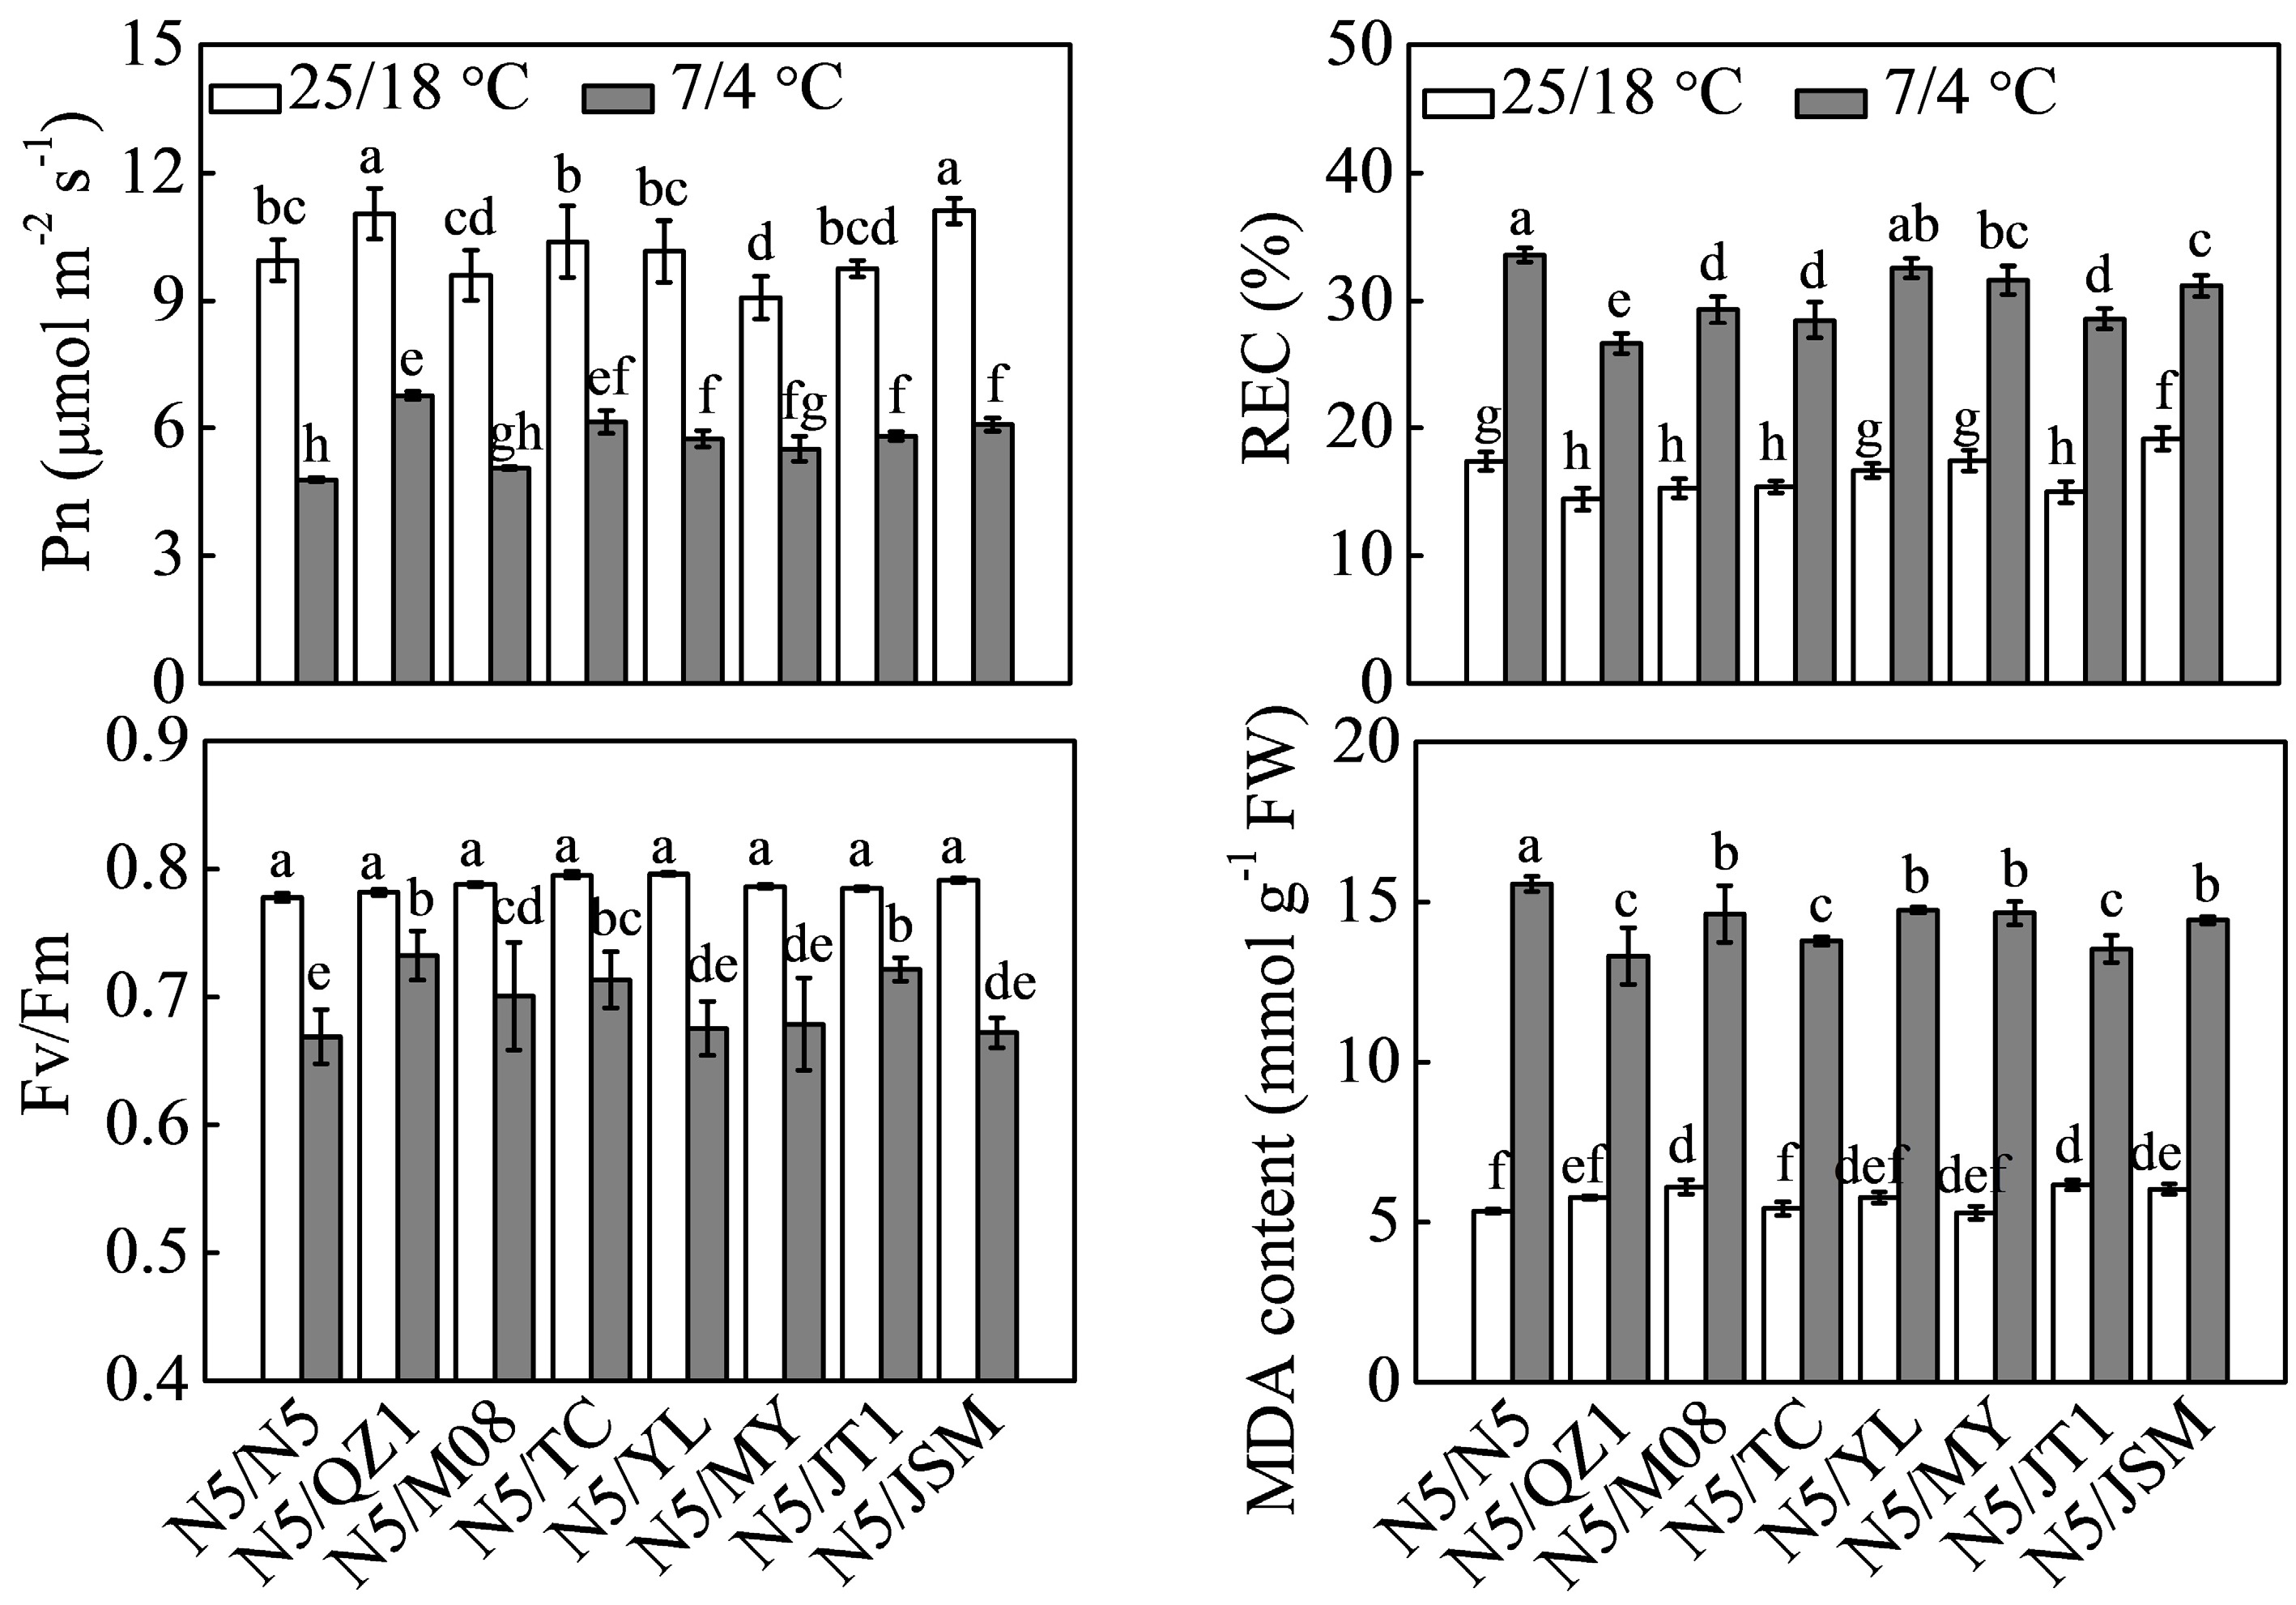
Figure 3.
Effects of different rootstocks on watermelon tolerance to chilling stress. Watermelon plants grafted onto watermelon, pumpkin, and muskmelon rootstocks were subjected to chilling at 7/4 °C (day/night) for 48 h. Different superscripts indicate significant differences at P < 0.05. Pn, net photosynthetic rate; Fv/Fm, maximum photochemical efficiency of PSII; REC, relative electrical conductivity; MDA, malonaldehyde.
-
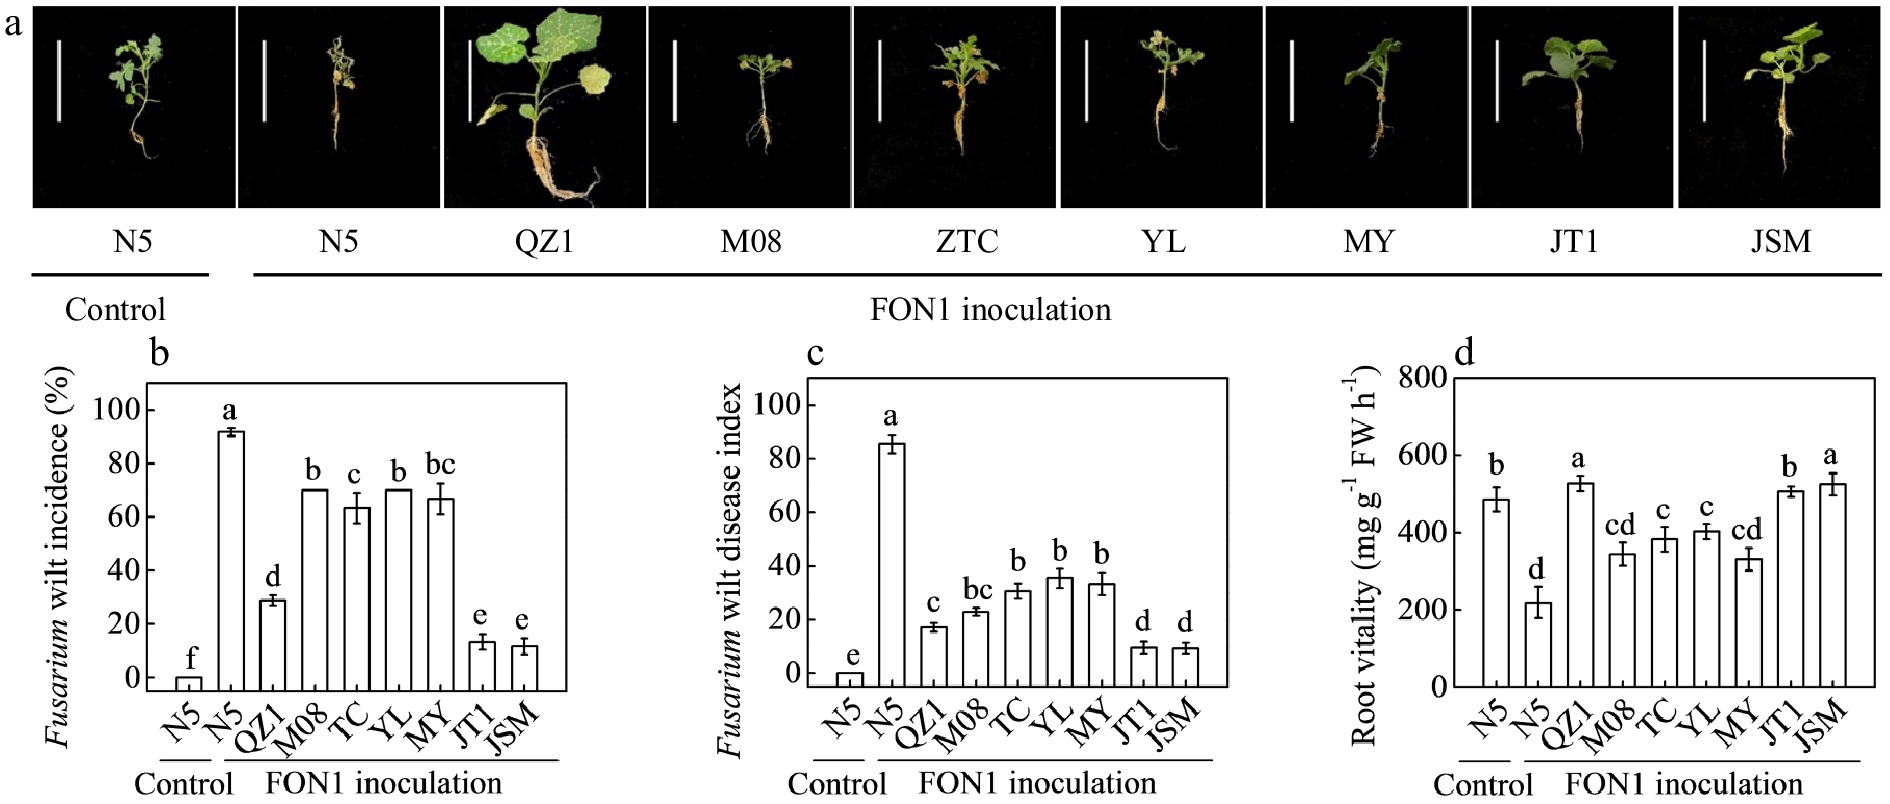
Figure 4.
Responses of eight different Cucurbit germplasms to artificial infection with Fusarium oxysporum f. sp. niveum race 1 (FON1). (a) Plant phenotypes. (b) Fusarium wilt incidence. (c) Fusarium disease index. (d) Root vitality. Seedlings at the two-leaf stage were infected with FON1 using a root-dipping method. Inoculated plants were replanted in sterile peat-based compost for 21 d. In (b−d), different superscripts denote significant differences at P < 0.05.
-
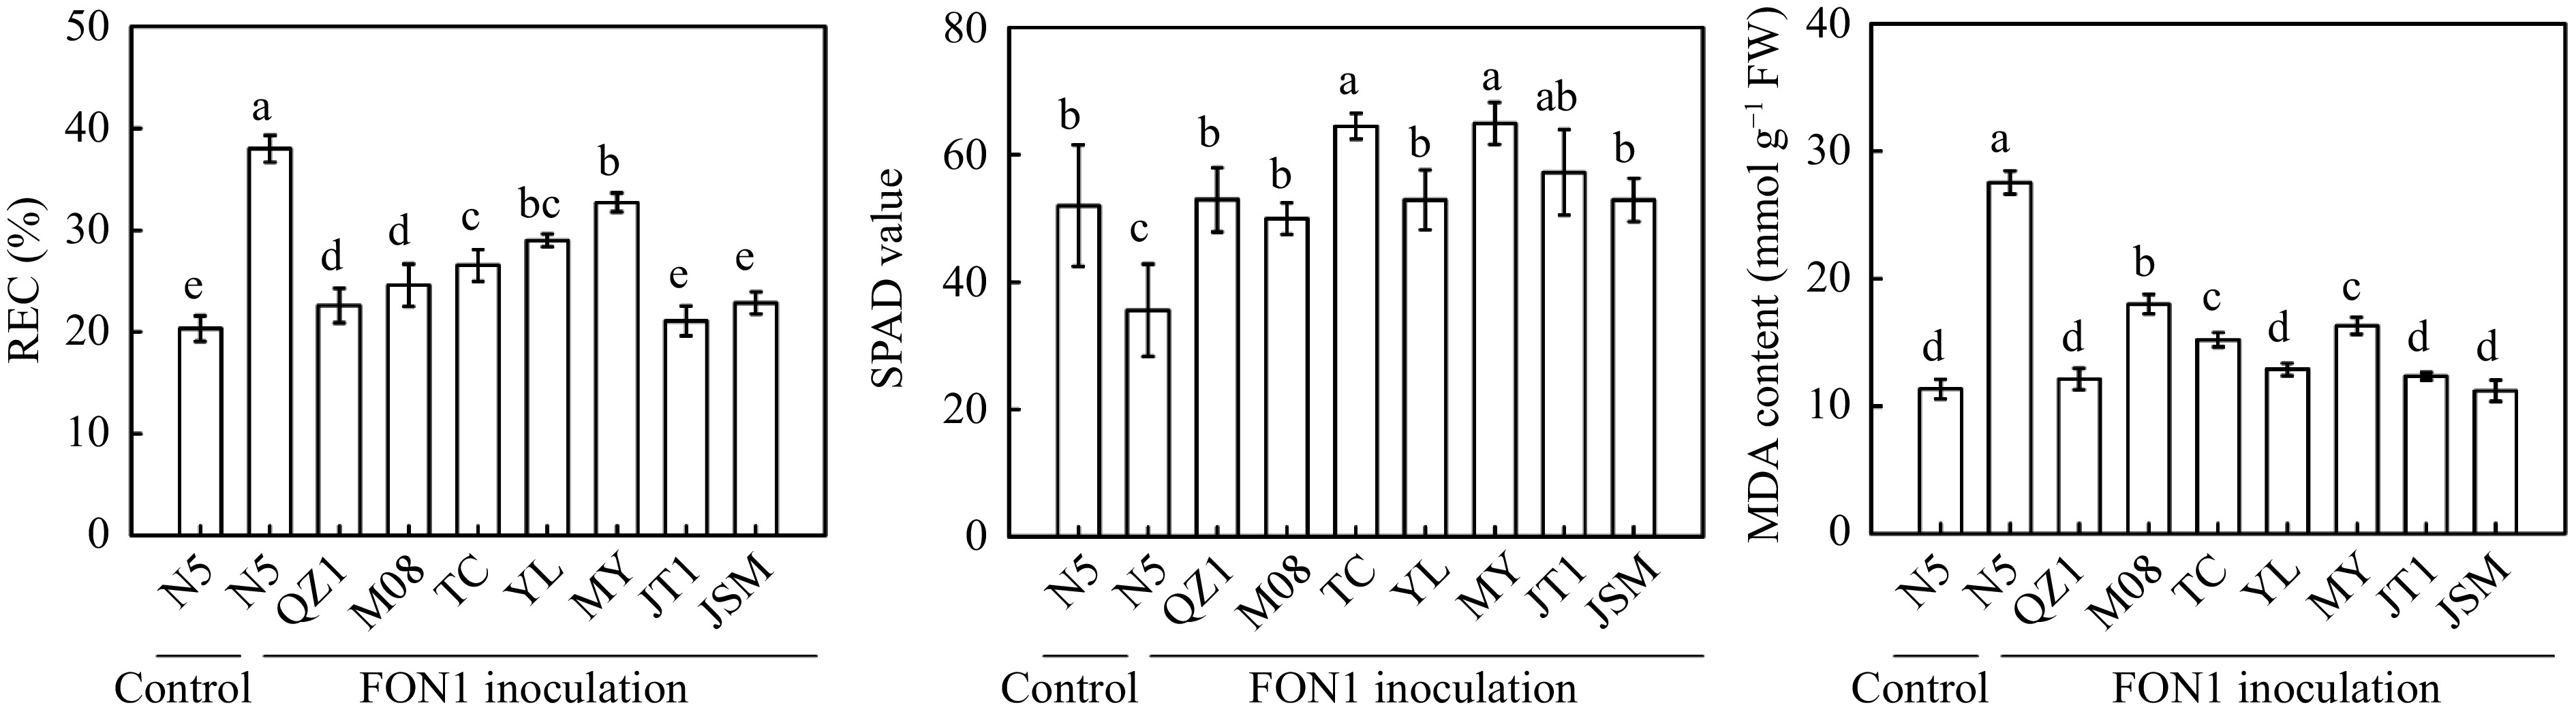
Figure 5.
Effects of artificial infection with Fusarium oxysporum f. sp. niveum race 1 (FON1) on the relative electrical conductivity (REC), chlorophyll SPAD value, and malonaldehyde (MDA) content in eight different grafted watermelons. Seedlings received the same treatments as described in Fig. 4. Data are expressed as the means (± SDs) of three replicates. Different superscripts denote significant differences at P < 0.05.
-
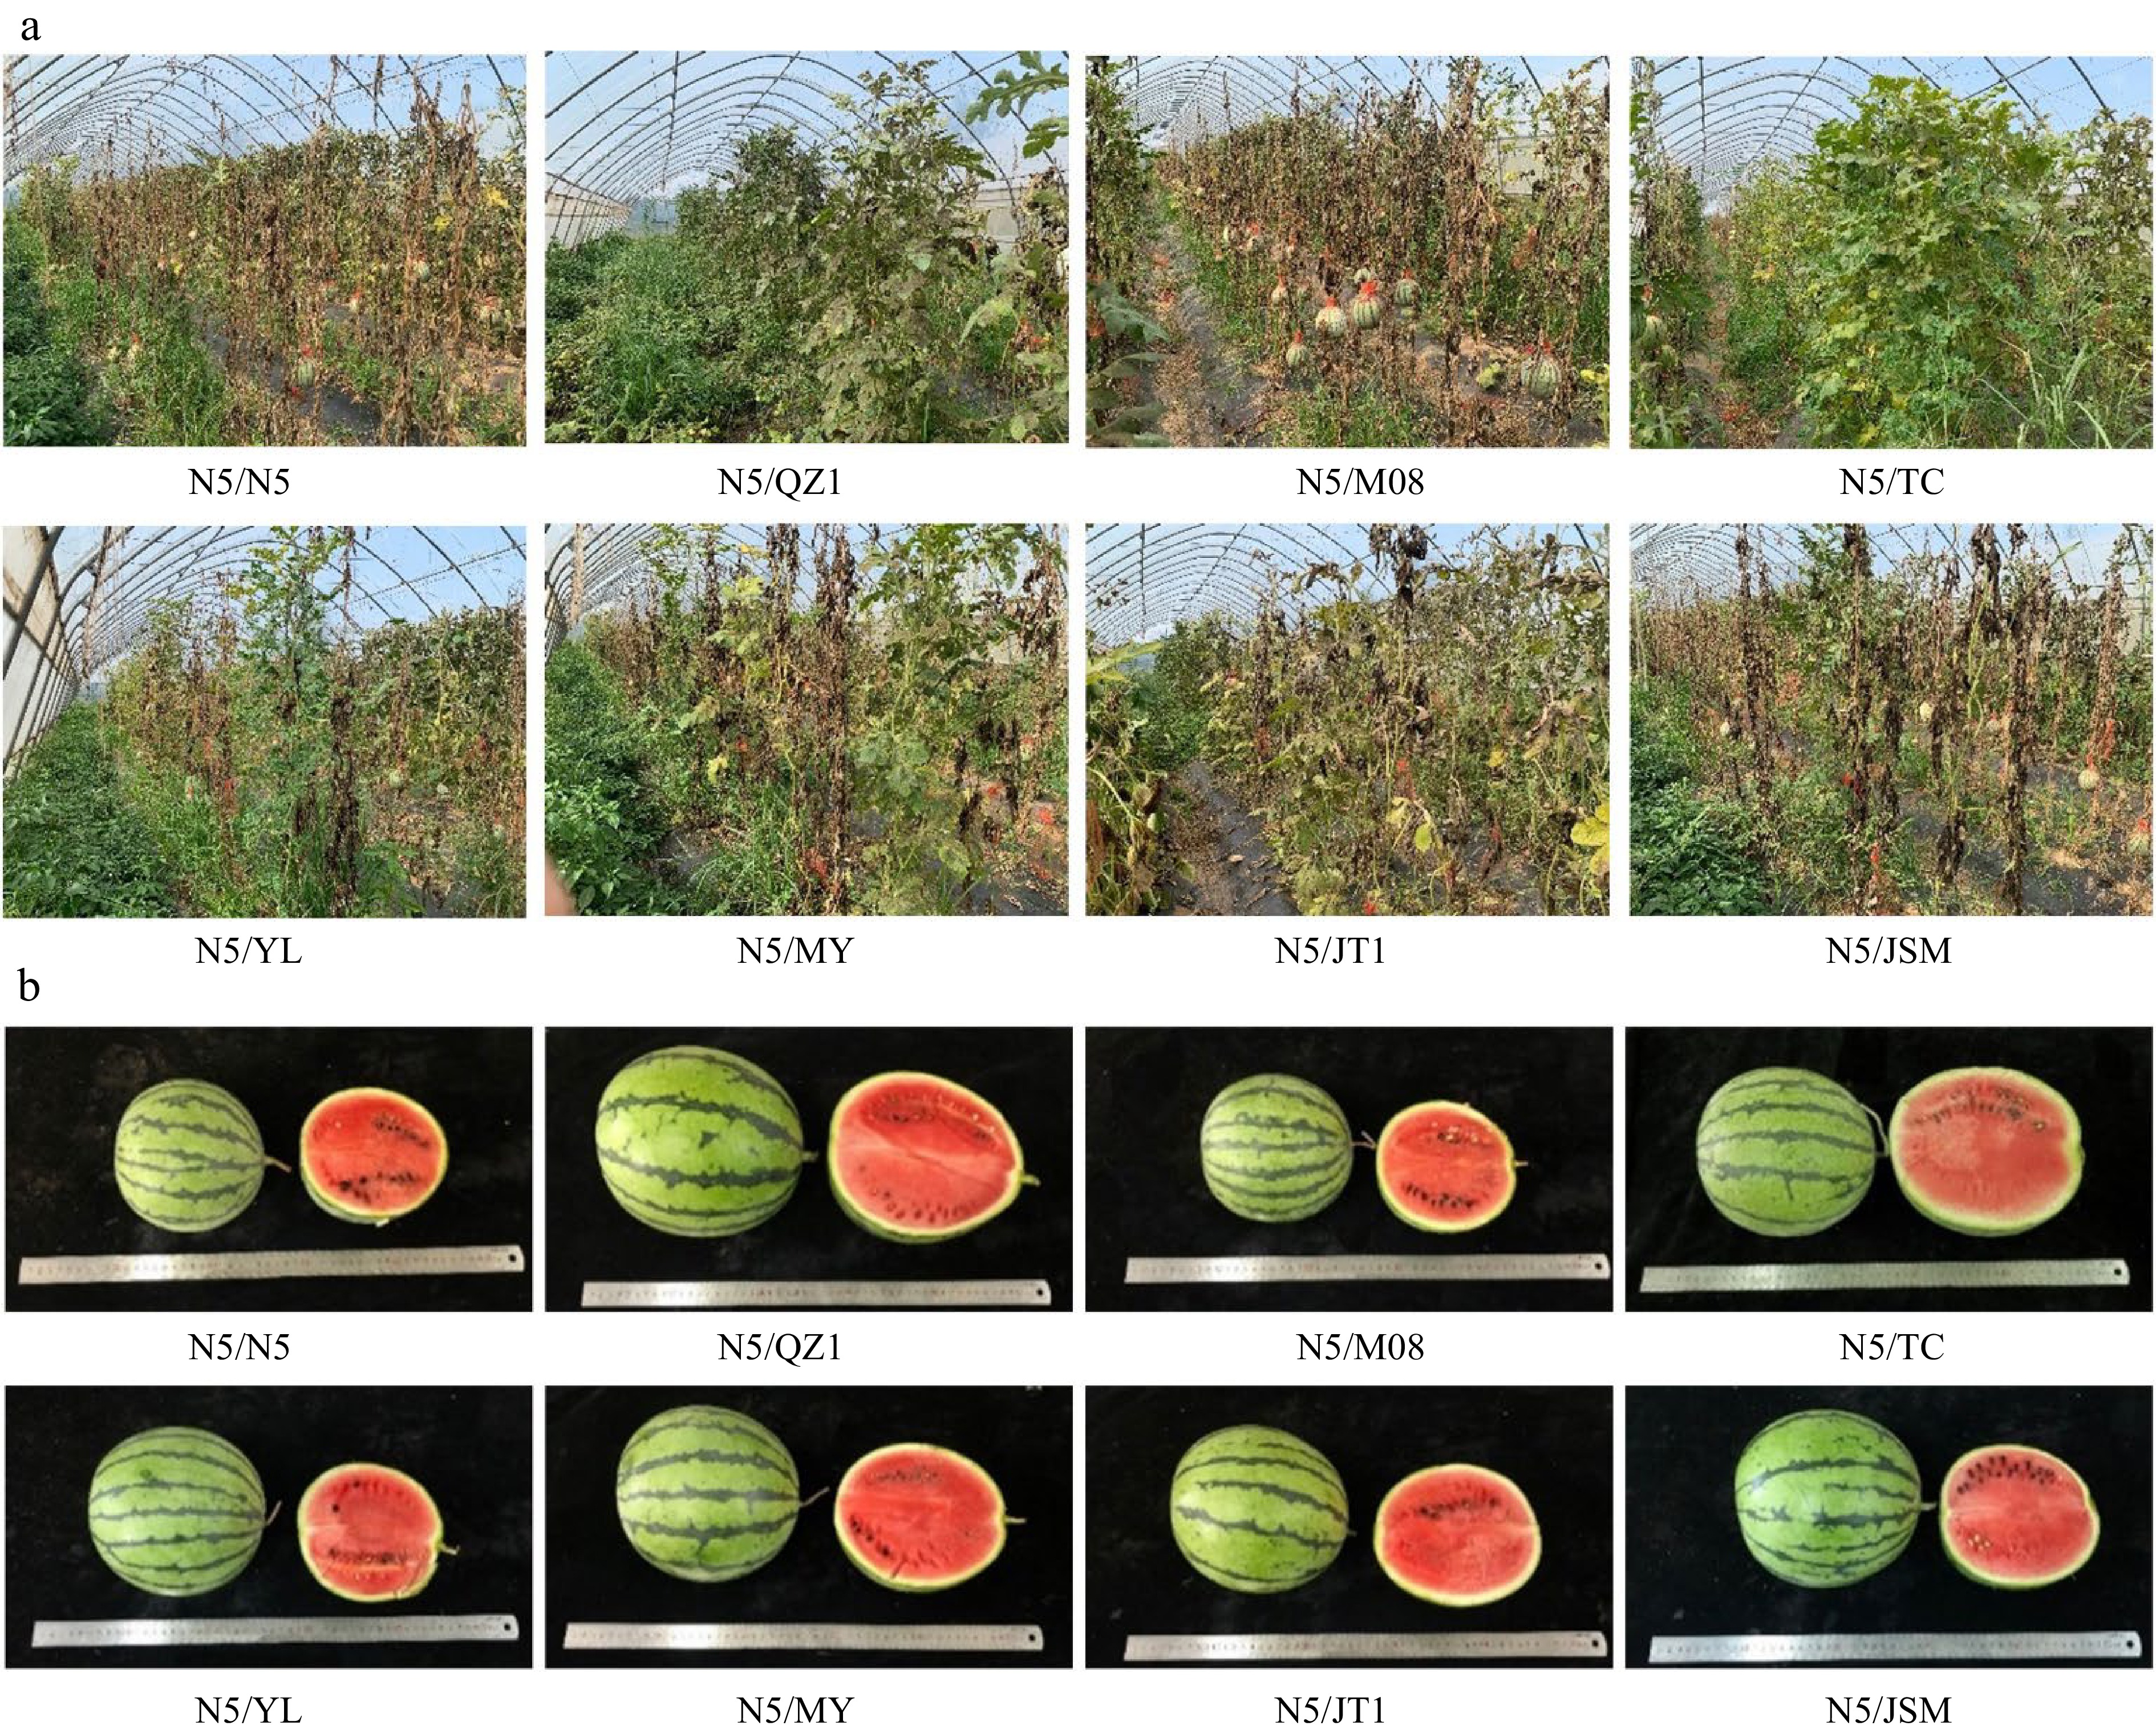
Figure 6.
(a) Plant growth and (b) fruit appearance and section plane of eight different grafted watermelons planted in greenhouses where watermelons were continuously mono-cropped for 11 years.
-
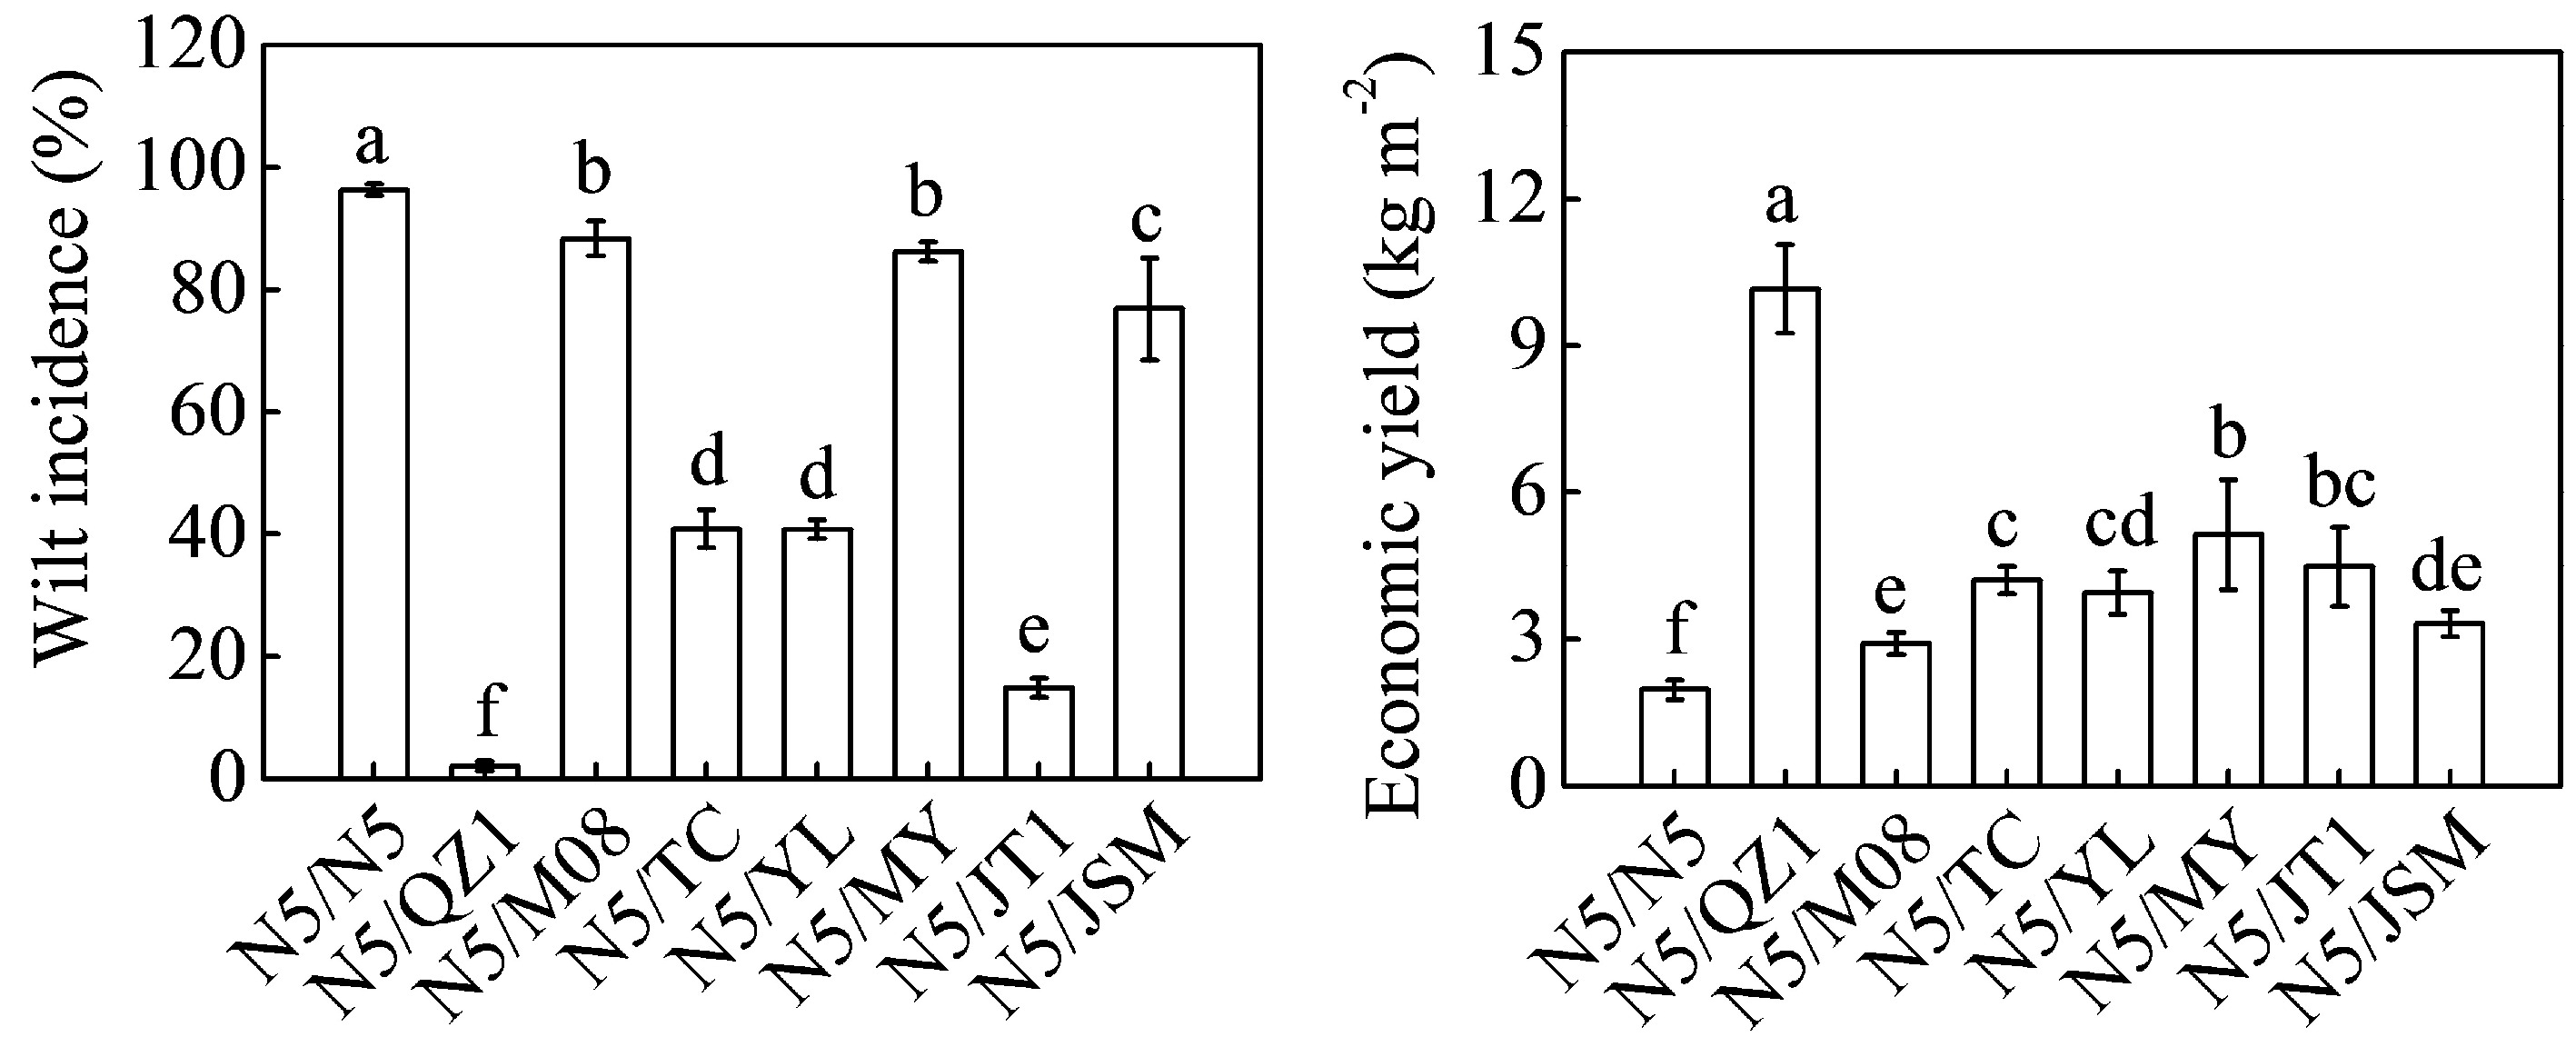
Figure 7.
Wilt incidence and economic yield of eight different grafted watermelons planted in greenhouses where watermelons were continuously mono-cropped for 11 years. Data are presented as the means (± SDs) of three replicates. Different superscripts denote significant differences at P < 0.05.
-
Item N5 QZ1 M08 TC YL MY JT1 JSM Pn 0.00 0.89 0.29 1.00 0.55 0.51 0.67 0.80 SPAD 0.68 0.22 0.76 1.00 0.92 0.77 0.00 0.02 REC 0.00 1.00 0.87 0.81 0.19 0.70 0.95 0.49 MDA 0.00 0.85 0.98 1.00 0.42 0.67 0.82 0.84 Root vitality 0.00 1.00 0.23 0.71 0.16 0.11 0.64 0.54 SOD 0.00 1.00 0.61 0.90 0.71 0.60 0.44 0.39 POD 0.00 1.00 0.09 0.82 0.49 0.30 0.24 0.12 CAT 0.00 0.69 0.31 1.00 0.48 0.55 0.52 0.32 Fv/Fm 0.09 0.53 0.96 1.00 0.95 0.62 0.91 0.00 Average value 0.09 0.80 0.57 0.92 0.54 0.54 0.58 0.39 Tolerance rank 8 2 4 1 6 5 3 7 Data in the table was calculated based on variation in indexes relative to the control samples. The variation percentage (VP, %) for each index was calculated using the following formula: VP (%) = (Tr − CK)/CK × 100%, where Tr represents the value for the given parameter and CK indicates the corresponding value in the control plants. Then, the membership function value of REC and MDA was calculated as 1 − (X − Xmin)/(Xmax − Xmin), whereas that of the other physiological indicators was calculated as (X − Xmin)/(Xmax − Xmin). Table 1.
Membership function values of eight materials based on relative change rate of growth and physiological indices.
-
Grafted plants Central soluble
solid (%)Marginal soluble
solid (%)Reducing sugar
(mg g−1)Lycopene
(mg g−1)Vitamin C
(μg g−1)Soluble protein
(mg g−1)Organic acid
(%)N5/N5 9.47 ± 0.19a 7.51 ± 0.25a 9.6 ± 1.87ab 1.53 ± 0.82ab 3.43 ± 1.06e 0.28 ± 0.07ab 0.12 ± 0.01b N5/QZ1 8.93 ± 0.36b 7.04 ± 0.14ab 8.08 ± 2.26b 0.97 ± 0.14b 4.88 ± 1.12de 0.25 ± 0.04bc 0.12 ± 0.03b N5/M08 9.64 ± 0.60ab 7.80 ± 0.22a 11.21 ± 2.25ab 1.44 ± 0.06ab 8.97 ± 0.97bc 0.33 ± 0.05ab 0.13 ± 0.01b N5/TC 10.11 ± 0.32ac 8.04 ± 0.17a 14.64 ± 4.46ab 1.25 ± 0.20ab 7.74 ± 0.57c 0.41 ± 0.10a 0.11 ± 0.01b N5/YL 9.84 ± 0.17a 7.09 ± 0.23ab 8.66 ± 1.24b 1.03 ± 0.16b 2.93 ± 0.64e 0.12 ± 0.05cd 0.12 ± 0.01b N5/MY 8.89 ± 0.46b 6.36 ± 0.95bb 12.81 ± 1.90ab 1.36 ± 0.23ab 5.84 ± 0.41d 0.25 ± 0.07bc 0.16 ± 0.02a N5/JT1 8.93 ± 0.22b 6.29 ± 0.39b 8.59 ± 4.20b 1.05 ± 0.03b 10.03 ± 1.46b 0.32 ± 0.12ab 0.13 ± 0.03b N5/JSM 8.13 ± 0.09c 6.18 ± 0.17b 11.36 ± 0.82ab 1.66 ± 0.00a 13.62 ± 1.27a 0.08 ± 0.05d 0.14 ± 0.00ab Table 2.
Fruit quality of eight different grafted watermelons planted in greenhouses where watermelons were continuously mono-cropped for 11 years.
-
Grafted
plantsCentral
soluble solidMarginal
soluble solidReducing
sugarLycopene Vitamin C Soluble
proteinOrganic
acidAverage
valueQuality
rankN5/N5 0.68 0.72 0.23 0.81 0.05 0.61 0.94 0.60 3 N5/QZ1 0.40 0.46 0.00 0.00 0.18 0.52 0.80 0.35 8 N5/M08 0.76 0.87 0.48 0.68 0.57 0.78 0.63 0.66 2 N5/TC 1.00 1.00 1.00 0.41 0.45 1.00 1.00 0.71 1 N5/YL 0.86 0.49 0.09 0.08 0.00 0.11 0.91 0.34 6 N5/MY 0.38 0.10 0.72 0.56 0.27 0.50 0.00 0.52 7 N5/JT1 0.40 0.06 0.08 0.11 0.66 0.72 0.64 0.44 5 N5/JSM 0.00 0.00 0.50 1.00 1.00 0.00 0.52 0.51 4 Data in the table was calculated based on variation in indexes relative to the control samples. The variation percentage (VP, %) for each index was calculated using the following formula: VP (%) = (Tr − CK)/CK × 100%, where Tr represents the value for the given parameter and CK indicates the corresponding value in the control plants. Then, the membership function value of organic acid content was calculated as 1 − (X − Xmin)/(Xmax − Xmin), whereas that of the other physiological indicators was calculated as (X − Xmin)/(Xmax − Xmin). Table 3.
Membership function values of eight different grafted watermelons based on the relative change rate of fruit quality indices.
Figures
(7)
Tables
(3)