-
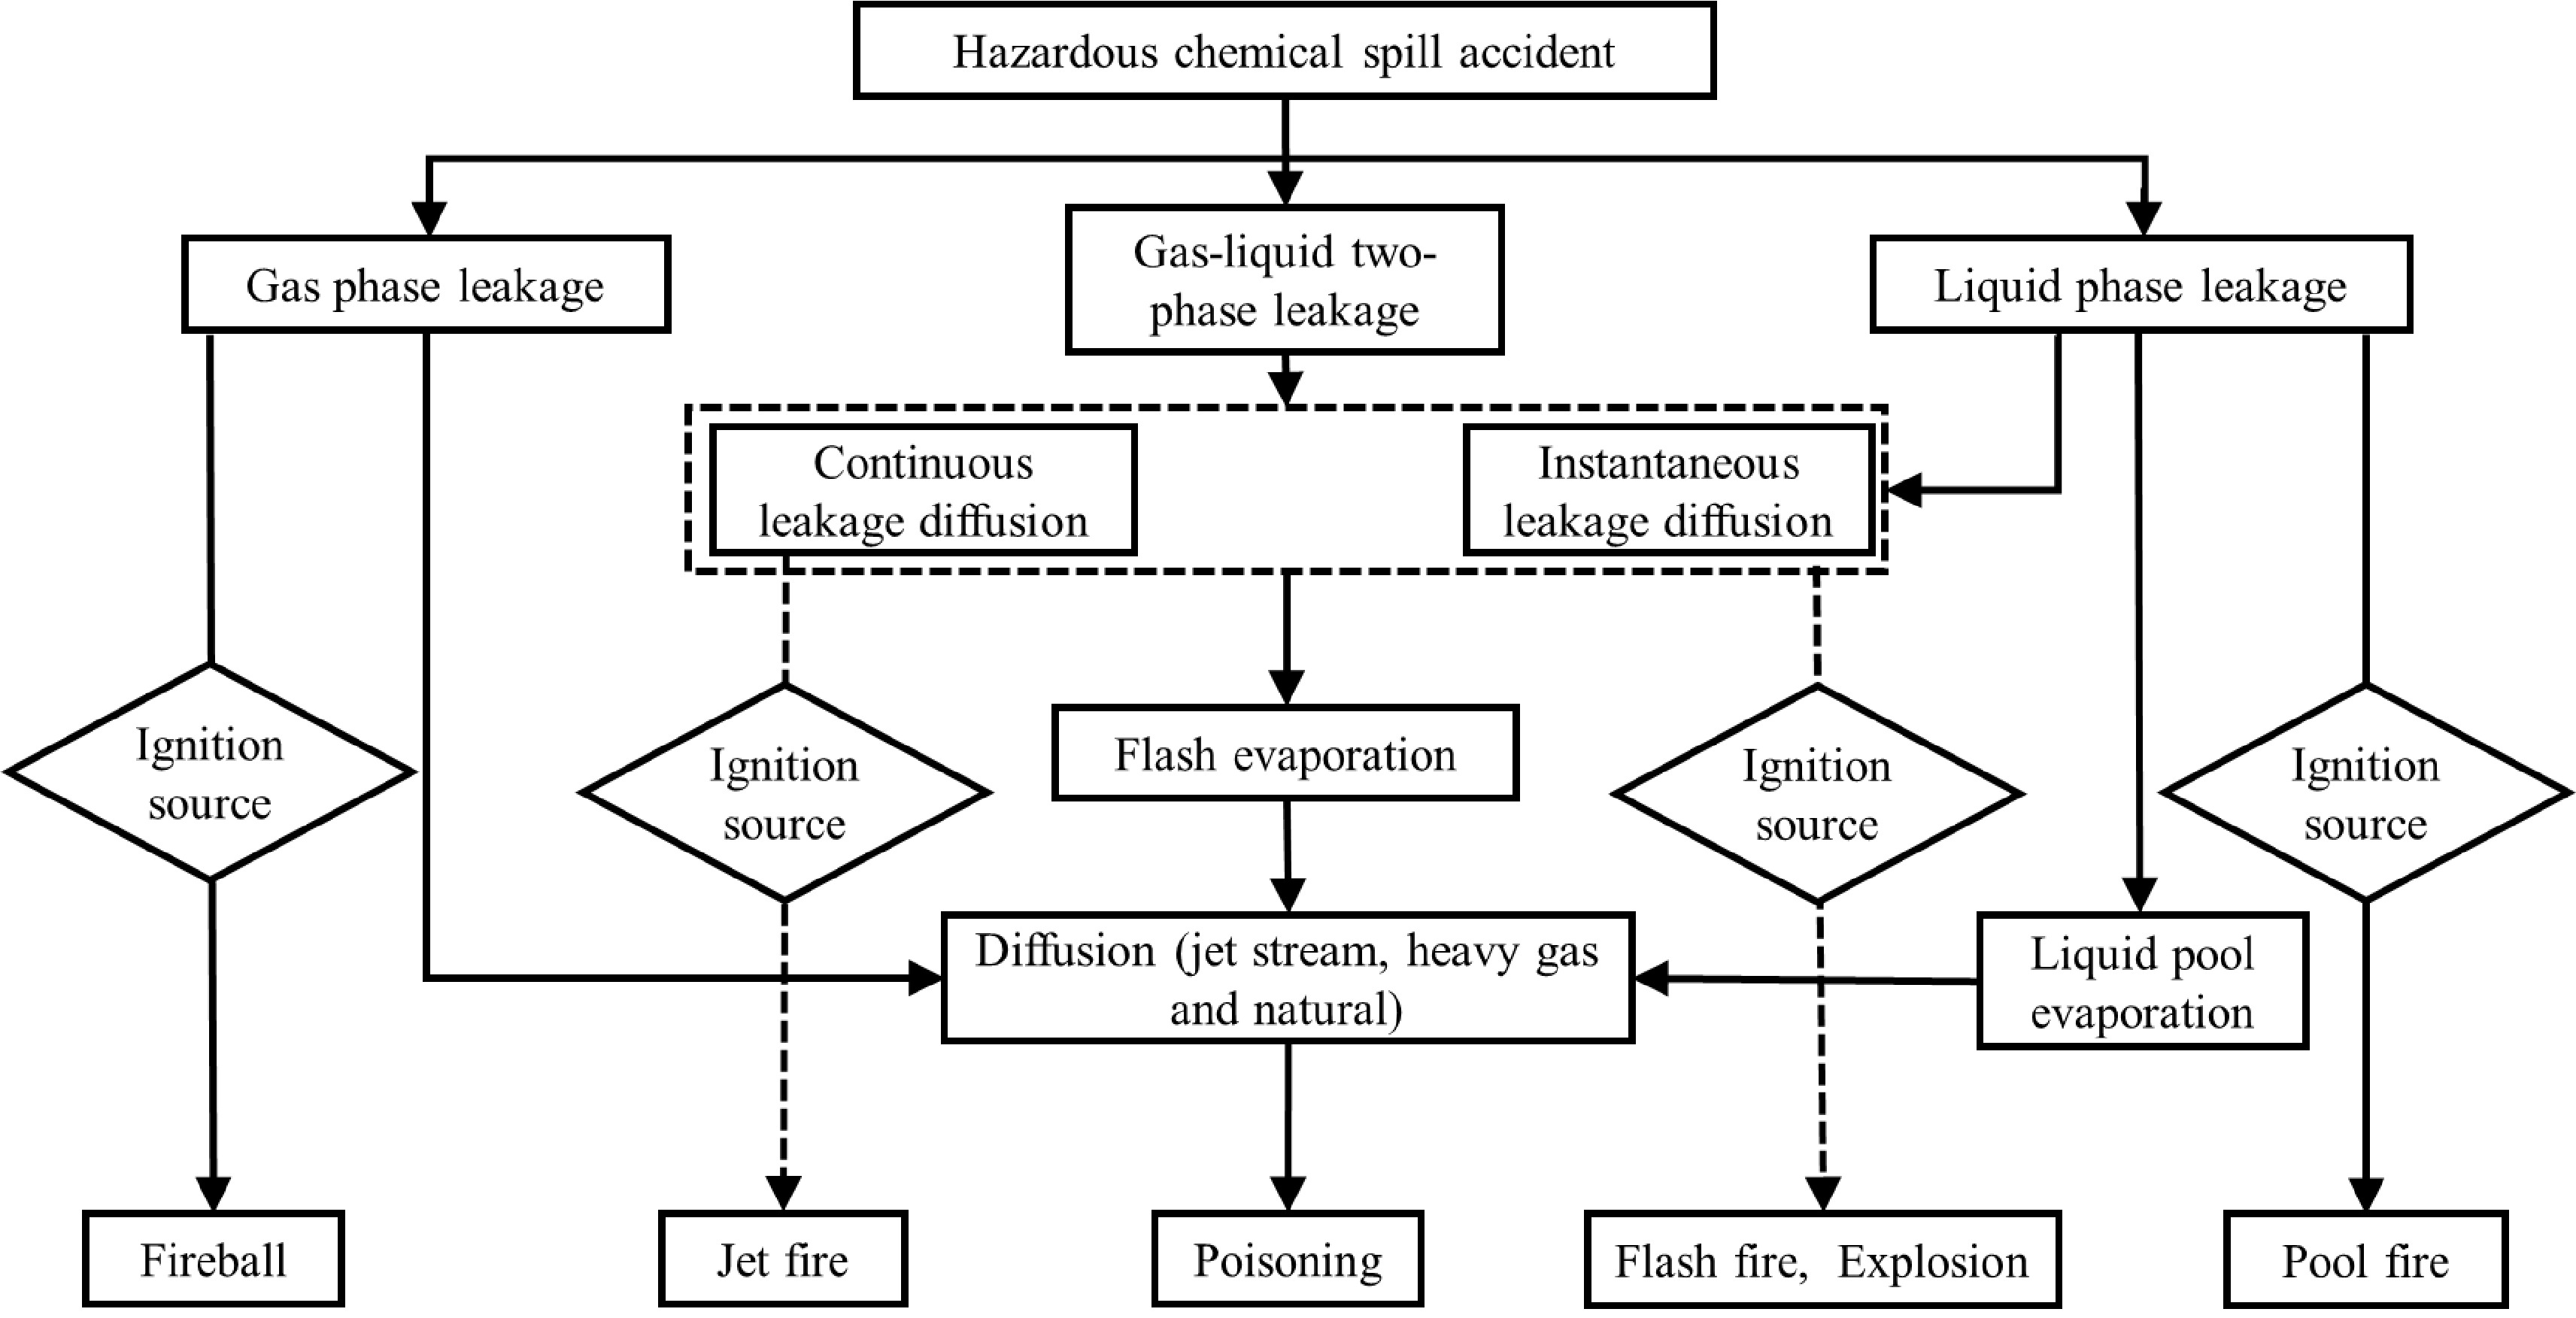
Figure 1.
Analysis of hazardous chemical accidents and their outcomes.
-
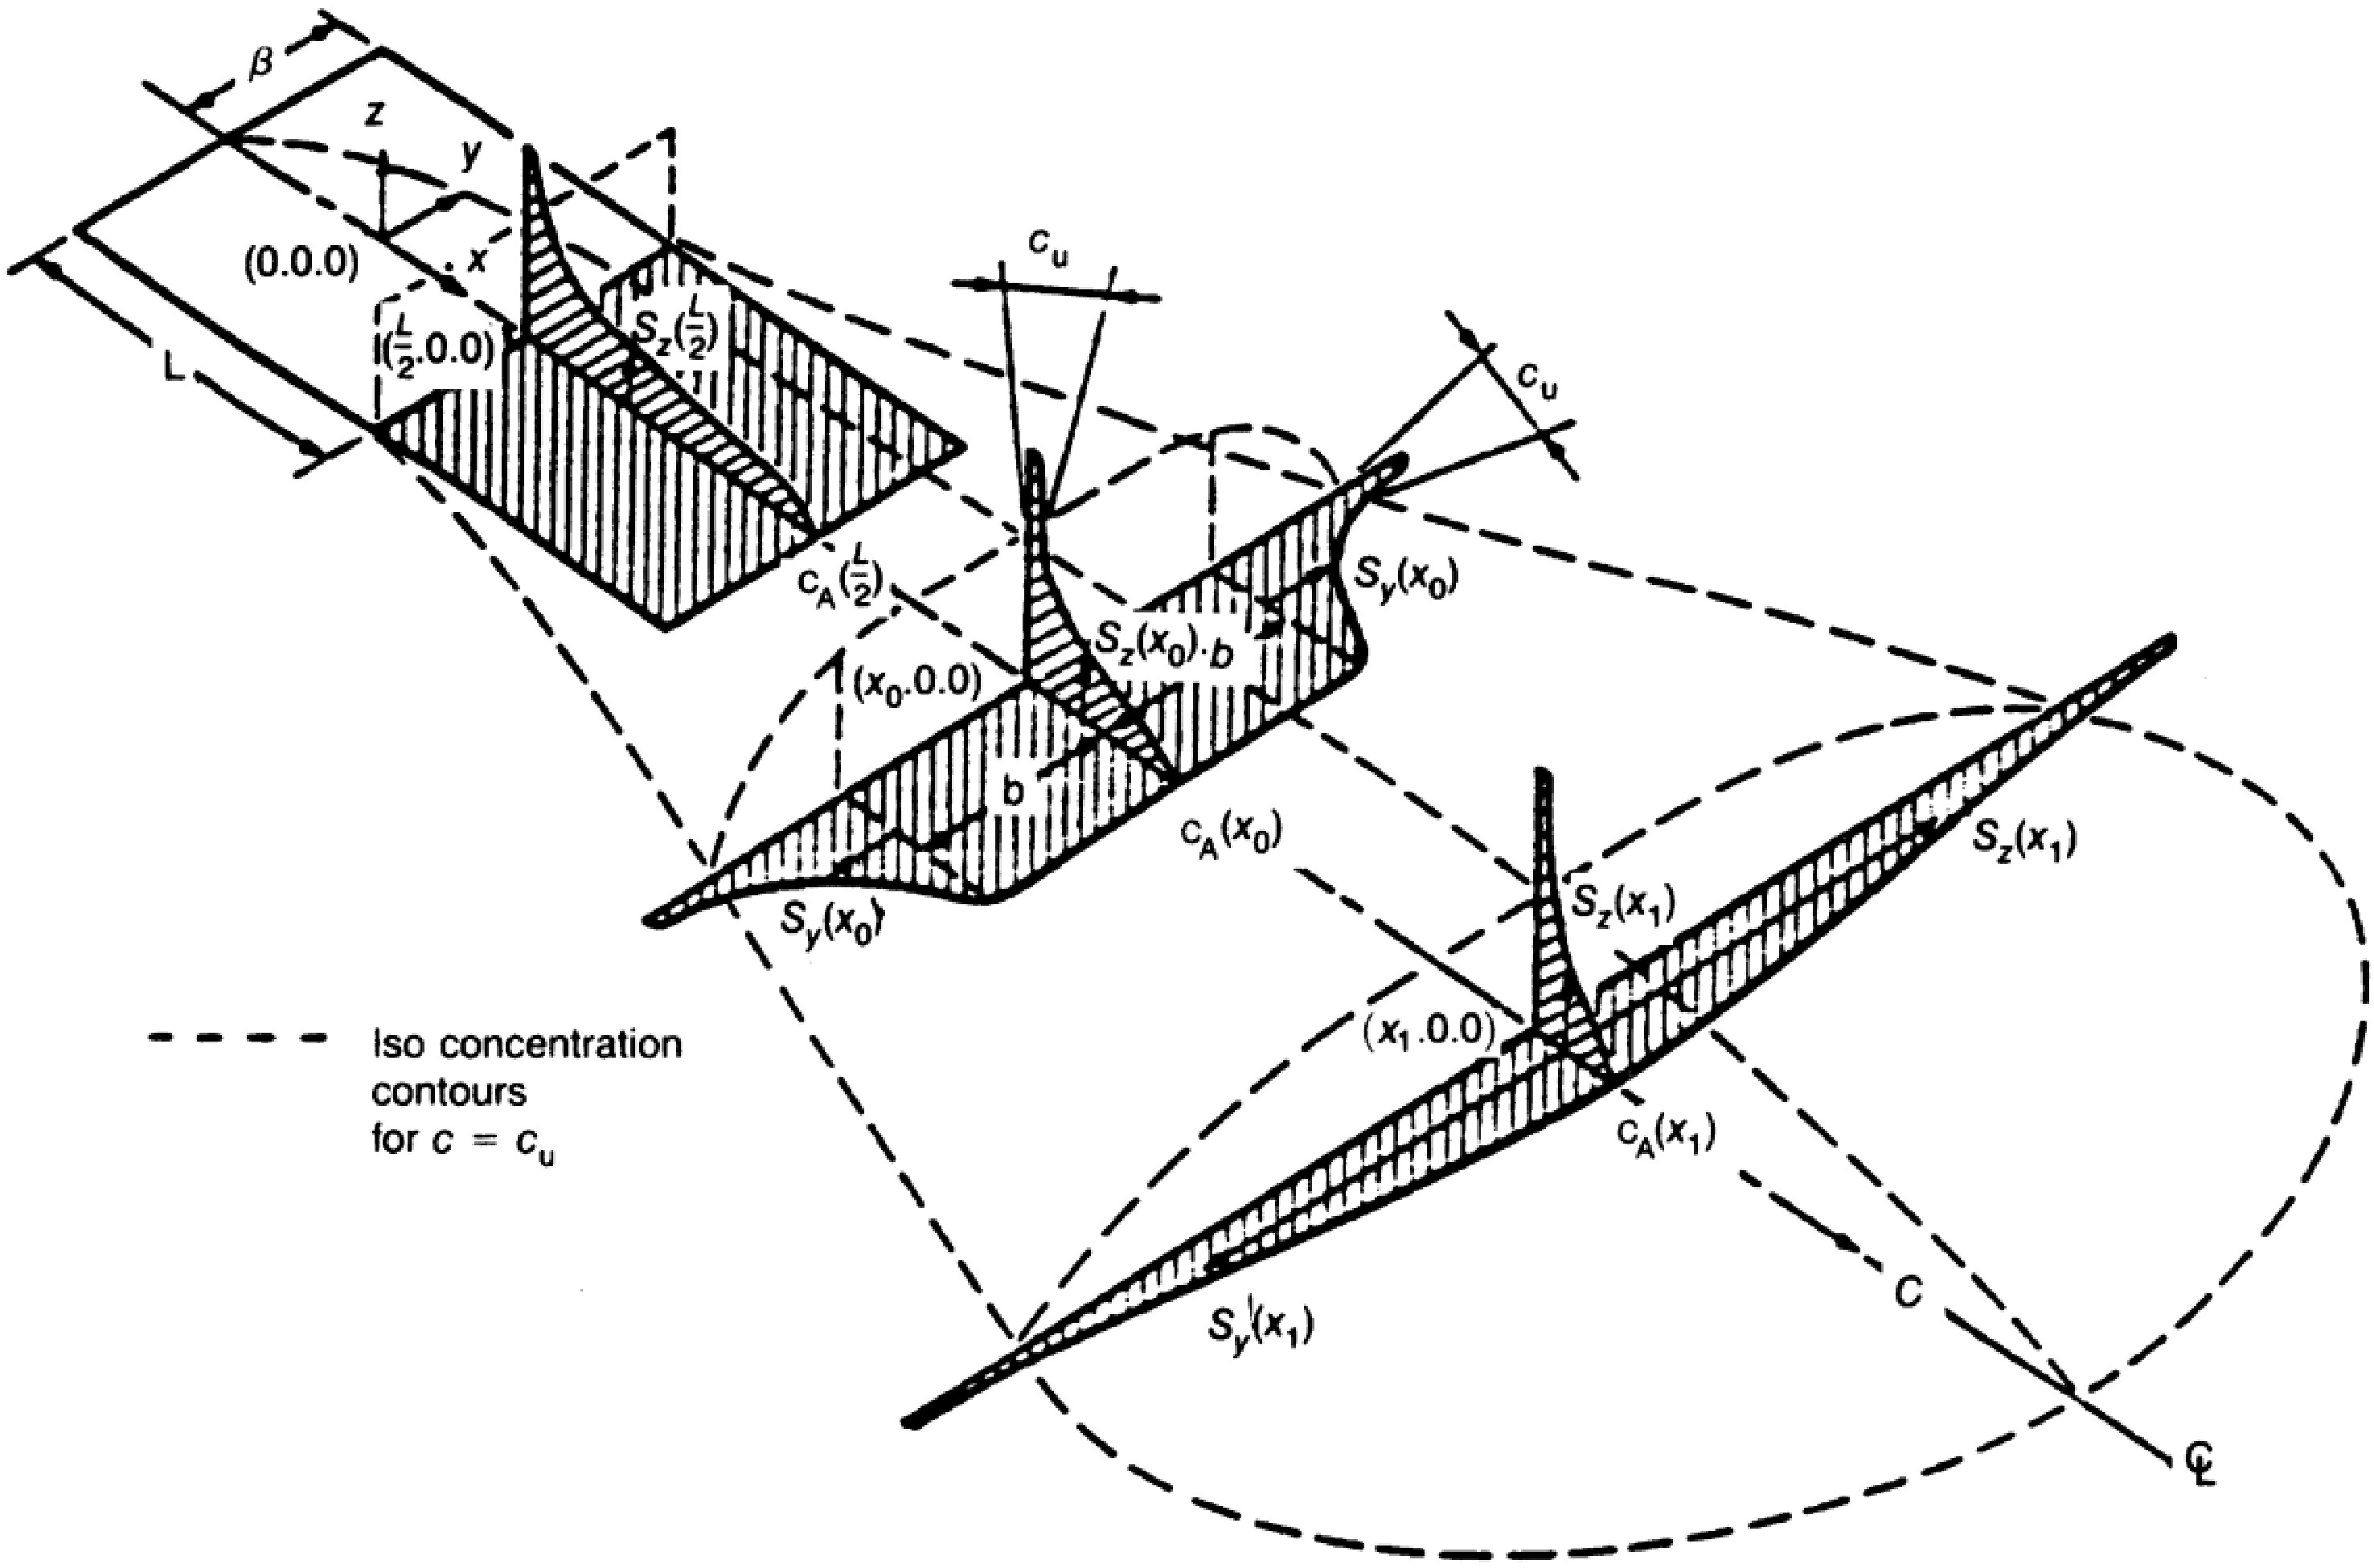
Figure 2.
HEGADAS model plume shape in the ideal state [37].
-
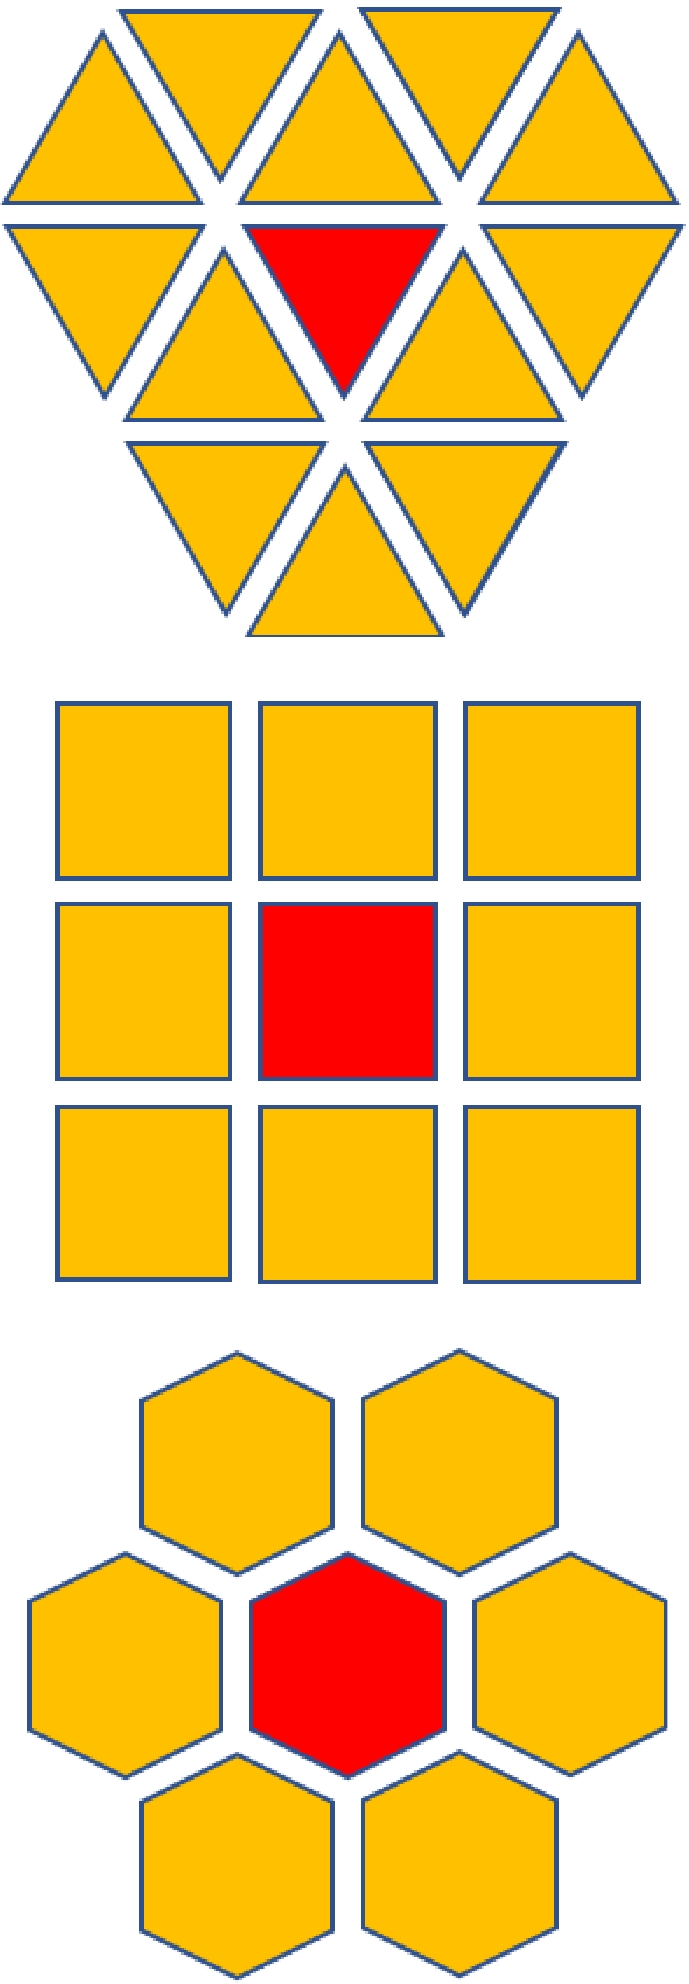
Figure 3.
Triangular, square and hexagonal cellular space.
-
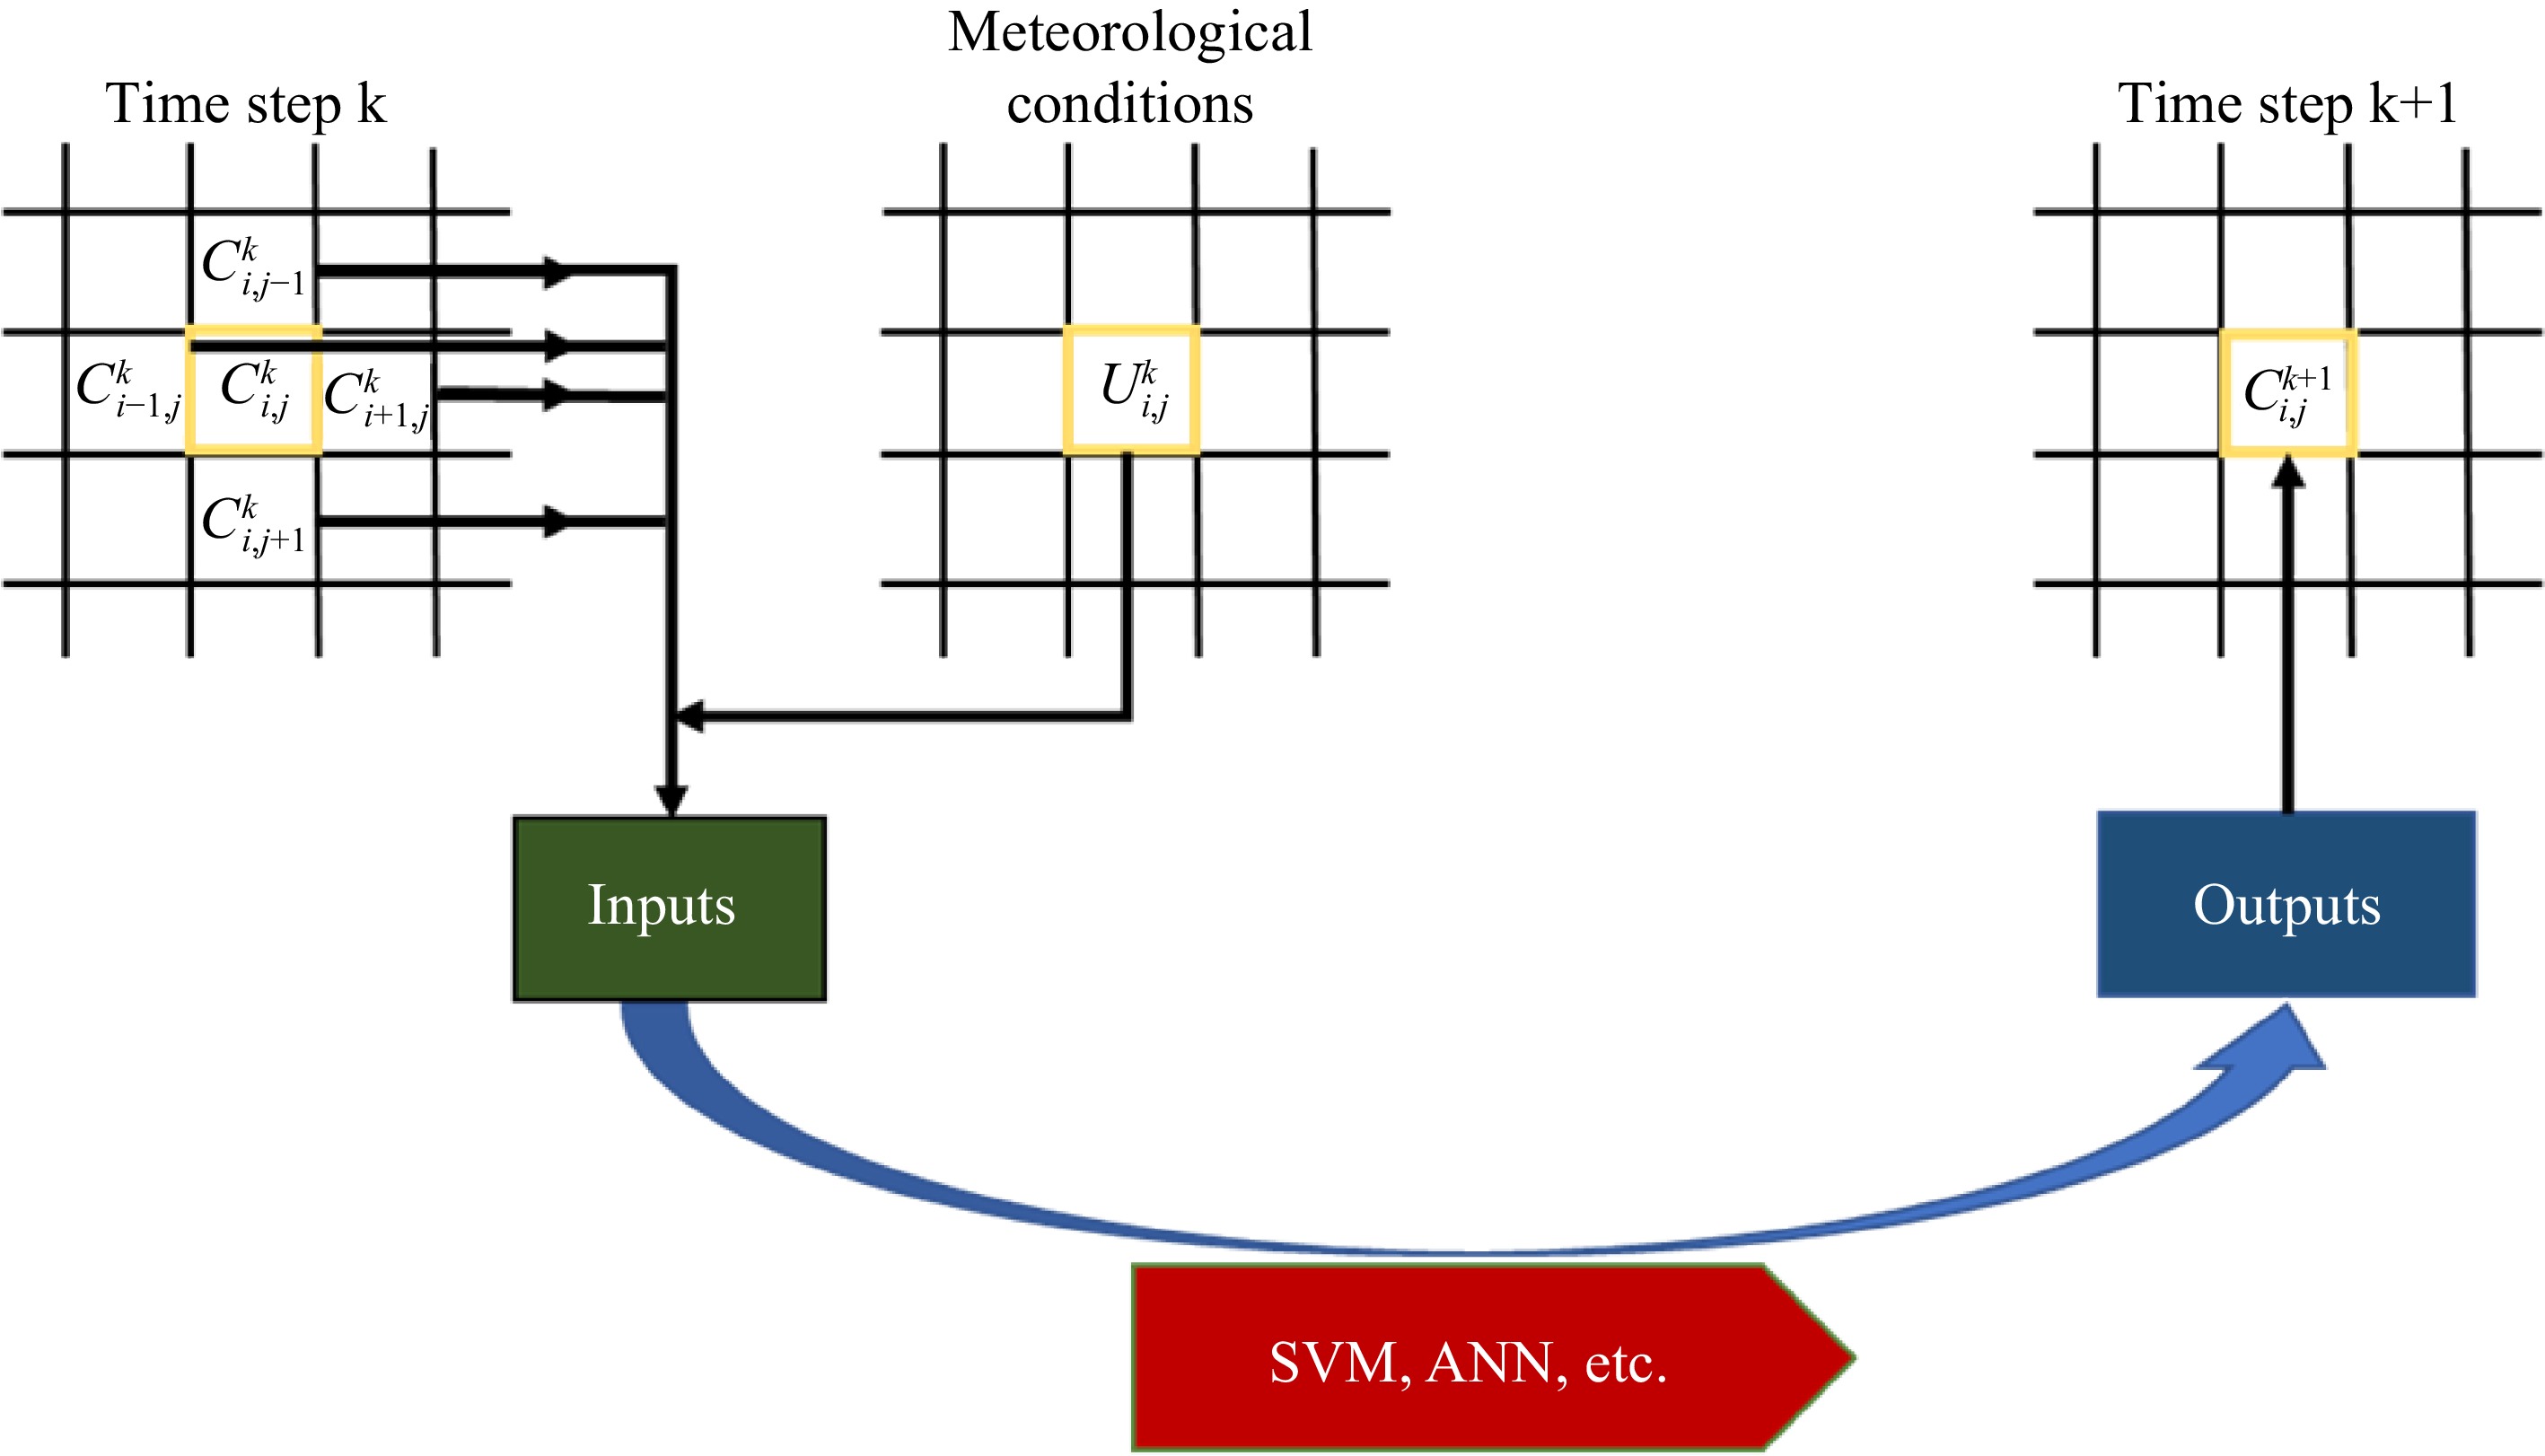
Figure 4.
Cellular automaton state update process.
-
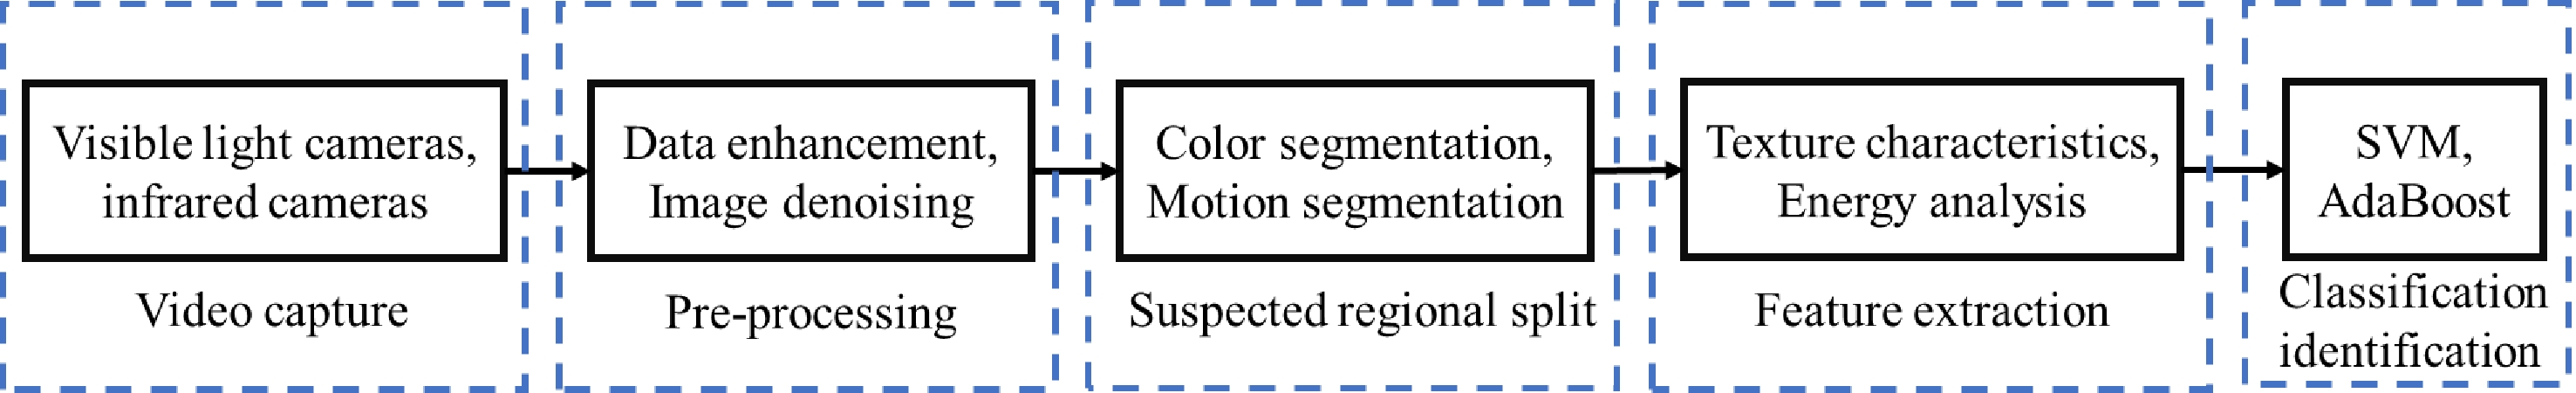
Figure 5.
Flow chart of smoke identification based on computer vision.
-
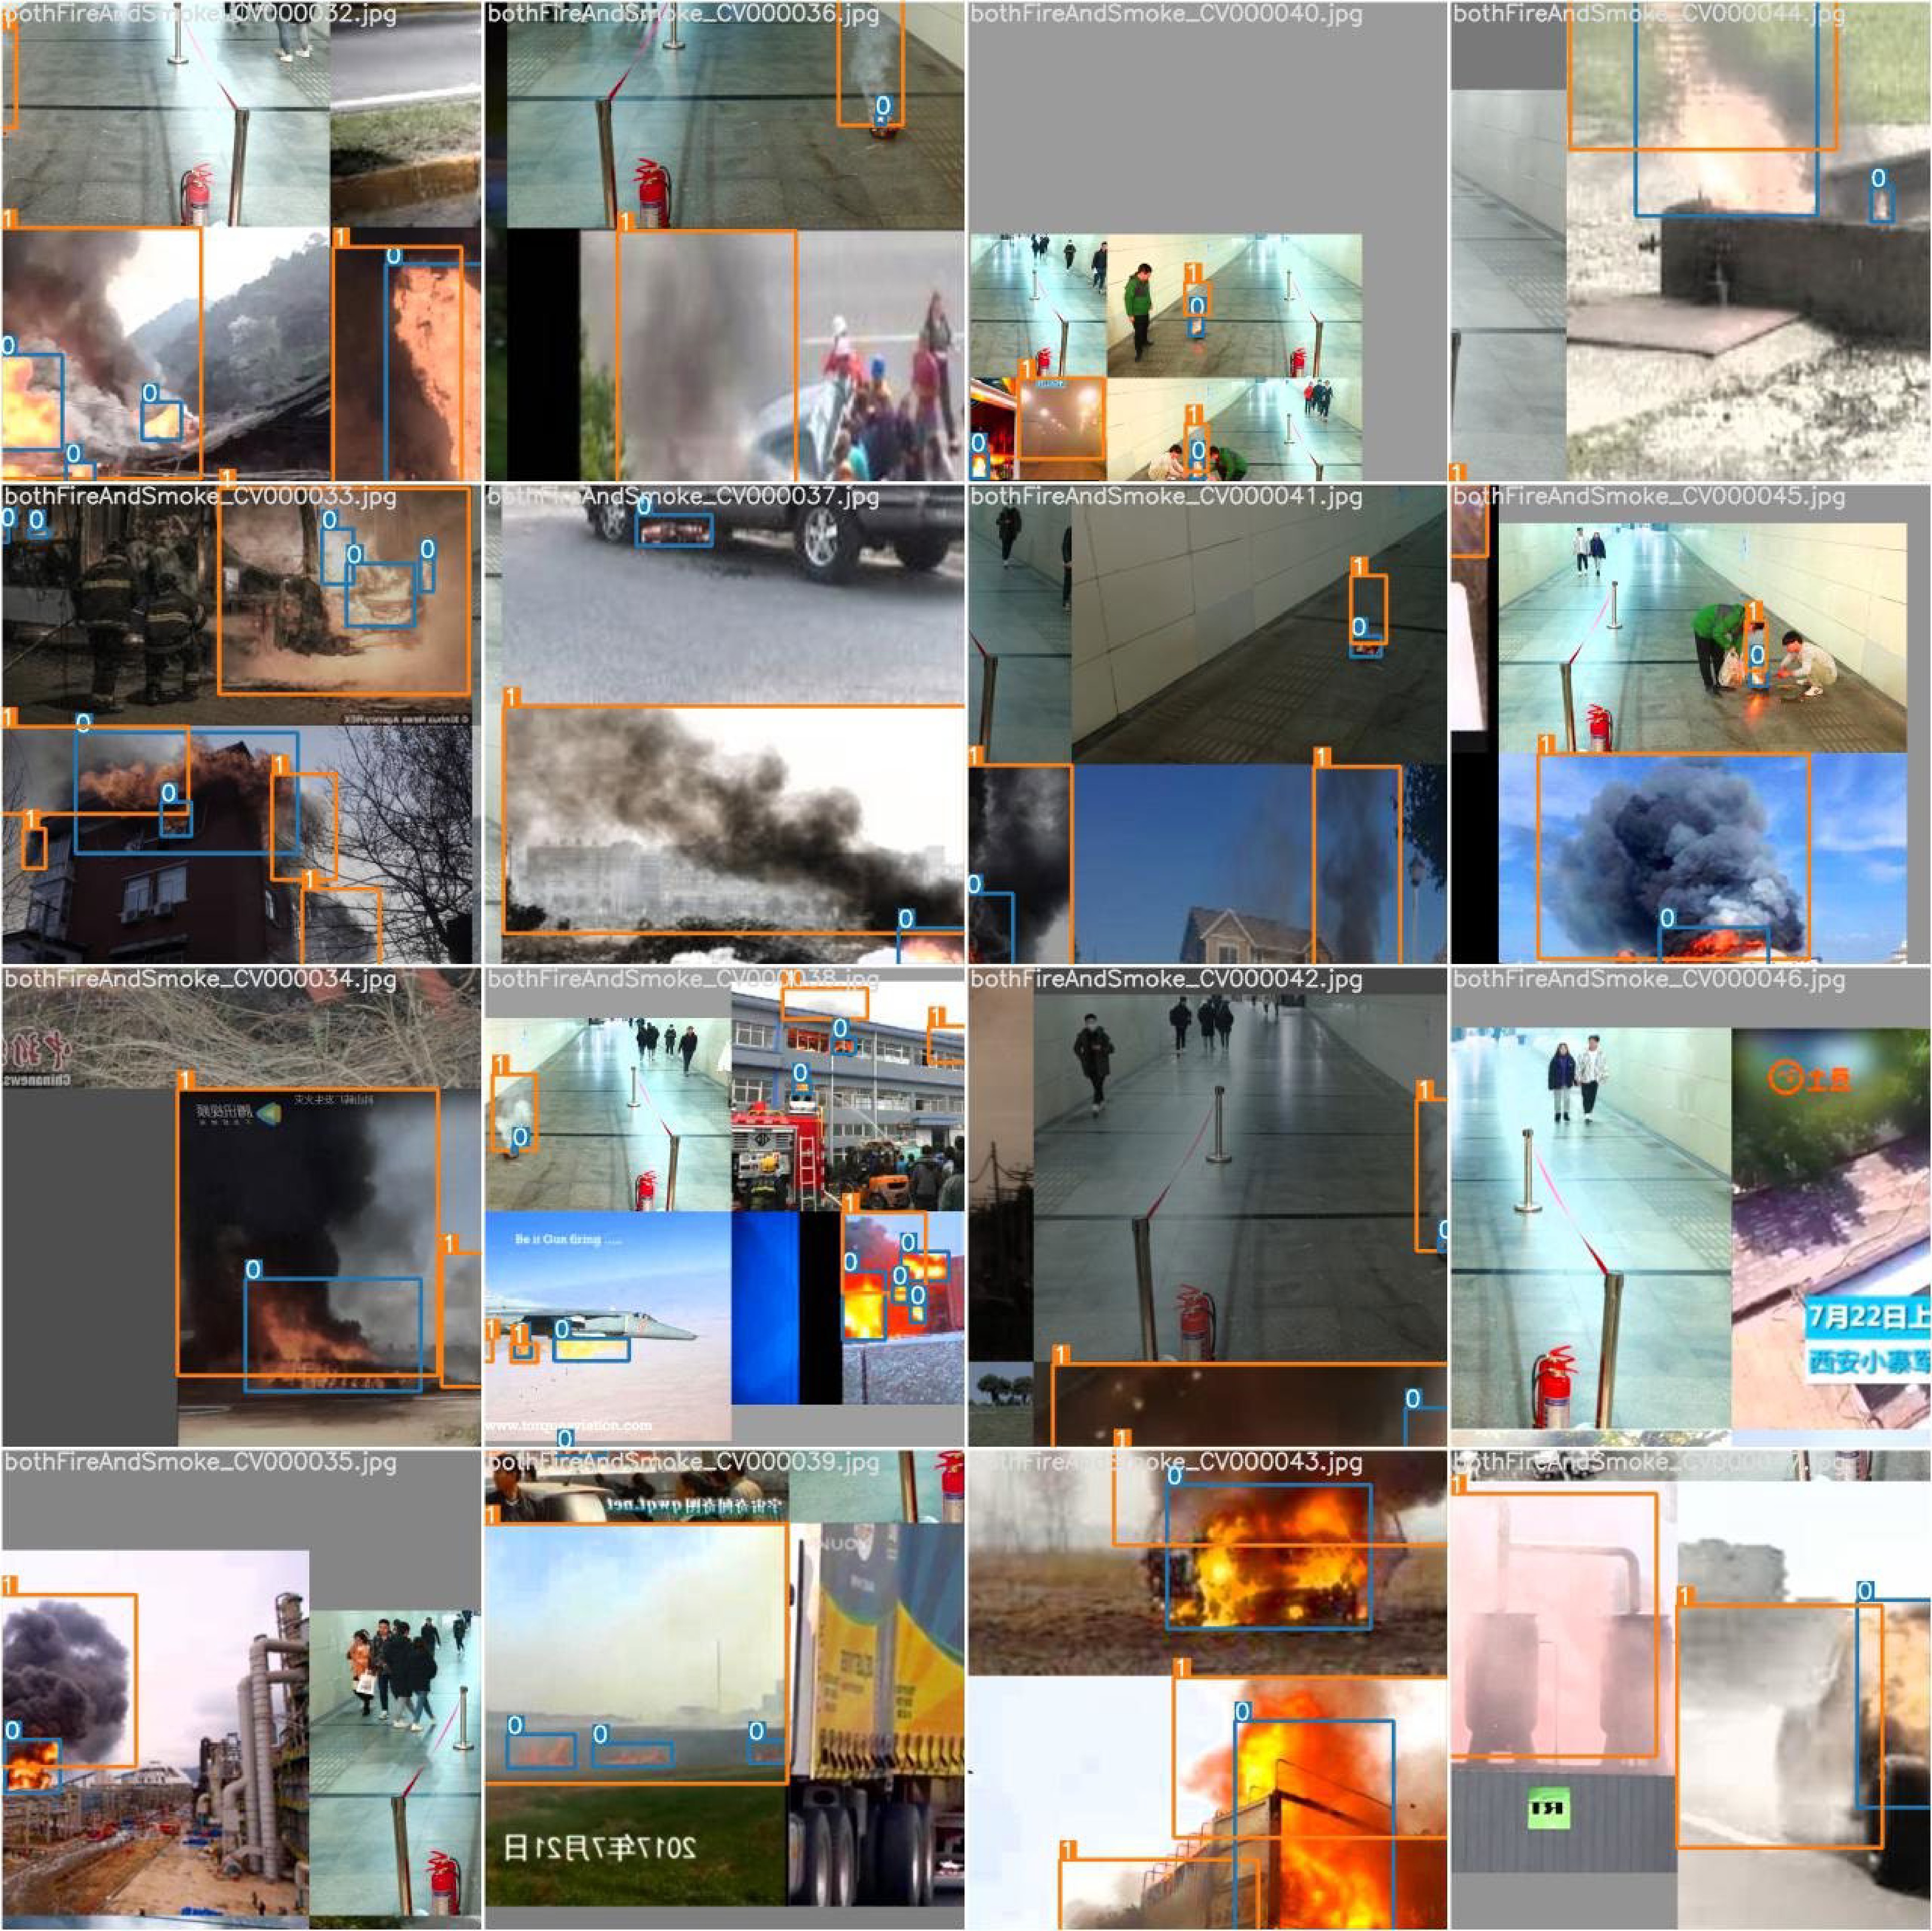
Figure 6.
Smoke recognition using computer vision.
-

Figure 7.
Future research directions
-
Time Accident Consequences of the accident 2014.01.01 Hydrogen sulfide poisoning accident of Shandong Binhua Bingyang Combustion Chemical Co., Ltd, in China It caused a poisoning accident, resulting in 4 deaths, 3 injuries and direct economic loss of 5.36 million RMB 2015.12.17 Sulfur dioxide leakage accident of Excel Industries in India It caused 1 death and 4 people were poisoned and resuscitated 2016.01.09 Hydrogen fluoride leakage poisoning accident of Weifang Changxing Chemical Co., Ltd, in China It caused a poisoning accident, resulting in 3 deaths and 1 injury 2016.06.27 Explosion accident of pascagula gas plant in Mississippi, USA Surrounding residents were evacuated and the gas plant was closed for more than 6 months 2017.05.13 Chlorine gas leakage poisoning accident of Lixing Special Rubber Co., Ltd, in China It resulted in 2 deaths and 25 hospital admissions 2017.08.31 Chemical plant explosion in Texas, USA It resulted in the poisoning of 21 people and the evacuation of residents within a 1.5-mile radius of the accident site 2018.11.28 Vinyl chloride leakage and deflagration accident of Shenghua chemical company of China National Chemical Corporation in China It left 24 people dead and 21 injured 2019.04.02 Isobutylene leakage explosion at KMCO chemical plant in Crosby, Texas, USA. It resulted in 1 death, 2 people were seriously burned and at least 30 other workers were injured to varying degrees 2019.04.15 Poisoning accident of Qilu Tianhe Huishi Pharmaceutical Co., Ltd. in China It caused 10 deaths and 12 injuries, resulting in direct economic losses of 18.67 million RMB 2019.06.21 Fluorinated acid alkylation unit explosion at Philadelphia energy solutions corporation refinery in USA Smoke from the explosion covered much of downtown Philadelphia and South Philadelphia, causing minor injuries to 5 people 2020.05.07 Styrene leakage accident at LG Polymers Ltd. in India It caused 13 deaths and more than 5,000 people felt unwell to varying degrees 2021.04.21 Poisoning accident of Heilongjiang Kelunda Technology Co., Ltd., in China It resulted in 4 deaths and 6 toxic reactions Table 1.
Typical atmospheric dispersion events of accidental release.
-
Parameters Experiment Burro Coyote Desert
TortoiseGoldfish Maplin
SandsThorney
IslandThorney
IslandFladis Number of experiments 8 3 4 3 12 9 2 16 Test medium LNG LNG NH3 HF LNG Freon/N2 Freon/N2 NH3 Leakage source Boiling point heavy gases Boiling point heavy gases Two-phase heavy gases Two-phase heavy gases Boiling point heavy gases Heavy gases Heavy gases Two-phase heavy gases Total amount of release (t) 10.7−17.3 6.5−12.7 10−36.8 35−38 1−6.6 3.15−8.7 4.8 0.036−1.2 Release time (s) 79−190 65−98 126−381 125−360 60−360 Momentay 460 180−2,400 Release surface Water Water Sandy soil Sandy soil Water Sandy soil Sandy soil Sandy soil Surface roughness 0.0002 0.0002 0.003 0.003 0.0003 0.005−0.018 0.005−0.018 0.01 Atmospheric stability C−E C−D D−E D D D−F D−F E−F Farthest distance (m) 140−800 300−400 80 3,000 460−650 500−800 500−800 240 Year of experiment 1982 1983 1985 1987 1984 1985 1985 1993−1996 Table 2.
Famous foreign experiments on diffusion of toxic gases[20].
-
Surface wind
speed (m/s)Daytime sunshine Nighttime conditions Strong Moderate Slight Thinly overcast or
> 4/8 low cloud< 3/8 cloud < 2 A A–B B F F 2–3 A–B B C E F 3–4 B B–C C D E 4–6 C C–D D D D > 6 C D D D D -
Pasquill-Gifford
stability rating$ {\mathit{\sigma }}_{\mathit{y}} $ 

$ {\mathit{\sigma }}_{\mathit{z}} $ 

Rural conditions A 0.22x(1 + 0.0001x)−1/2 0.20x B 0.16x(1 + 0.0001x)−1/2 0.12x C 0.11x(1 + 0.0001x)−1/2 0.08x(1 + 0.0002x)−1/2 D 0.08x(1 + 0.0001x)−1/2 0.06x(1 + 0.0015x)−1/2 E 0.06x(1 + 0.0001x)−1/2 0.03x(1 + 0.0003x)−1/2 F 0.04x(1 + 0.0001x)−1/2 0.016x(1 + 0.0003x)−1/2 City conditions A–B 0.32x(1 + 0.0004x)−1/2 0.24x(1 + 0.0001x)−1/2 C 0.22x(1 + 0.0004x)−1/2 0.02x D 0.16x(1 + 0.0004x)−1/2 0.14x(1 + 0.0003x)−1/2 E–F 0.11x(1 + 0.0004x)−1/2 0.08x(1 + 0.0015x)−1/2 Note: A–F are as defined in Table 3. Table 4.
Recommended Pasquill-Gifford model diffusion coefficient equation for plume dispersion (downwind distance x in m).
-
Model
nameApplicable conditions Scope of application Calculation accuracy Relevant parameters Basic principle Applicable conditions Advantages & disadvantages Gaussian model Neutral Large scale and short duration Poor Density, explosion limit, temperature, wind speed, wind direction, atmospheric stability level Continuous Instantaneous One of the most widely used models, simple calculation, only applicable to neutral gas, poor simulation accuracy Sutton model Neutral Large scale and long duration Poor Cy, Cz (diffusion parameters related to meteorological conditions) Similar distribution Continuous Instantaneous Large errors when simulating the diffusion of combustible gas leakage P-G model Neutral Unrestricted Poor Wind speed,
atmospheric stability,
topography, height of the leakage source,
in itial state and nature of the substanceContinuous Instantaneous More human factors in determining atmospheric stability cause large deviations in diffusion simulation results BM model Medium or heavy Large scale and long duration Average Average concentration, initial concentration on gas cloud cross section Statistical analysis based on experimental data Continuous, transient surface and body sources Easy to use, graphing by experimental data, not suitable for areas with large surface roughness, poor extensibility Box and similar models Medium or heavy Unrestricted Better Mean cloud radius,
mean cloud altitude,
mean cloud temperatureConsider the heavy gas as a cylinder according to the phenomenon of heavy gas sinking Momentary The existence of discontinuous surfaces, simple calculations, large errors and large uncertainties Shallow
layer
modelsHeavy Unrestricted Better Cloud density,
cloud thickness,
cloud velocity,
ambient air densityShallow water equation Continuous High accuracy than box model, can simulate general complex terrain Table 5.
Comparison of empirical and simplified models[5].
Figures
(7)
Tables
(5)