-
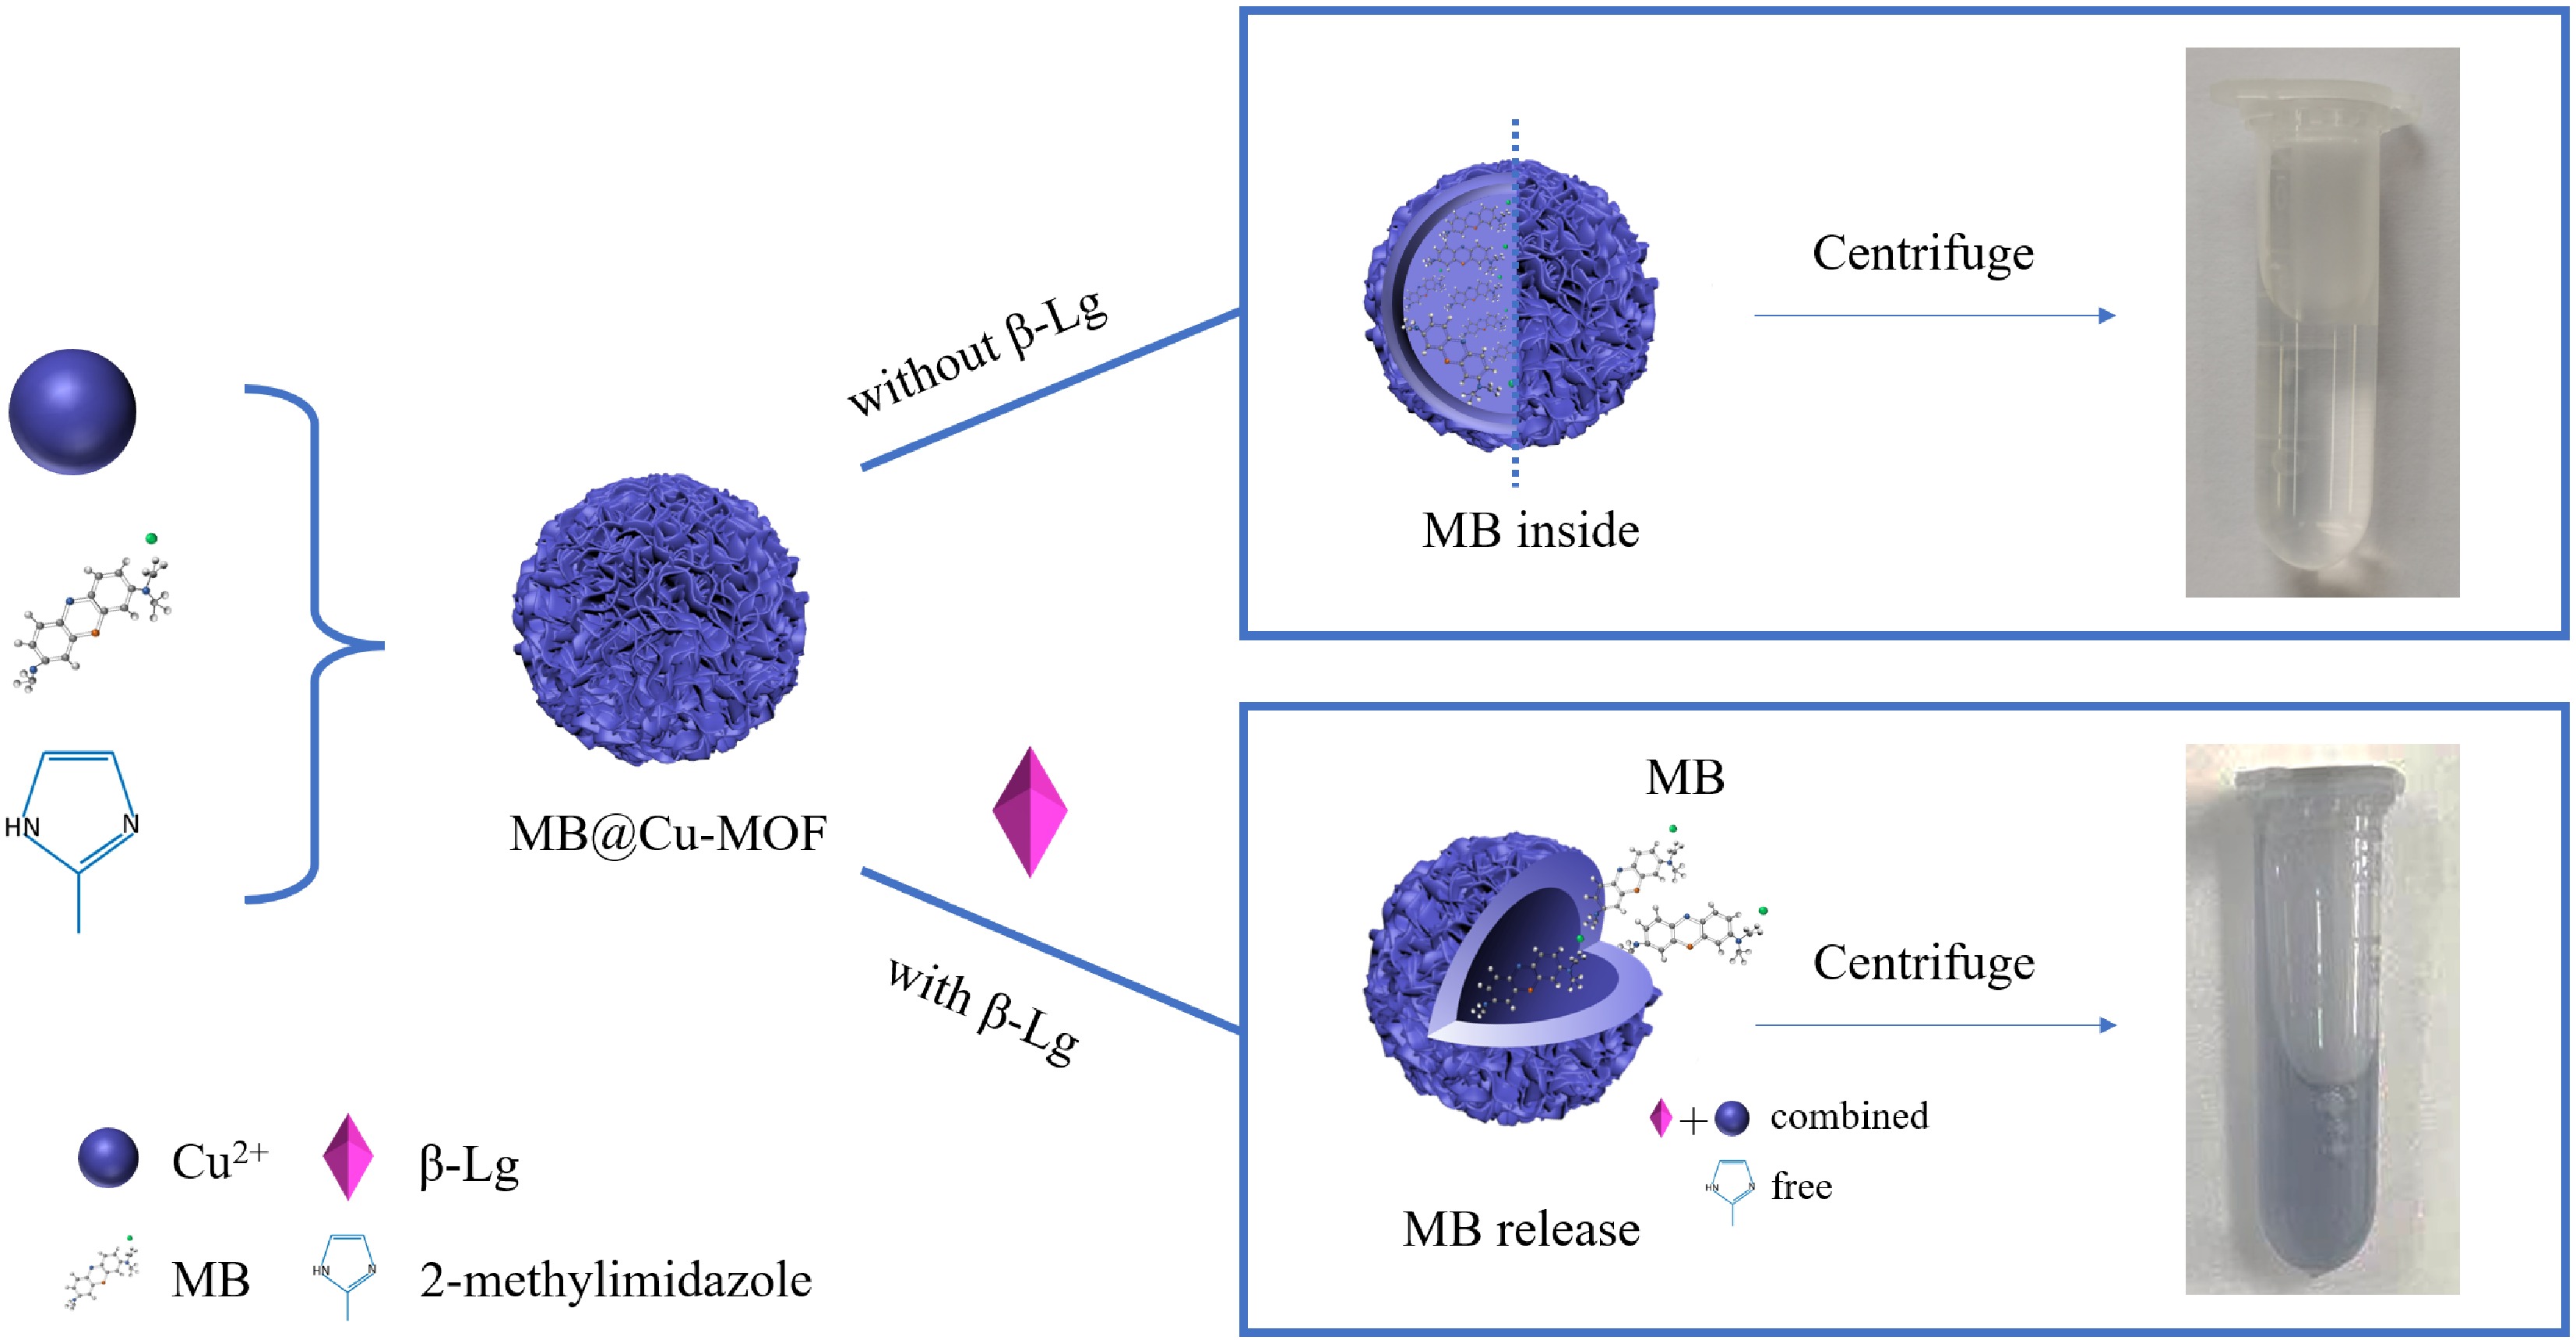
Figure 1.
Schematic diagram of measuring β-Lg by MB@Cu-MOF electrochemistry.
-
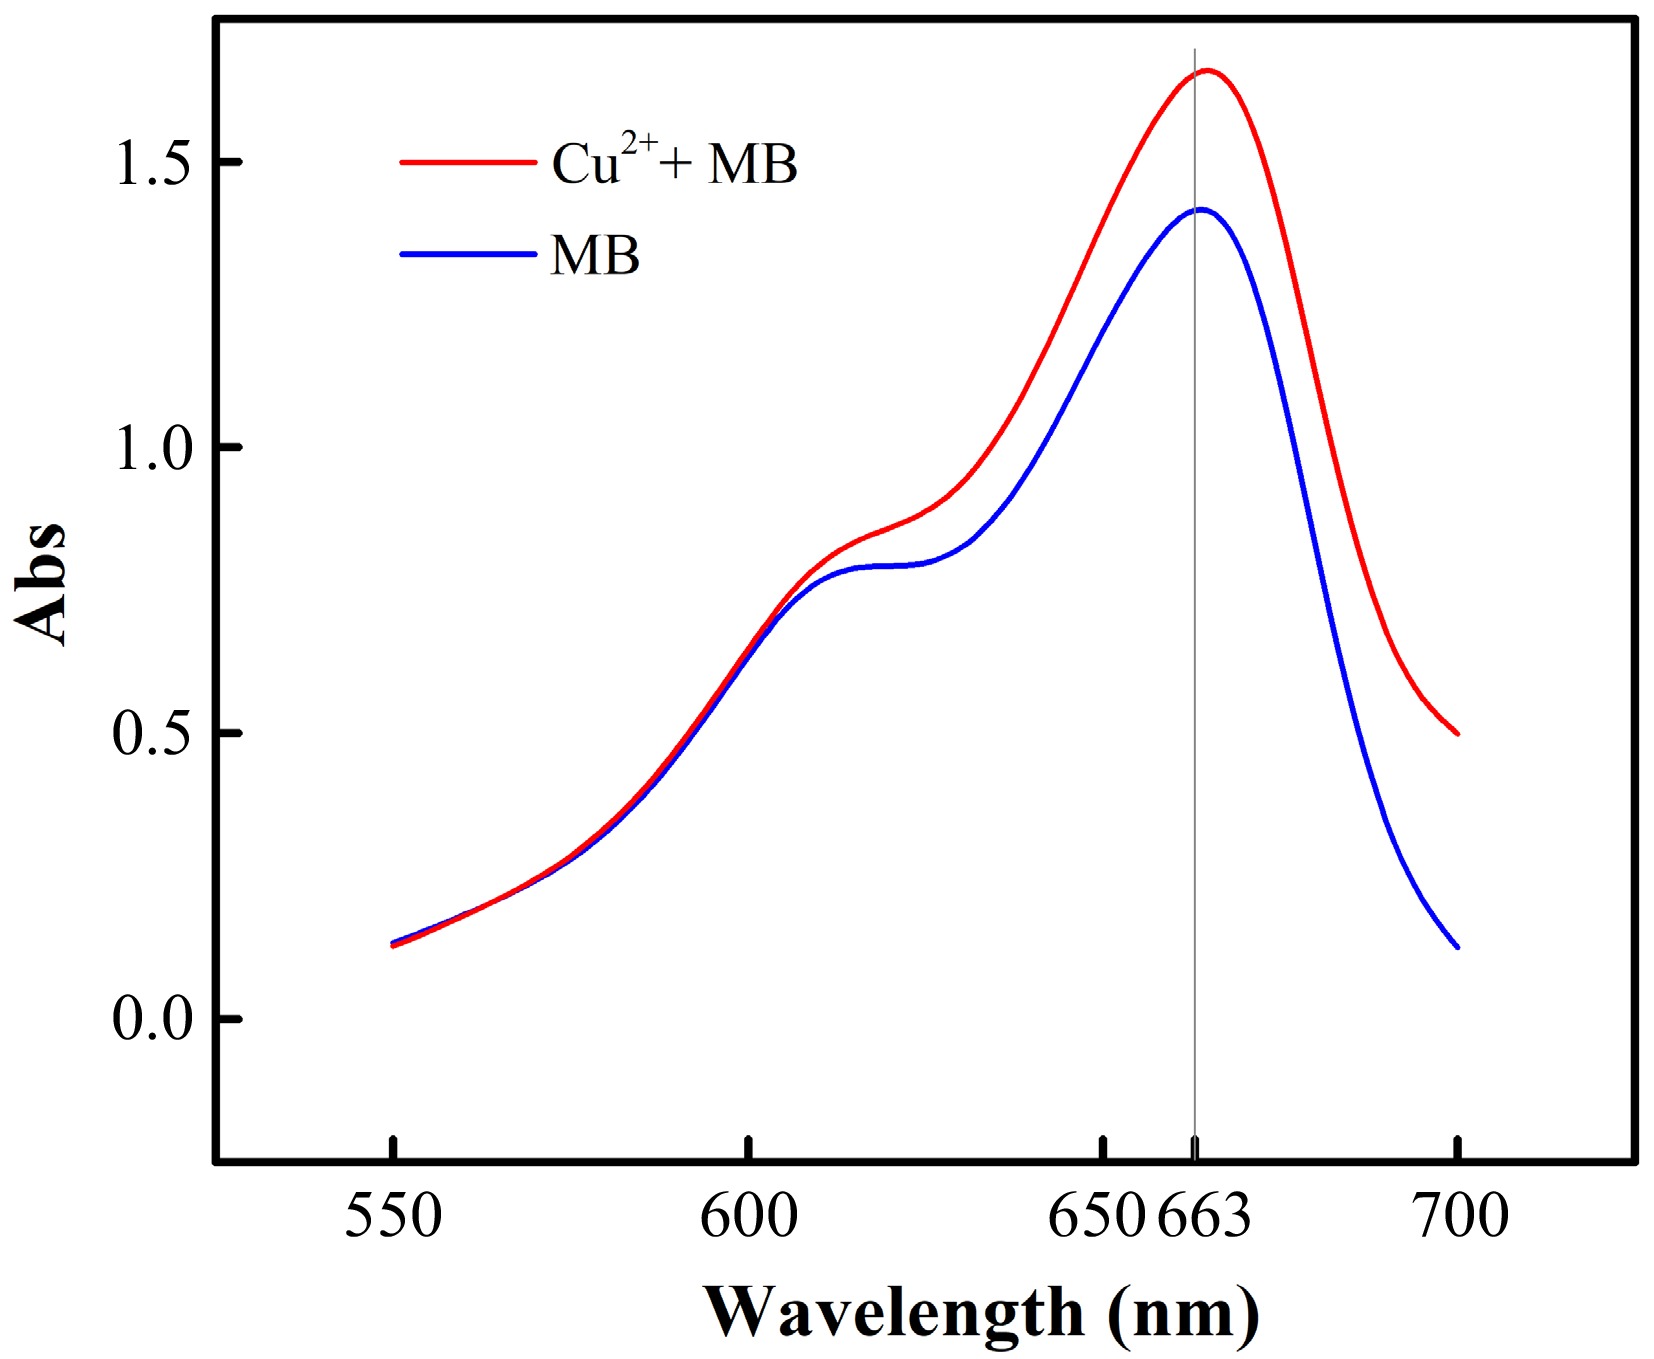
Figure 2.
The UV-vis spectra of MB solution and mixed solution of MB and copper chloride.
-
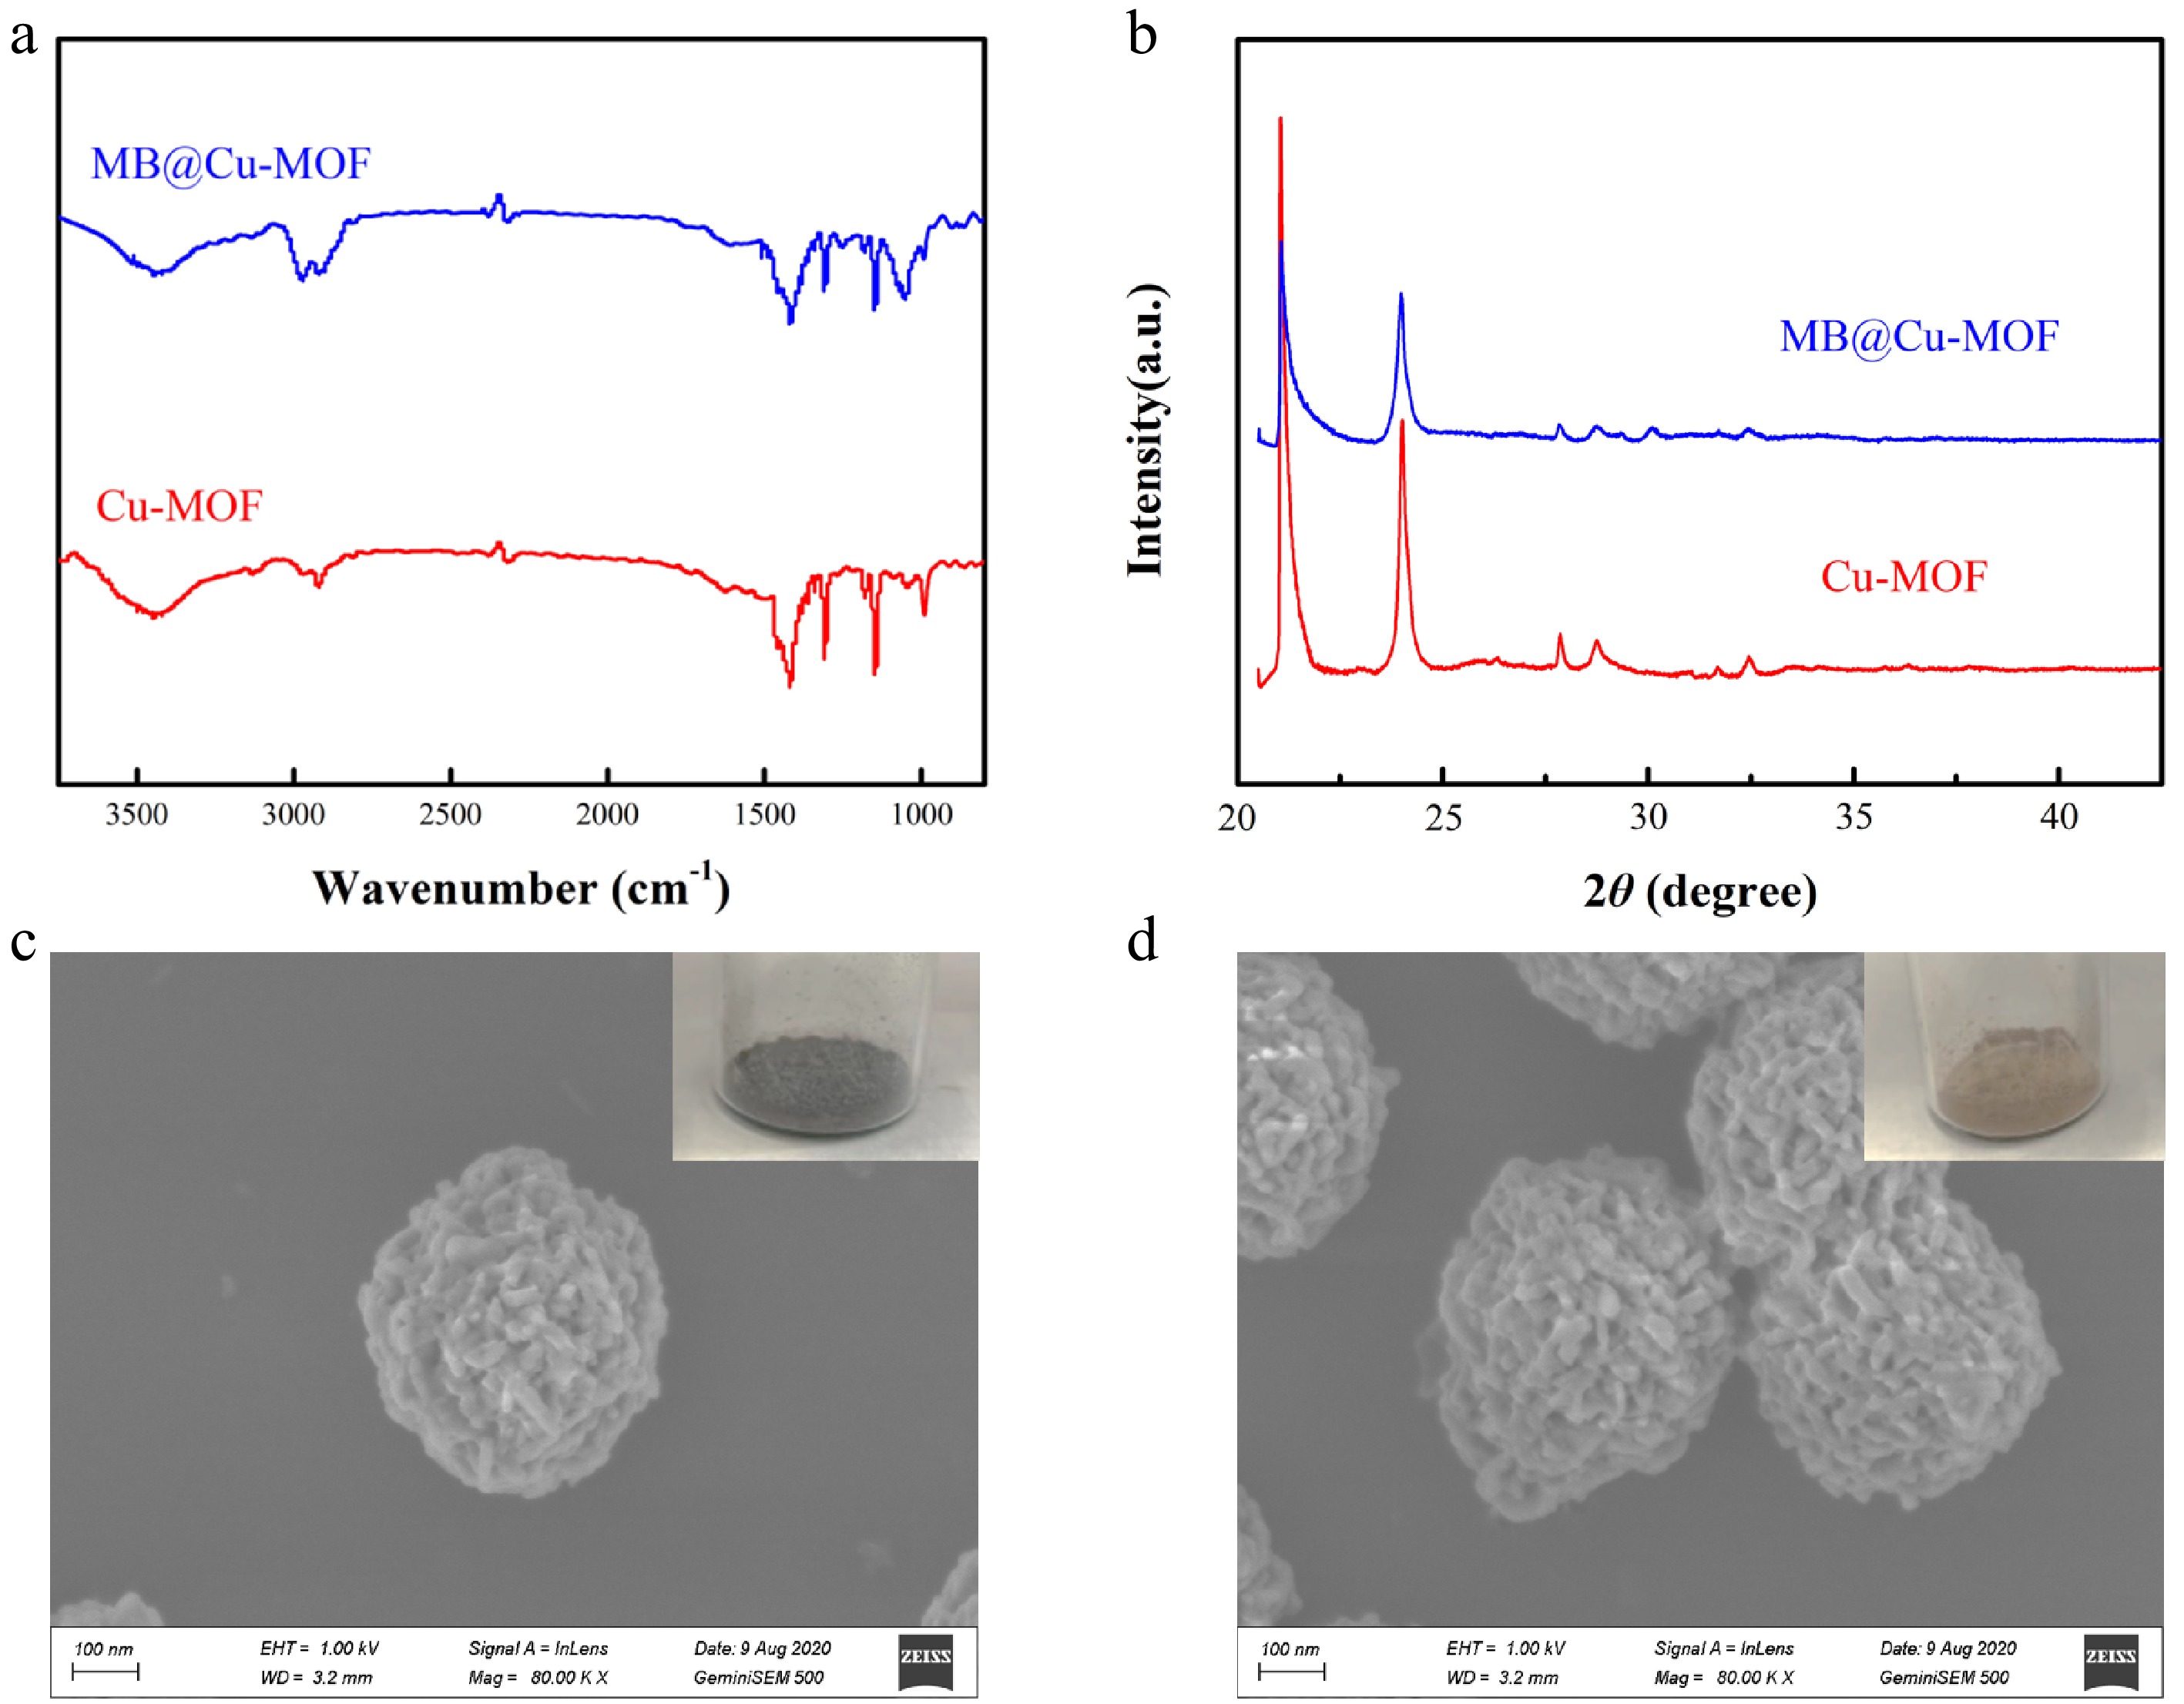
Figure 3.
(a) FTIR spectrum and (b) X-ray diffraction of the Cu-MOF and the MB@Cu-MOF. SEM images of (c) the Cu-MOF and (d) the MB@Cu-MOF.
-
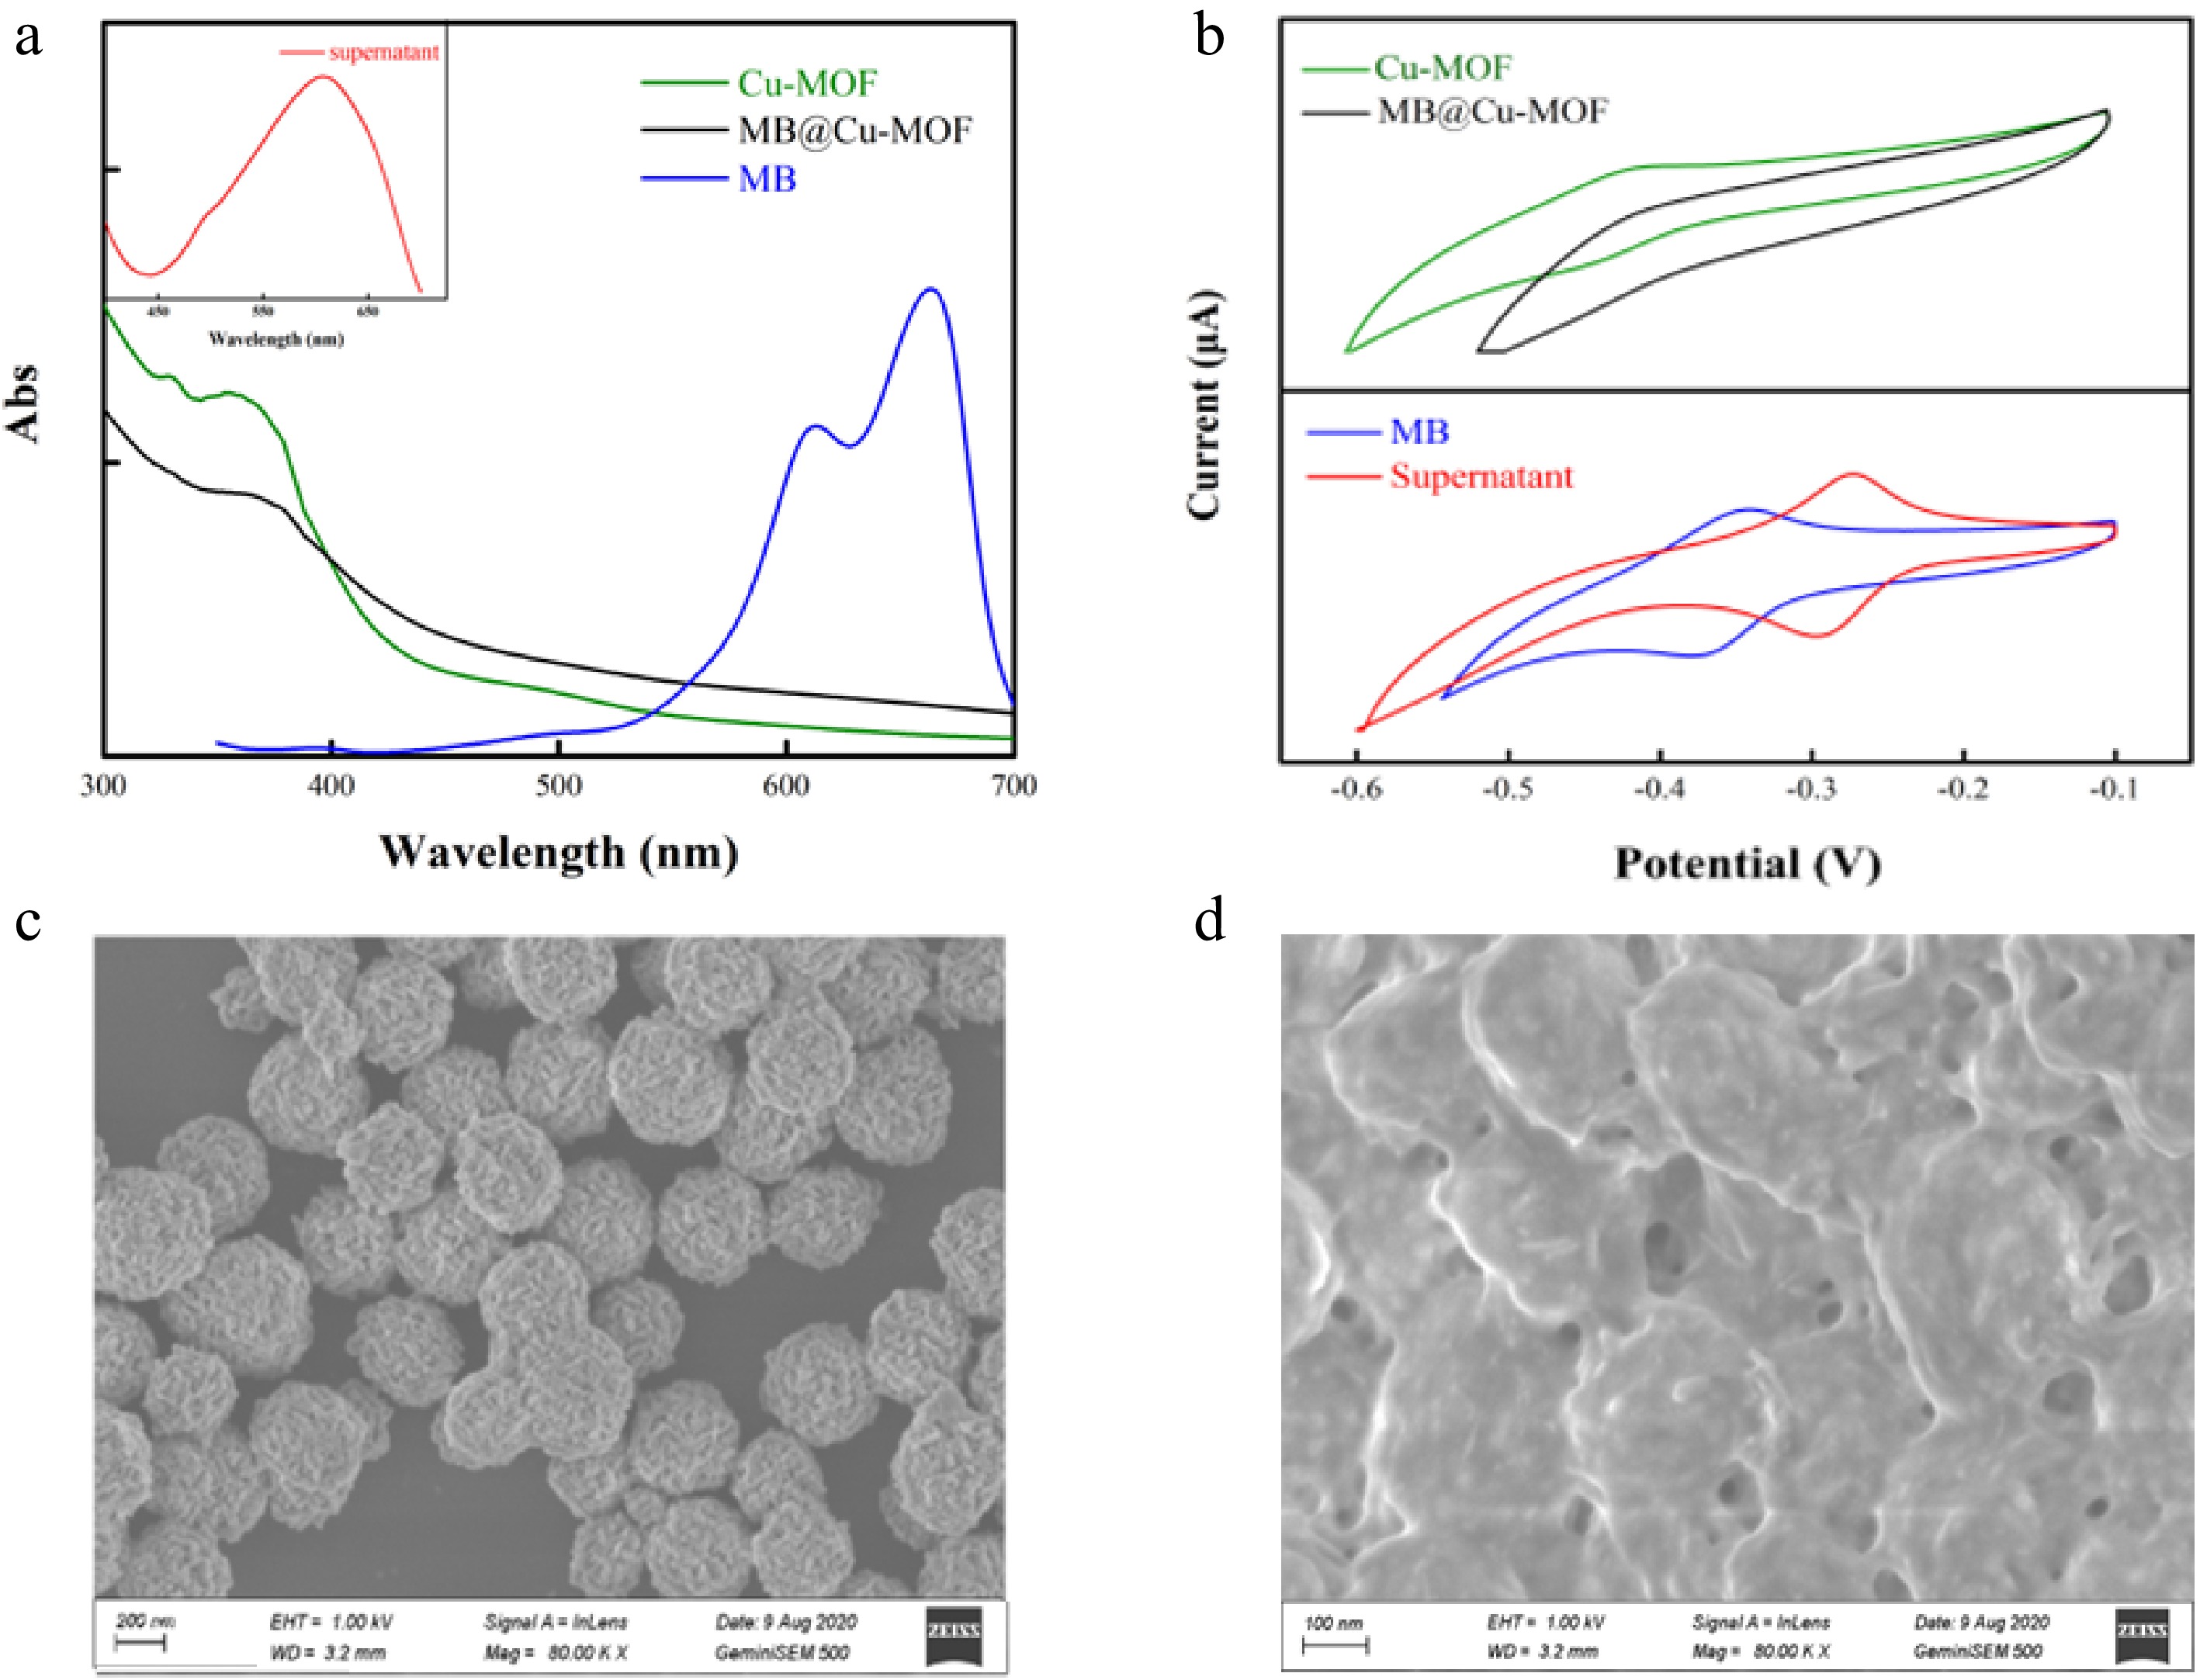
Figure 4.
(a) UV-Vis and (b) cyclic voltammogram of the MB, the Cu-MOF, the MB@Cu-MOF and the supernatant. SEM images of (c) the MB @ Cu-MOF and (d) the MB@Cu-MOF incubation with β-Lg.
-

Figure 5.
(a) UV-vis absorption spectra and differential pulse voltammograms of different concentrations of MB. (b) Standard curves of MB on UV-vis spectra and differential pulse voltammetry curves.
-
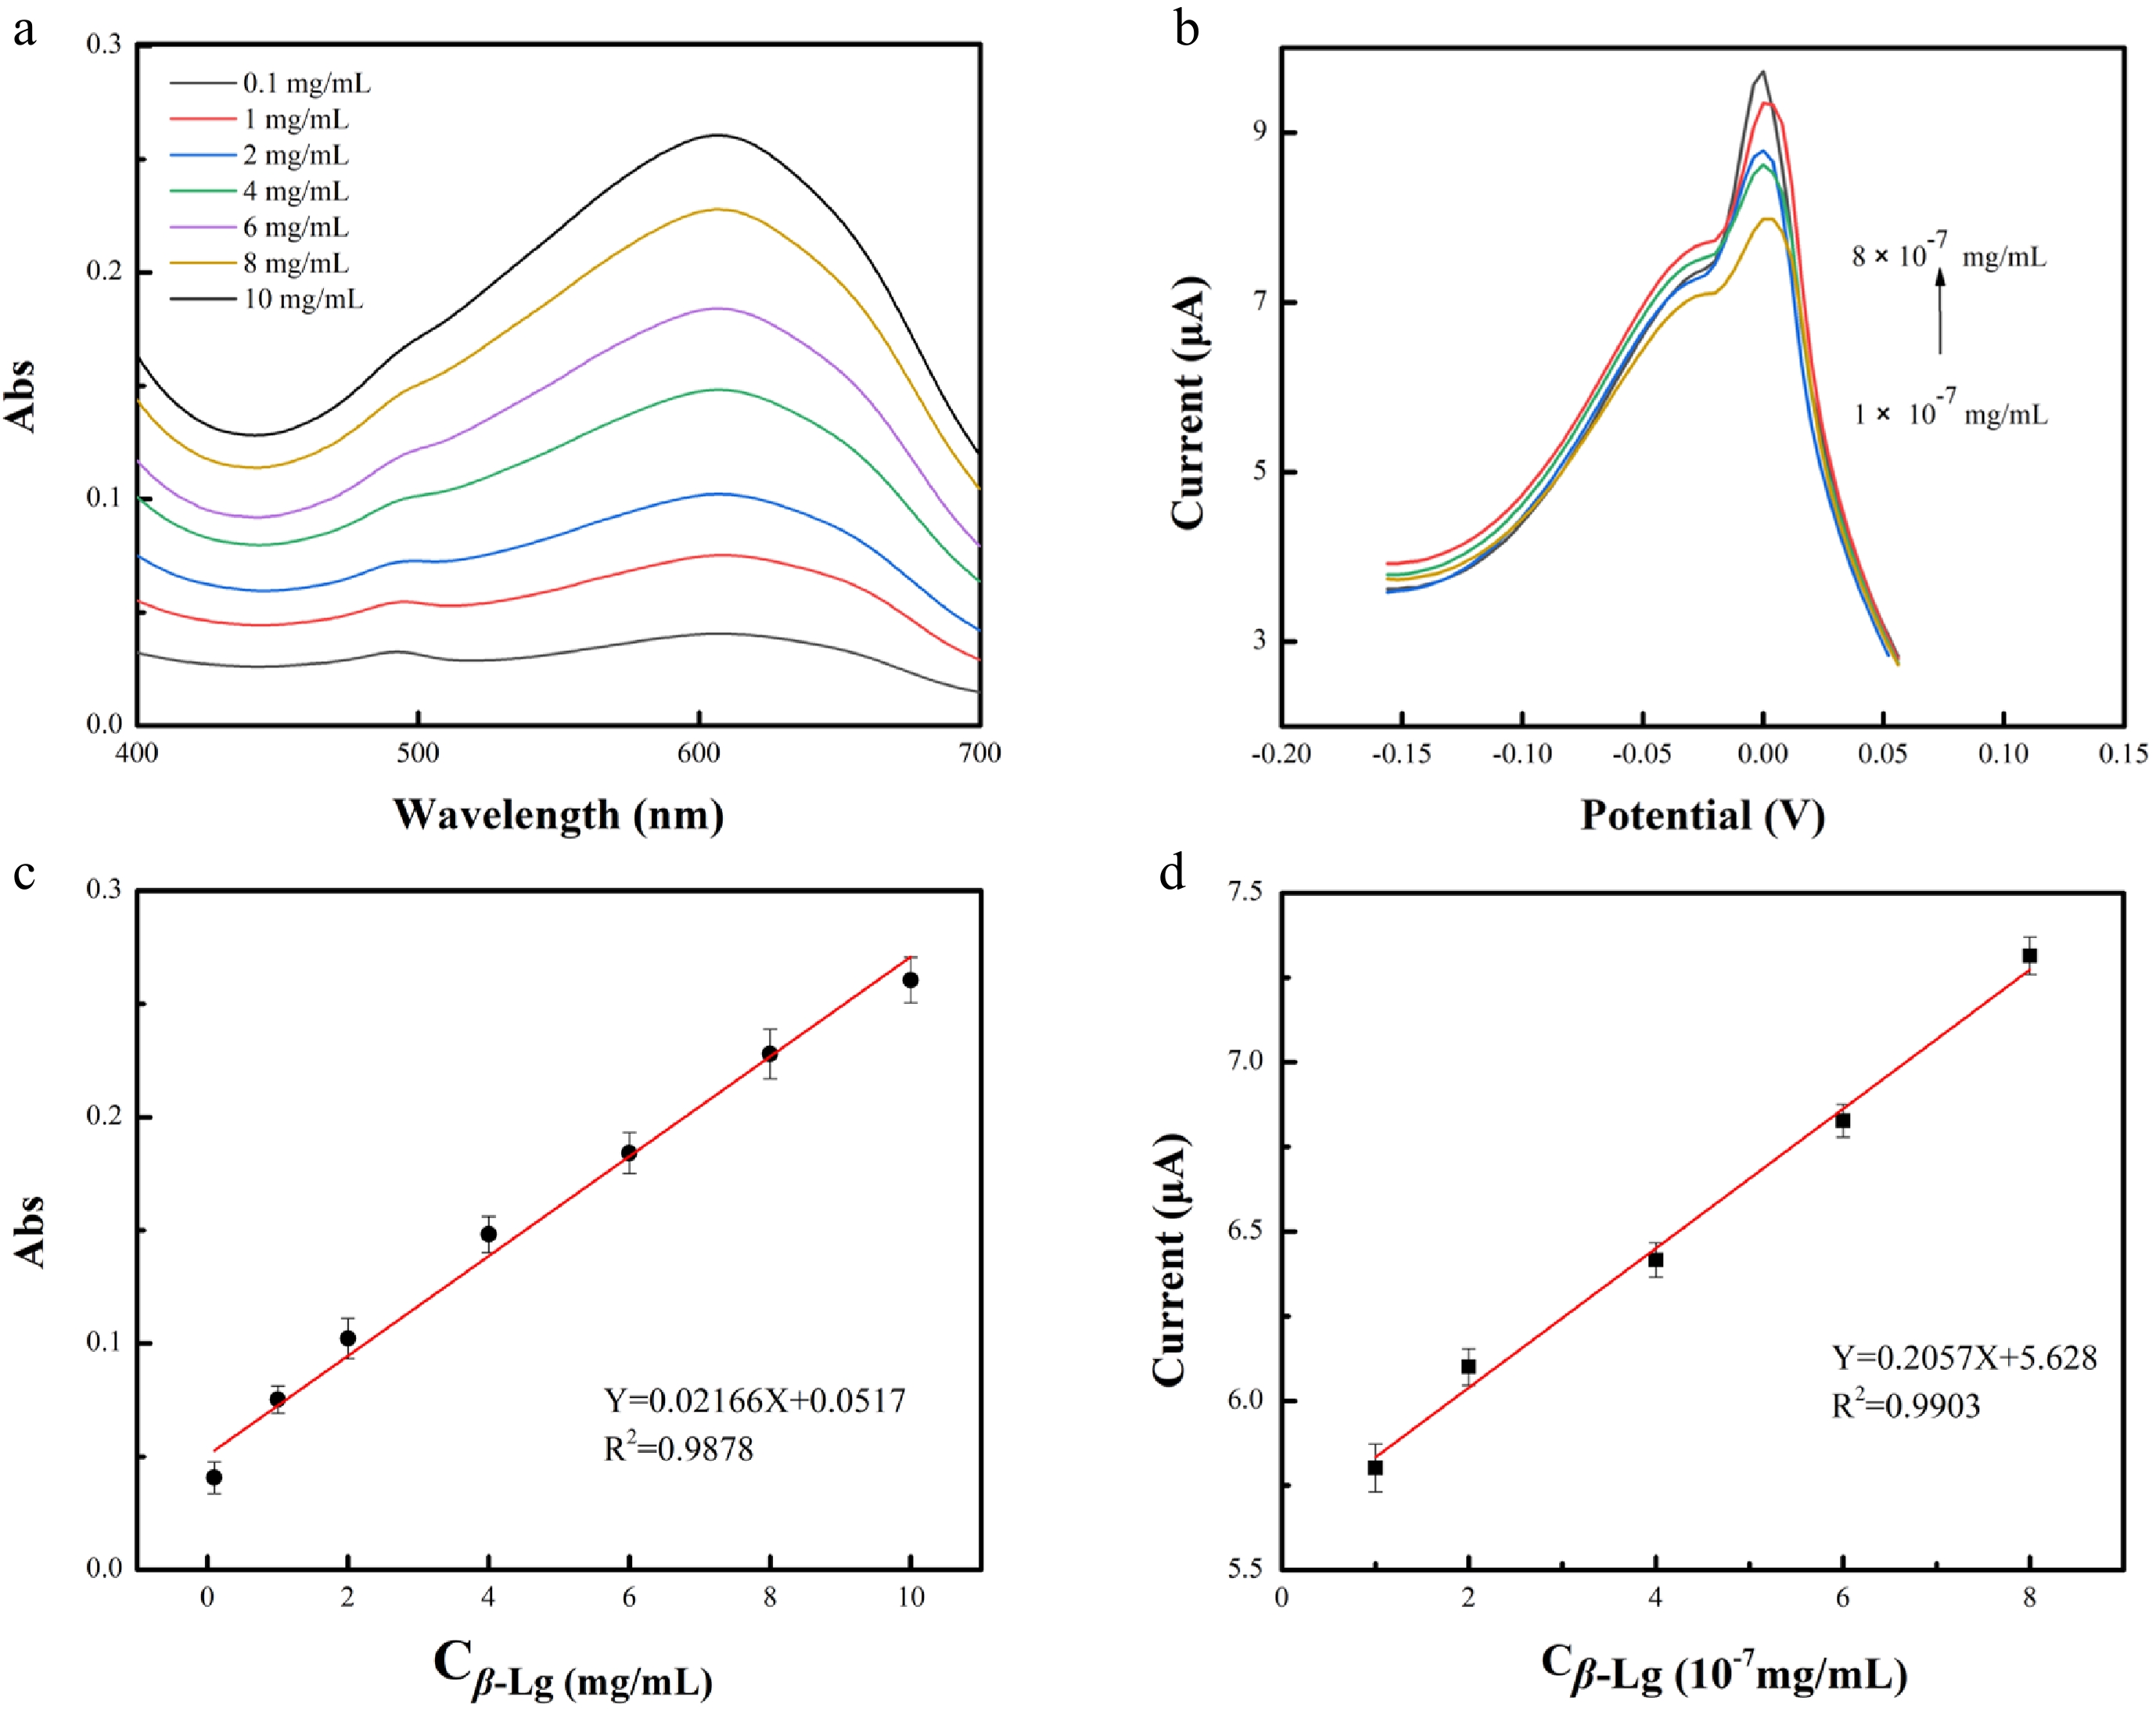
Figure 6.
(a) UV-vis and (b) differential pulse voltammetry (DPV) of the supernatant after incubation with different concentrations of β-Lg and MB@Cu-MOF. Standard curve of logarithm of β-Lg concentration on (c) UV-vis spectrum and (d) DPV curve.
-
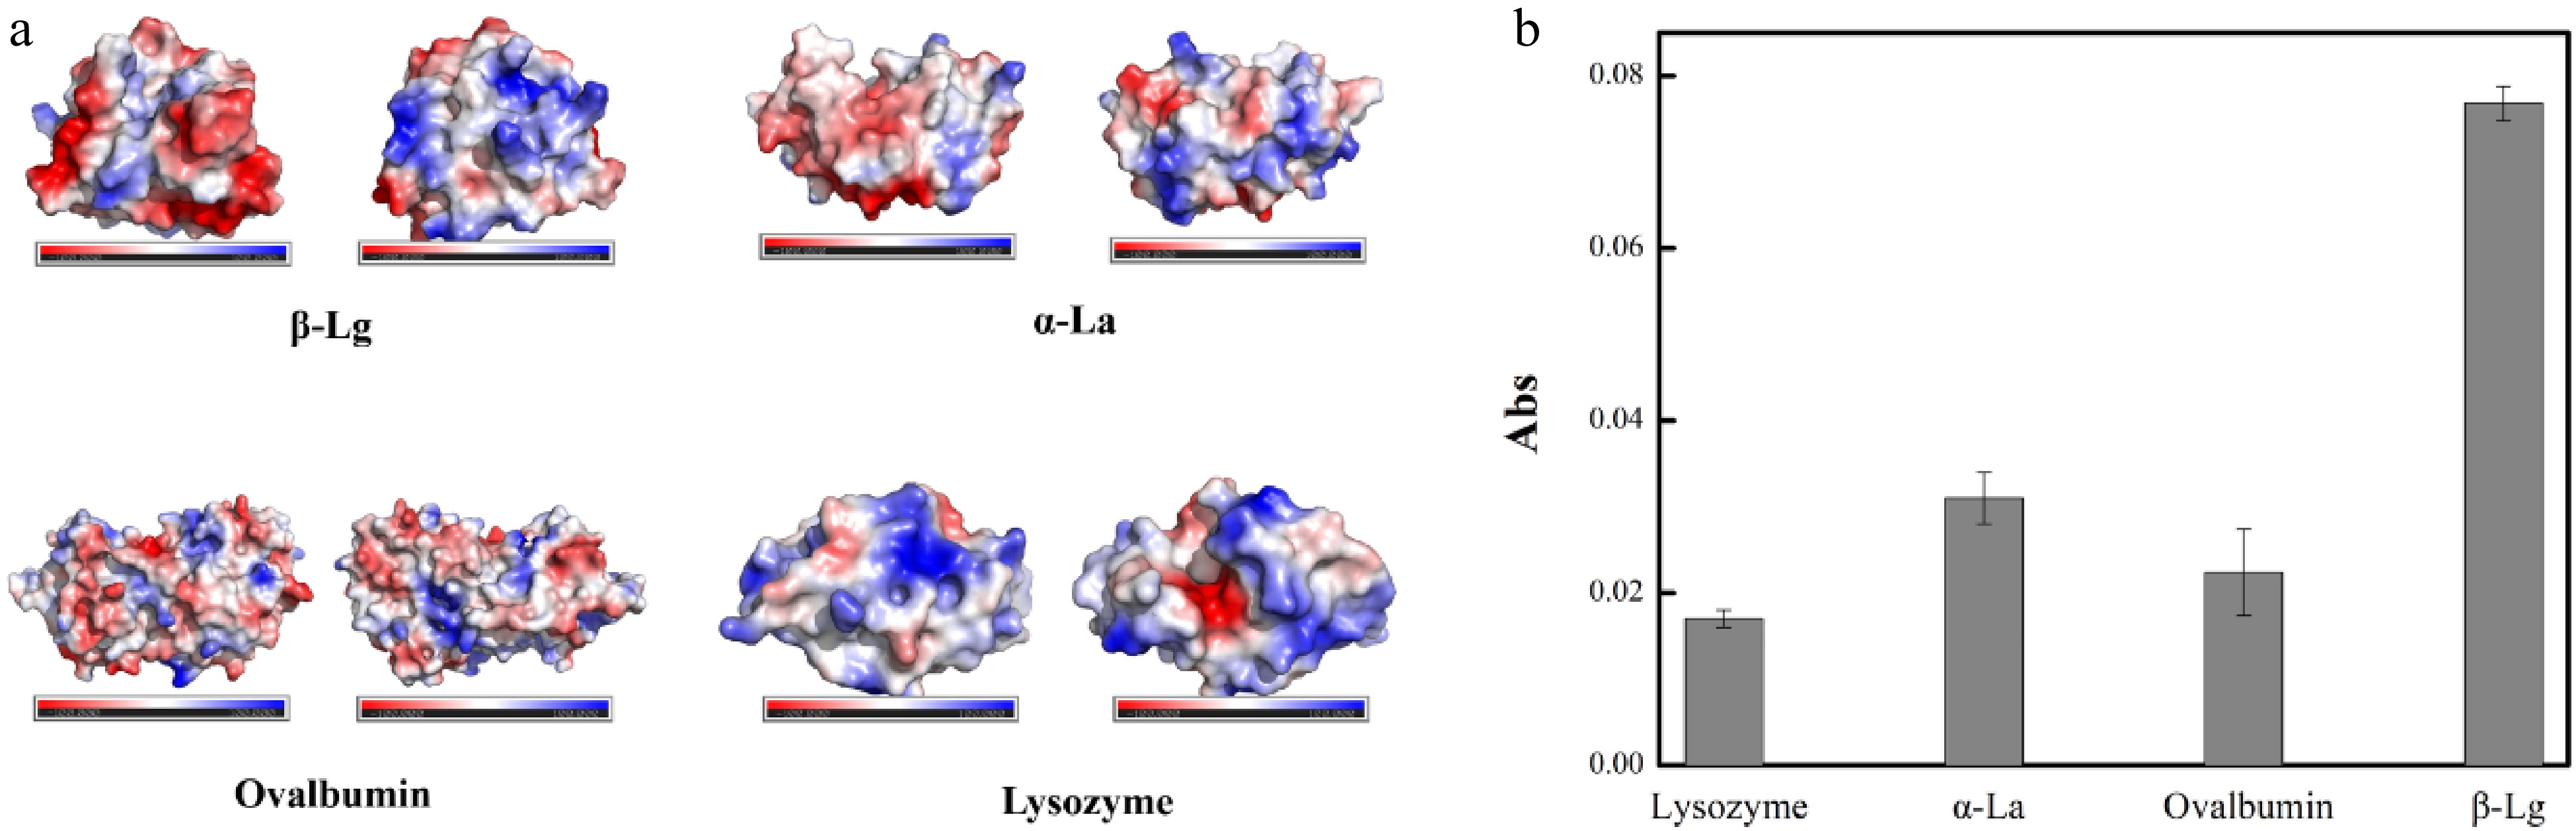
Figure 7.
(a) The nature and distribution of surface charge of β-Lg, lysozyme, α-La and ovalbumin. (b) The absorbance of the MB@Cu-MOF incubation with β-Lg (1 mg/mL), lysozyme (1 mg/mL), α-La (1 mg/mL) and Ovalbumin (1 mg/mL).
-
Sample ELISA (μg/mL) Modified sensor (μg/mL) Telunsu 17.09 ± 0.56 17.05 ± 0.55 Yili 15.54 ± 0.47 16.10 ± 0.10 Mengniu 15.47 ± 0.40 14.60 ± 0.60 Jindian 10.38 ± 0.02 10.85 ± 0.25 Table 1.
Comparison of β-Lg detection in real samples using the ELISA and modified sensors.
Figures
(7)
Tables
(1)