-
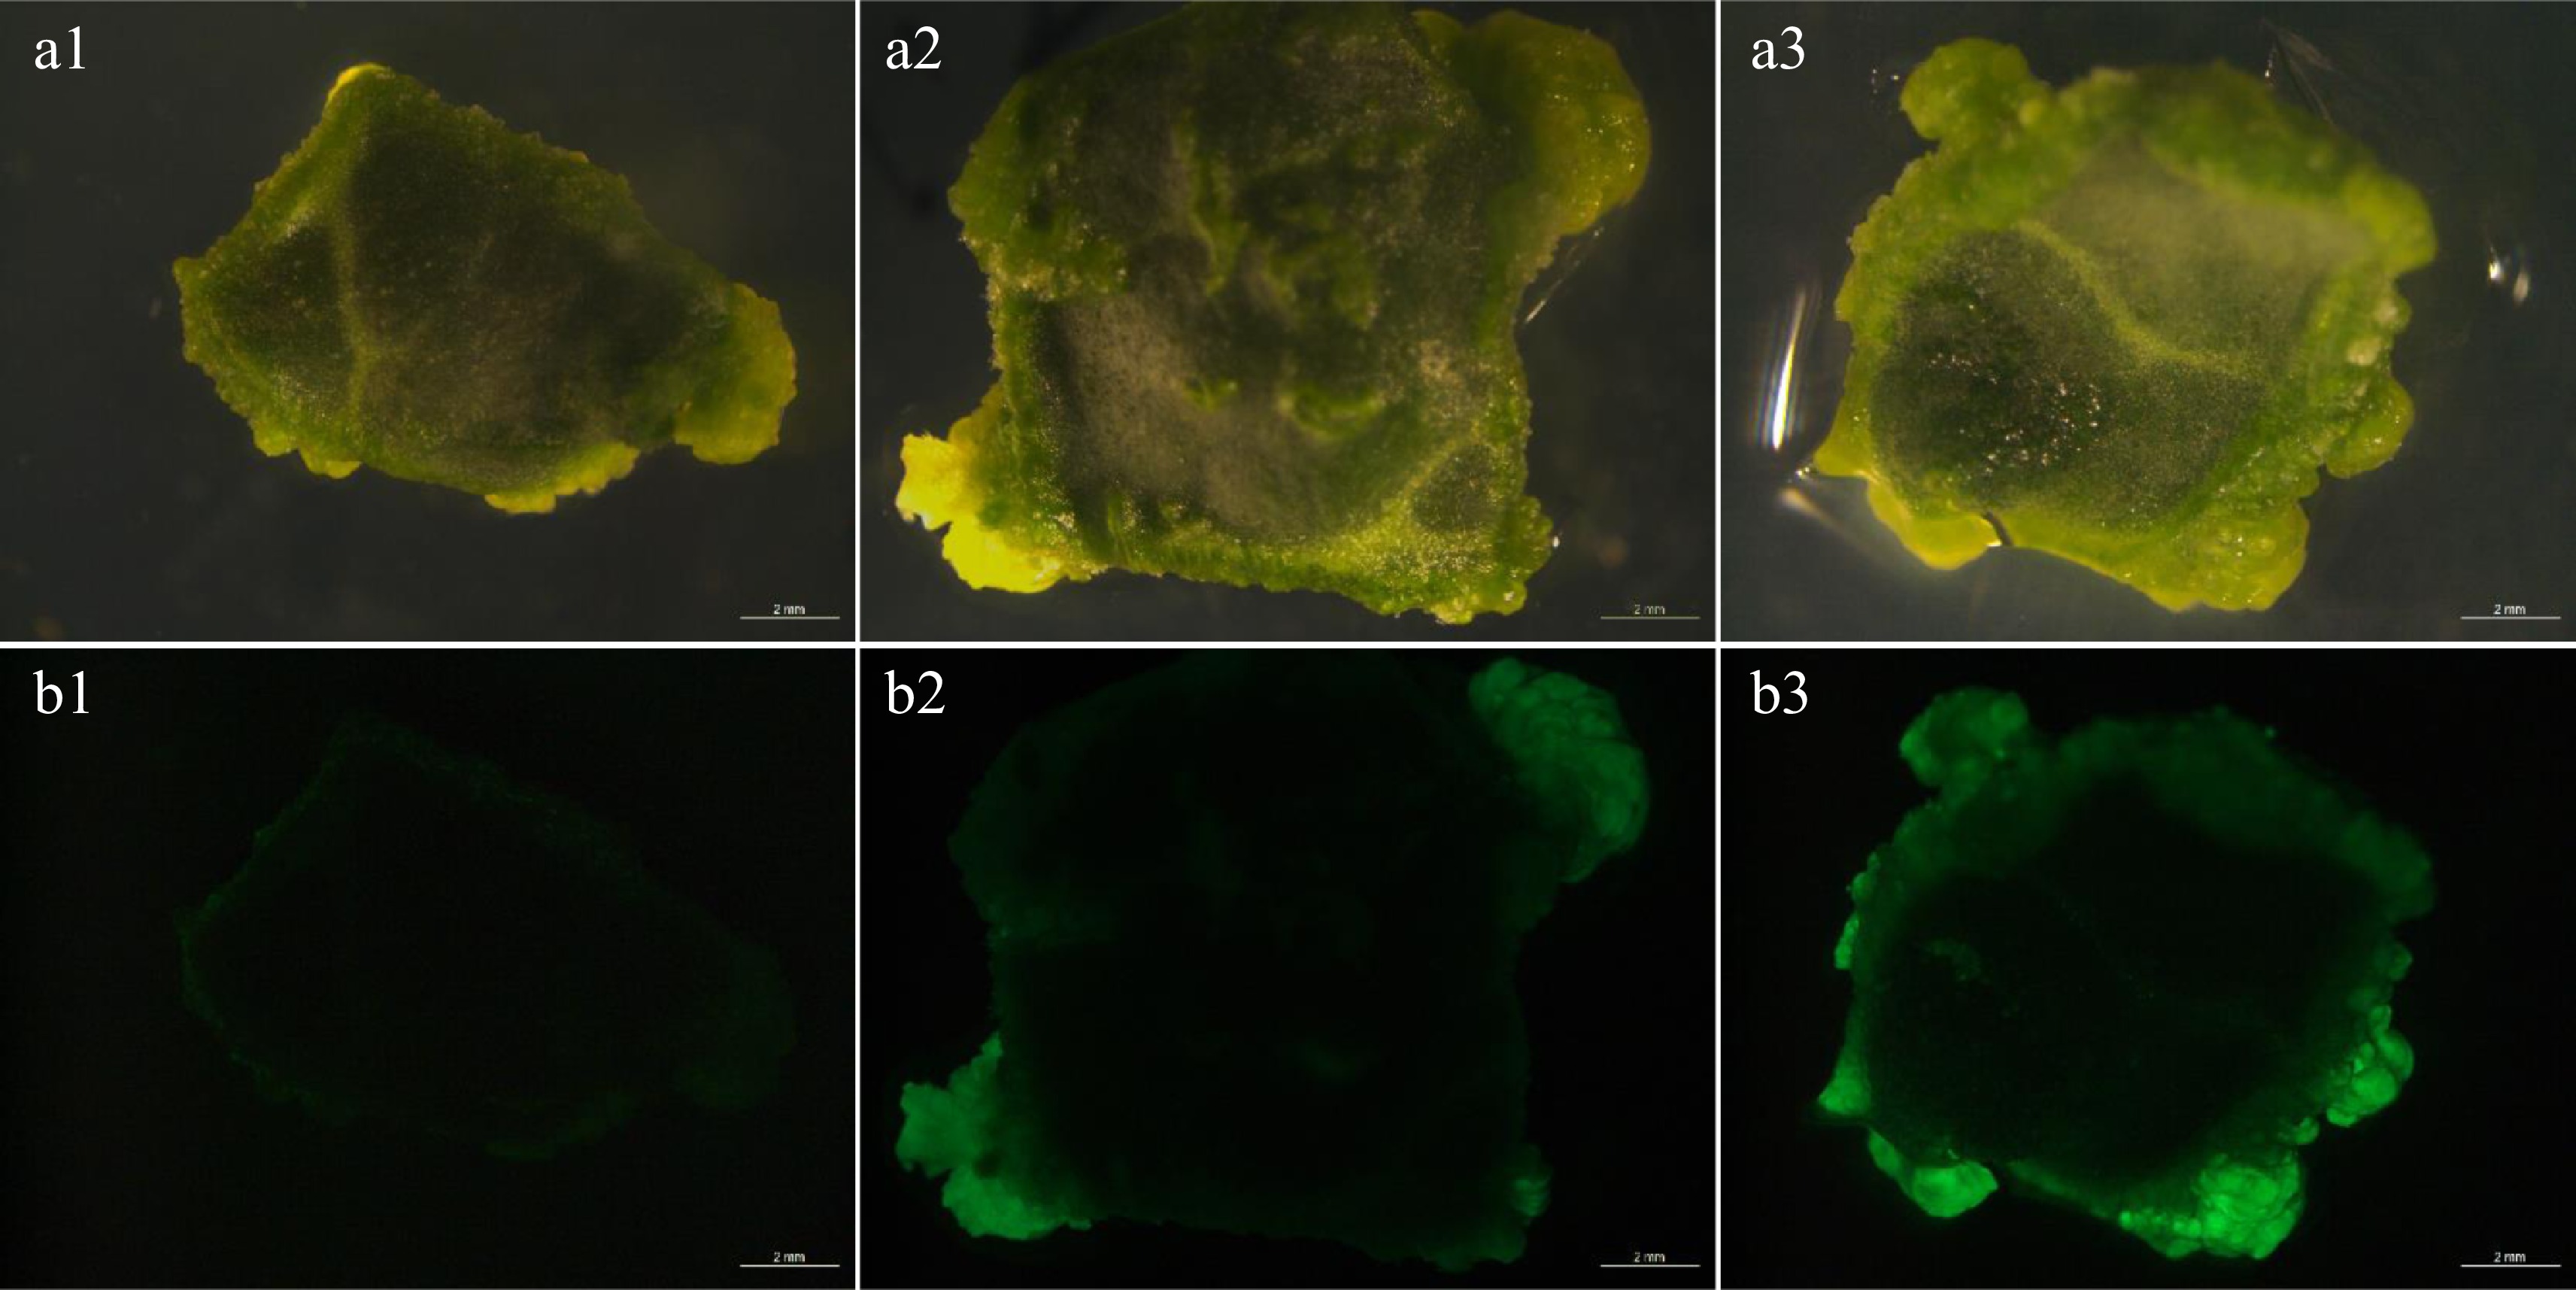
Figure 1.
Transient fluorescence of explants. (a1)−(a3) Bright view. (b1)−(b3) GFP view. (b1) The explants showed weak fluorescence after AGL1 infection. (b2) The explants showed moderate strong fluorescence after GV3101 infection. (b3) The explants showed strong fluorescence after EHA105 infection. Bar = 2 mm.
-
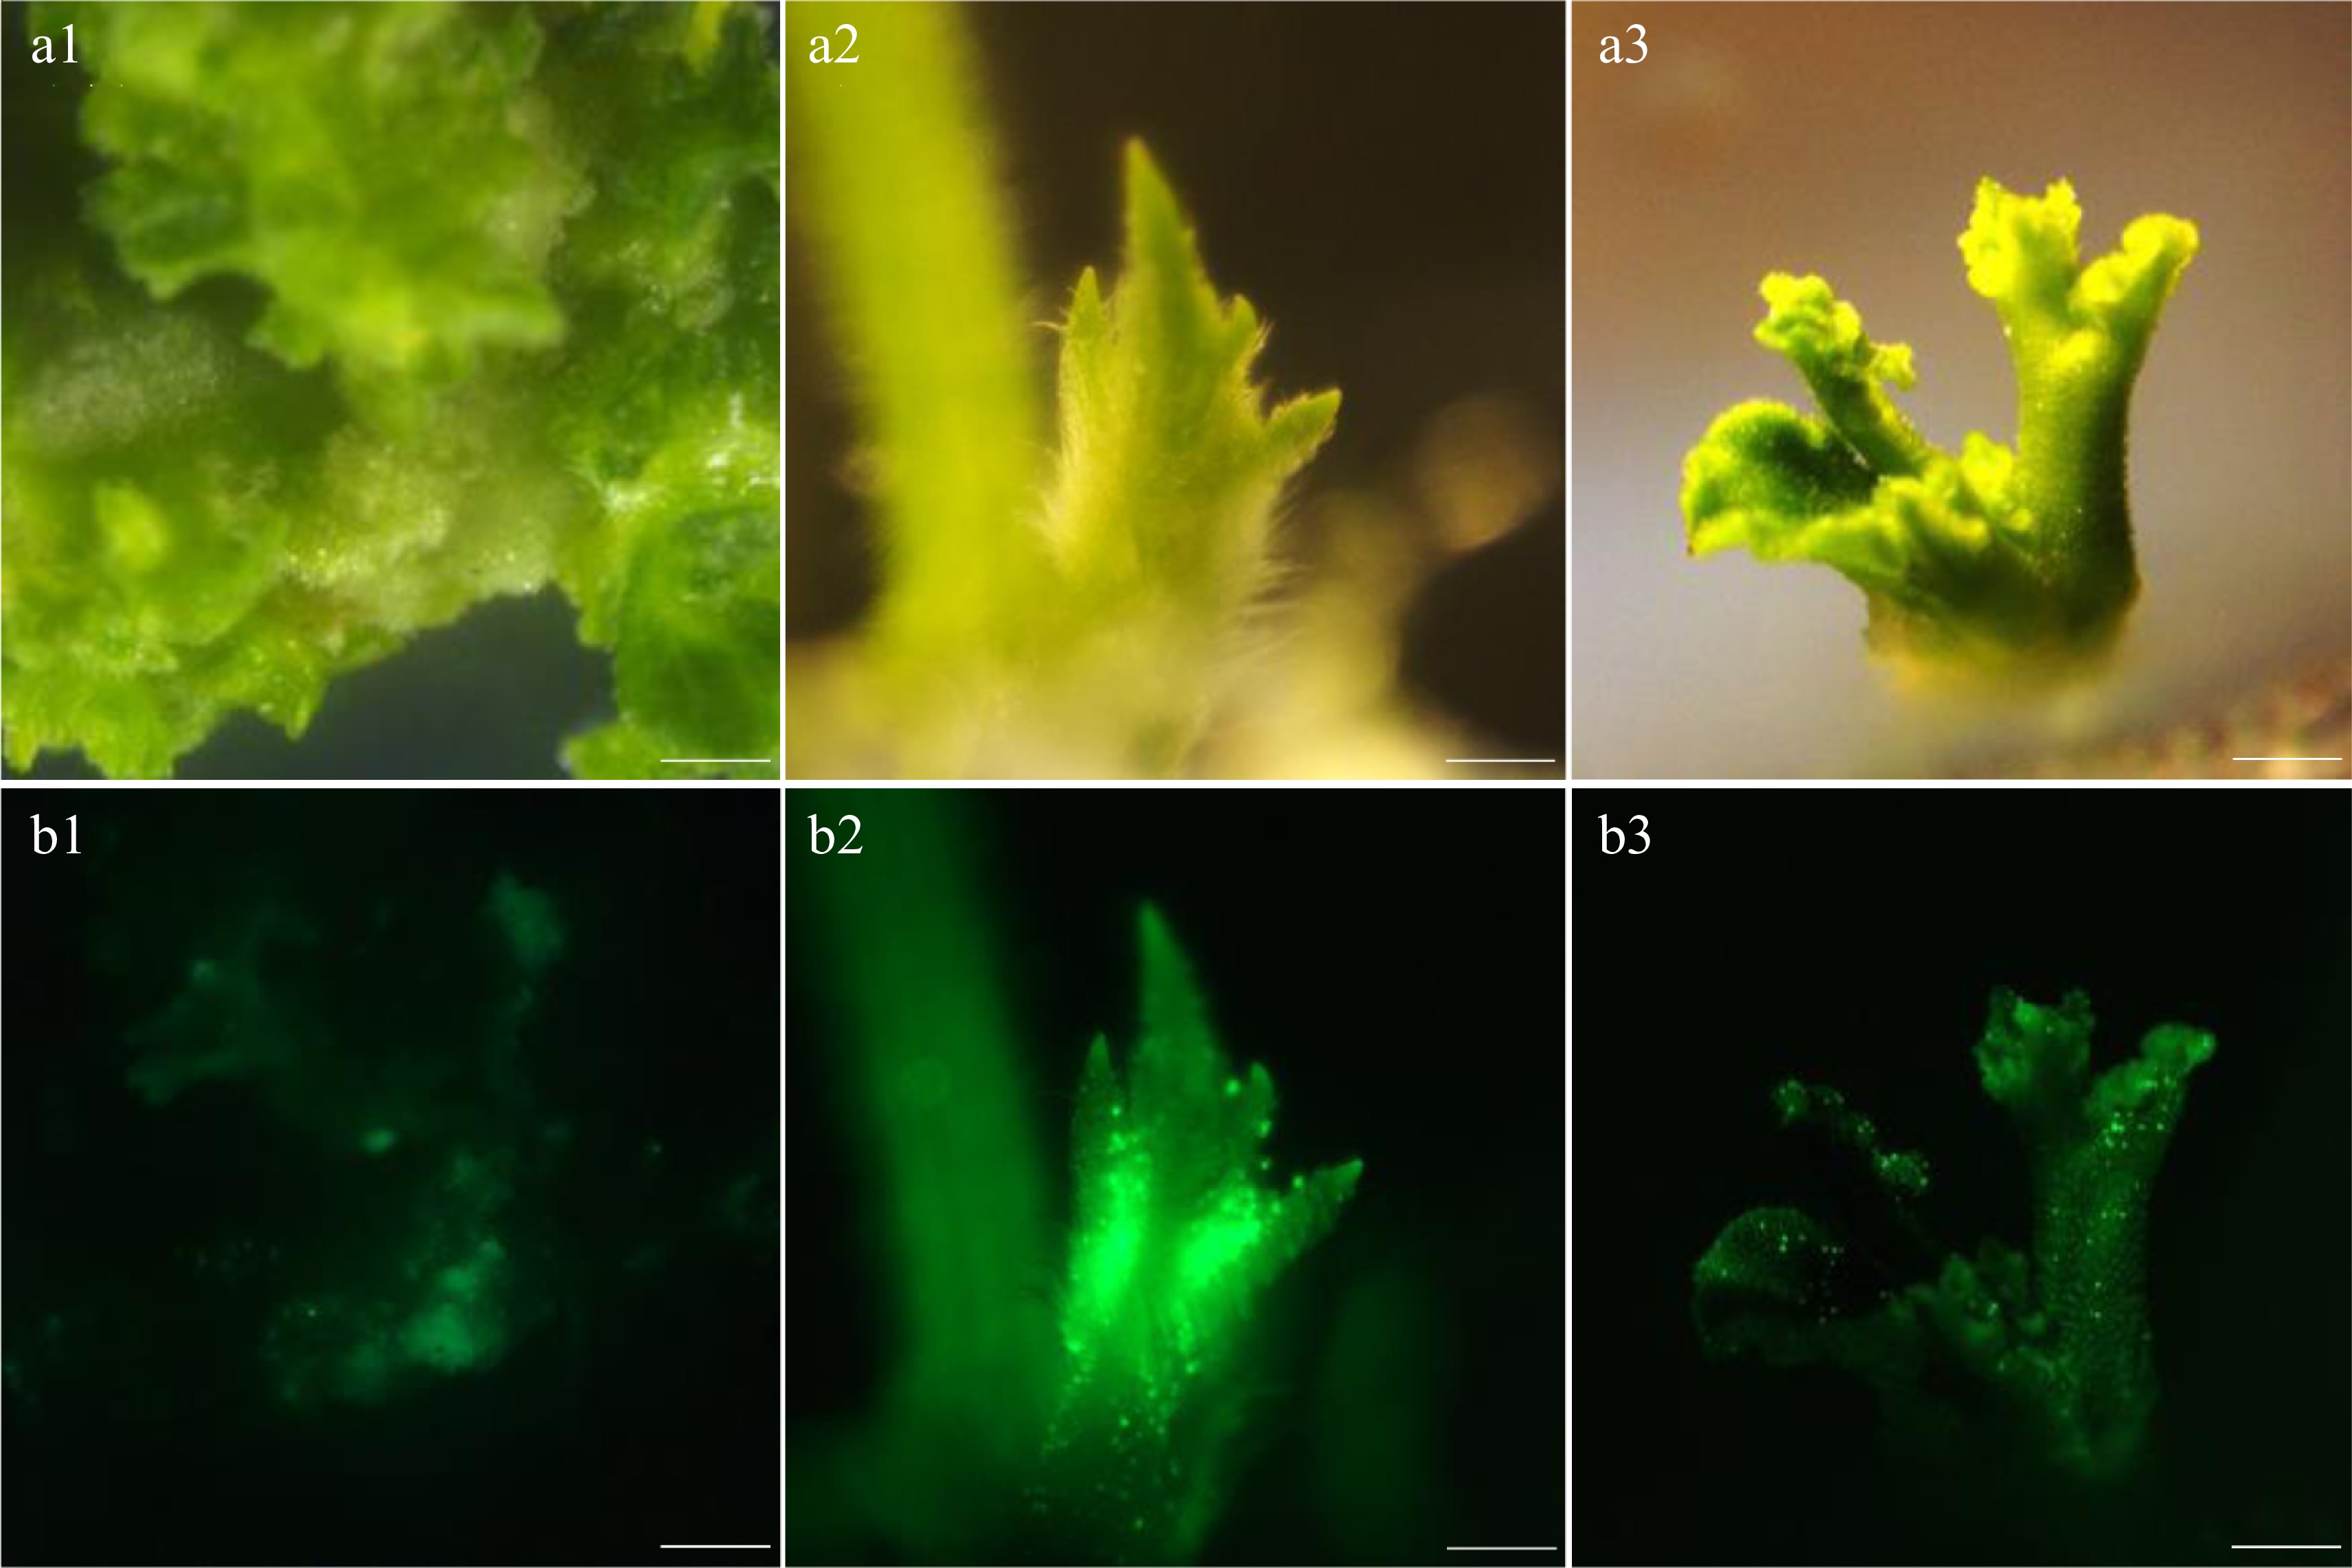
Figure 2.
Fluorescence intensity of the callus under different concentrations of AS. (a1)−(a3) Bright view. (b1)−(b3) GFP view. (a1), (b1) AS concentration at 100 µM. (a2), (b2) AS concentration at 200 µM. (a3), (b3) AS concentration at 300 µM. Bar=1 mm.
-
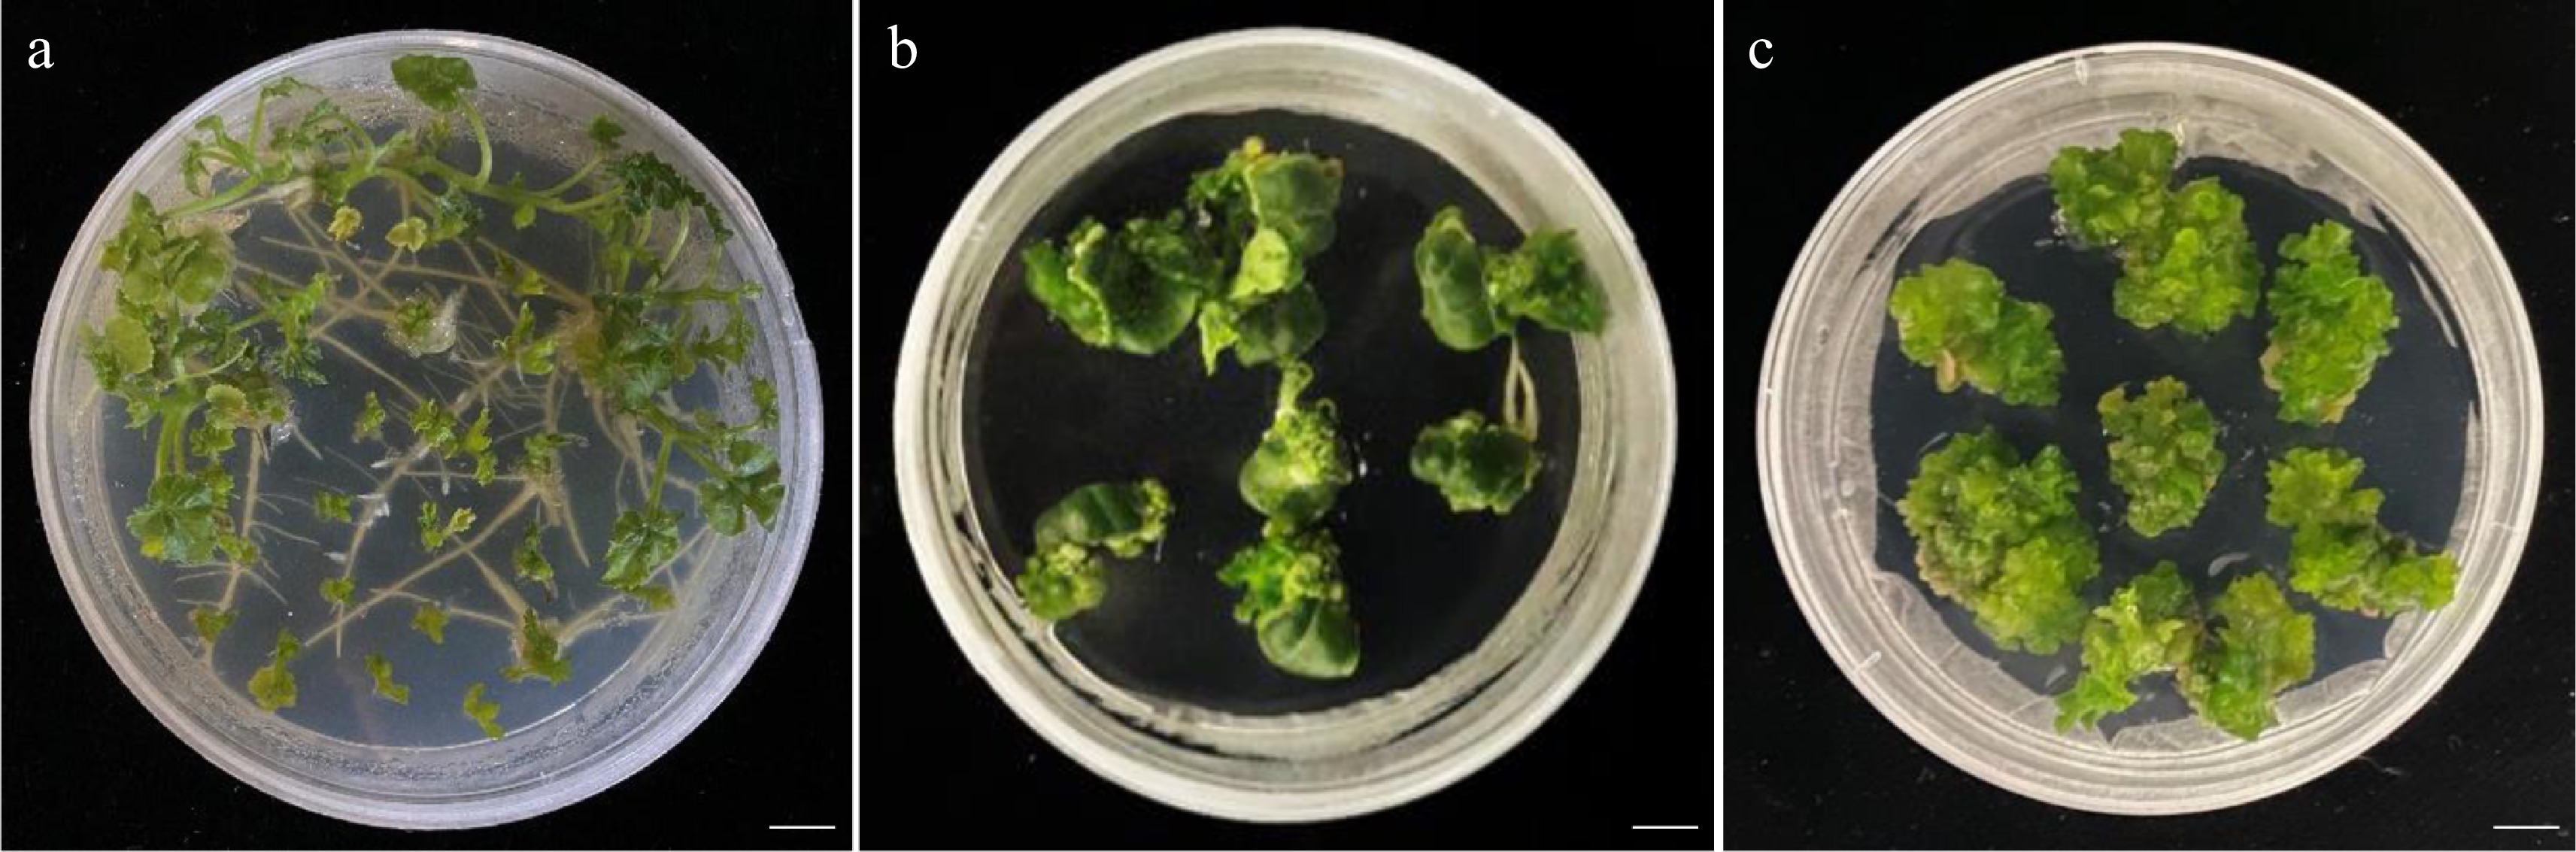
Figure 3.
Redifferentiation state of explants under different hormone concentrations. (a) The callus differentiated well under 0.1 mg/L concentration of 6-BA and 0.1 mg/L concentration of NAA. (b) The callus redifferentiated to form aerial roots under 0.15 mg/L concentration of 6-BA and 0.1 mg/L concentration of NAA. (c) The callus appeared to yellow and could not differentiate under 0.15 mg/L concentration of 6-BA and 0.05 mg/L concentration of NAA. Bar = 12 mm.
-
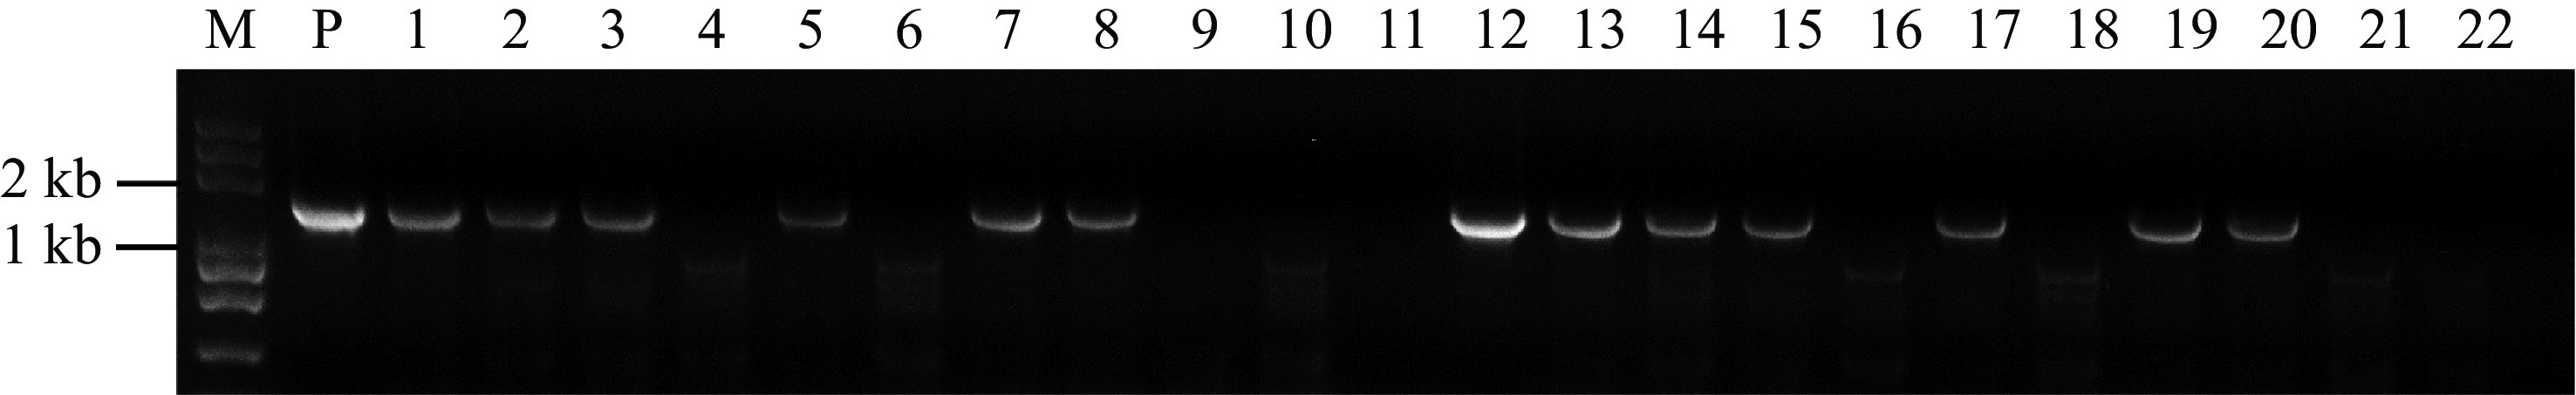
Figure 4.
PCR analysis of the transgenic plants. Genomic DNA isolated from putative transgenic plants were subjected to PCR amplification with Cas9 primers. Lane M, Trans2K Plus DNA Marker; Lane P, positive control (plasmid); Lanes 1, 2, 3, 5, 7, 8, 12, 13, 14, 15, 17, 19 and 20, putative transgenic watermelons; Lane 4, 6, 9, 10, 11, 16, 18, 21 and 22, Non-transgenic watermelon.
-
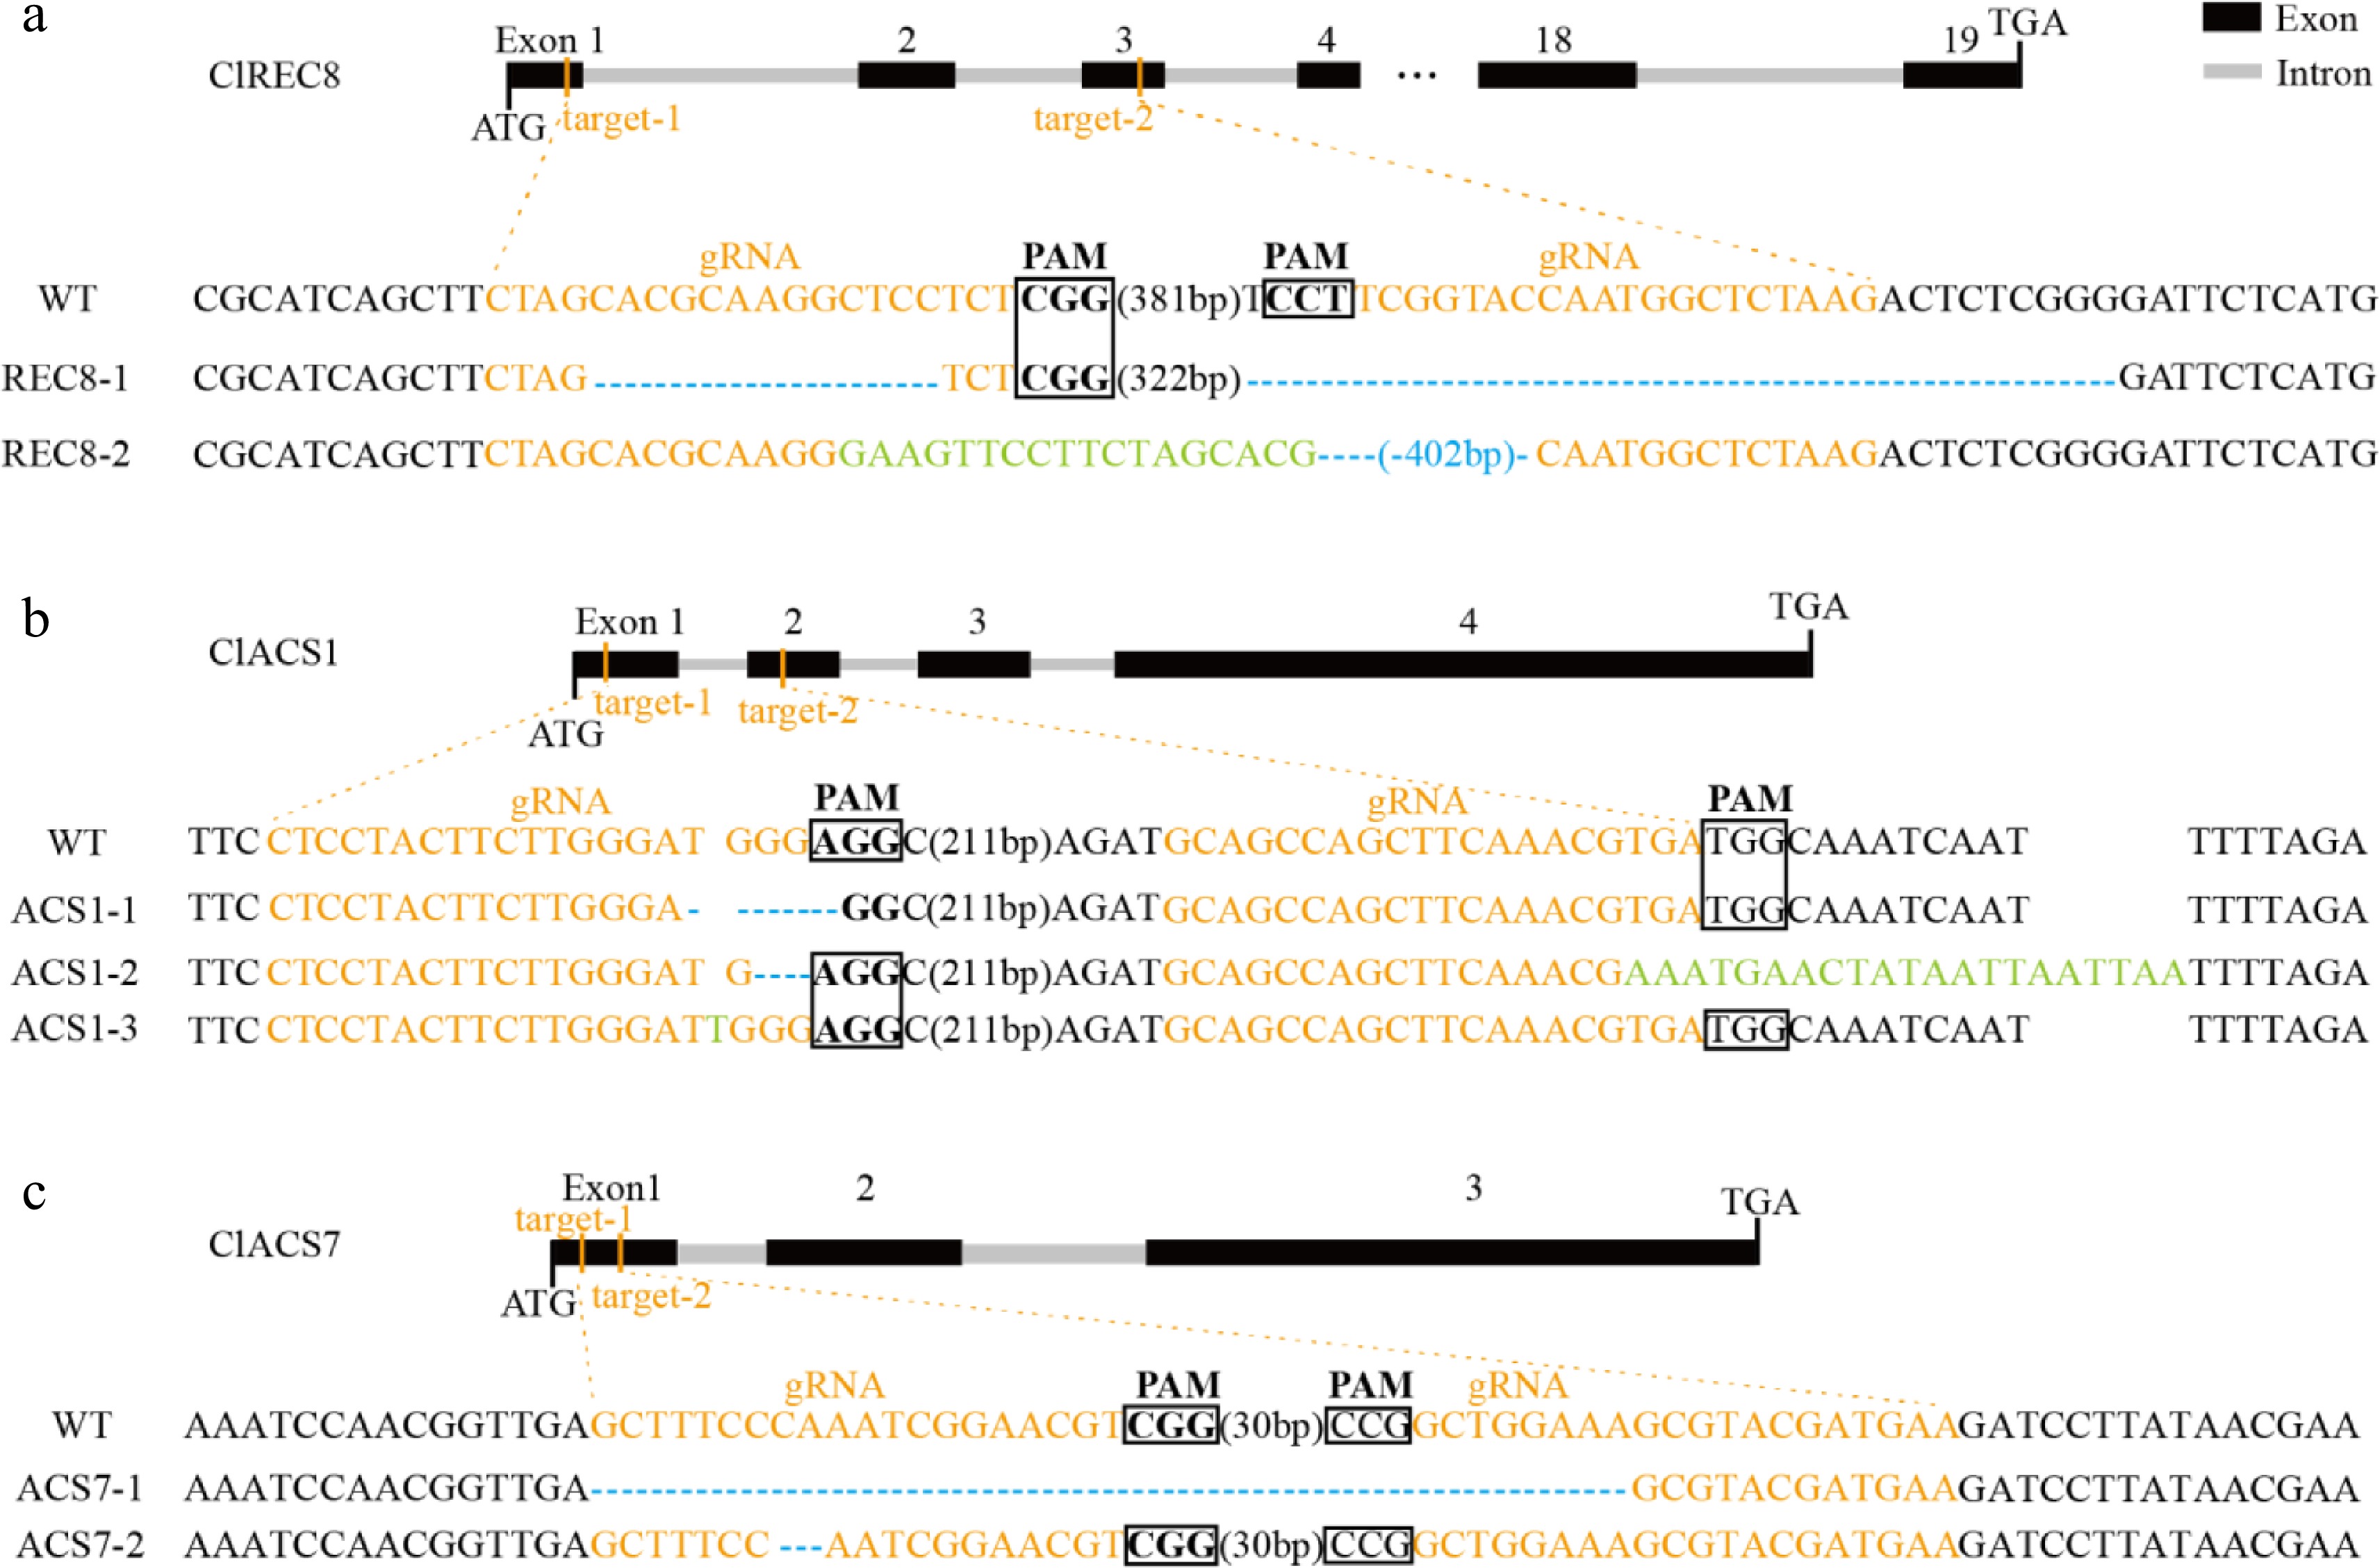
Figure 5.
Targeted mutagenesis of (a) ClREC8, (b) ClACS1, and (c) ClACS7 in the transgenic lines. The schematic diagrams illustrate sgRNA targeting the exons. The target sequences are shown in orange with protospacer adjacent motifs (PAM) sequence highlighted with black rectangles. Nucleotide deletions are shown with blue dashes, and inserted nucleotides are shown in green.
-
AS treatment
(µM)Fluorescence efficiency (%) Number of fluorescent explants Fluorescence brightness Callus differentiation state 0 45.3 ± 0.05d 54 ++ The calli were green and compact. There was no contamination and little vitrification 100 68.8 ± 0.03b 82 +++ The calli were densely arranged with dark green, fluorescent speckles and little vitrification 150 75.0 ± 0.02b 90 ++++ The calli were densely arranged and appeared dark green with bright fluorescence and little vitrification 200 85.0 ± 0.05a 102 +++++ The calli were densely arranged and appeared dark green with bright fluorescence and little vitrification 250 69.3 ± 0.04b 83 ++++ Most calli were densely arranged, and a few turned pale and yellowed with water stain 300 54.7 ± 0.05c 65 ++++ The calli were closely arranged, partly vitrified with dark green and contaminated by bacteria Fluorescence efficiency = Number of fluorescence explants/Total explants number × 100%. Values are means (three independent experiments) ± standard errors (SE), and different letters indicate significant differences between treatments according to Duncan's multiple test (P < 0.05). Table 1.
Fluorescence efficiencies, brightness and differentiation states of watermelon explants under different AS concentrations.
-
Combination Agrobacterium concentration (OD600) Coculture time
(days)Fluorescence efficiency
(%)Fluorescence brightness A 0.6 2 42.5 ± 1.5b +++ B 0.2 2 54.4 ± 1.4a ++ C 0.02 2 38.5 ± 1.8b + D 0.005 2 33.3 ± 0.3c + E 0.6 3 38.1 ± 1.1c + F 0.2 3 43.0 ± 2.0bc ++ G 0.02 3 79.1 ± 0.9a +++ H 0.005 3 47.1 ± 0.5b + I 0.6 4 35.5 ± 1.4c + J 0.2 4 44.5 ± 2.6b + K 0.02 4 79.1 ± 0.6a +++ L 0.005 4 51.5 ± 2.5b ++ Fluorescence efficiency = Number of fluorescence explants/Total explants number × 100%. Values are means (three independent experiments) ± standard errors (SE), and different letters indicate significant differences between treatments according to Duncan's multiple test (P < 0.05). Table 2.
Transient fluorescence efficiencies and brightness of watermelon explants under different concentrations of Agrobacterium tumefaciens infection solution and co-culture times.
-
Combination Growth state A A small part died, and the margin of the surviving explants were yellow with obvious water-stained flora B The edges showed traces of a watery microflora C The explants were well developed D The explants were well developed E Some died with serious spillage, and fluorescence
explants were browningF A small portion were dead and the margins browned G The explants dilated well H The explants dilated well I Most died with serious spillage phenomenon, and
virtually all the edges brownedJ Partially dead with serious spillage and serious edge browning K Partially edged with yellow and with spillage phenomenon L The explants were well developed Table 3.
Growth states of watermelon explants under different Agrobacterium tumefaciens infection solution and co-culture times.
-
Basta concentration
(mg/L)Callus survival rate
(%)Fluorescence rate of
survival callus (%)Callus state 0.4 100.0 ± 0.0a 69.1 ± 4.1c The tissues appeared dark green and grew well 1.4 73.6 ± 0.4b 78.7 ± 0.3b Partial tissues appeared brown and most grew well 2.4 73.0 ± 3.0b 80.5 ± 1.5b Partial tissues were transparent and light green with serious vitrification 3.4 40.8 ± 1.2c 92.0 ± 2.9a Partial tissues died with serious yellowing phenomenon and obvious spillage 4.4 0.7 ± 0.3d 0.7 ± 0.3d Most tissues died, and the spillage was obvious Callus survival rate = Survival callus number/Total callus number × 100%; Fluorescence rate of survival callus = Survival callus number with fluorescence/Total survival callus number. Values are means (three independent experiments) ± standard errors (SE), and different letters indicate significant differences between treatments according to Duncan's multiple test (P < 0.05). Table 4.
The survival rates and growth states of callus under different concentrations of Basta.
-
6-BA (mg/L) NAA (mg/L) Shoot regeneration
rate (%)Adventitious shoot growth state 0.05 0.05 10.3 ± 1.8c The adventitious shoots differentiated less and had serious vitrification 0.1 0.05 22.0 ± 1.0b Less differentiation, and vitrification was not serious 0.15 0.05 32.4 ± 2.6a Less differentiation, some shoots unable to continue to elongate and showed yellowing 0.05 0.1 29.2 ± 0.7b Less differentiation, calli partly yellowed and vitrified 0.1 0.1 64.5 ± 5.5a With more differentiation, calli partly vitrified without yellowing phenomenon 0.15 0.1 45.6 ± 3.8b More differentiation, shoots partly yellowed with a small amount producing air roots Shoot regeneration rate = Number of regerminated shoots/Total explants number × 100%. Values are means (three independent experiments) ± standard errors (SE), and different letters indicate significant differences between treatments according to Duncan's multiple test (P < 0.05). Table 5.
Adventitious shoot elongation efficiencies and shoot growth states under different concentrations of hormones.
Figures
(5)
Tables
(5)