-

Figure 1.
Associations of the DNA quantity or 'Candidatus Liberiabcter asiaticus' titers with the weight of (a) leaf midrib or (b) bark tissue from sour tangerine (Citrus sunki Hort. ex Tanaka) seedlings.
-
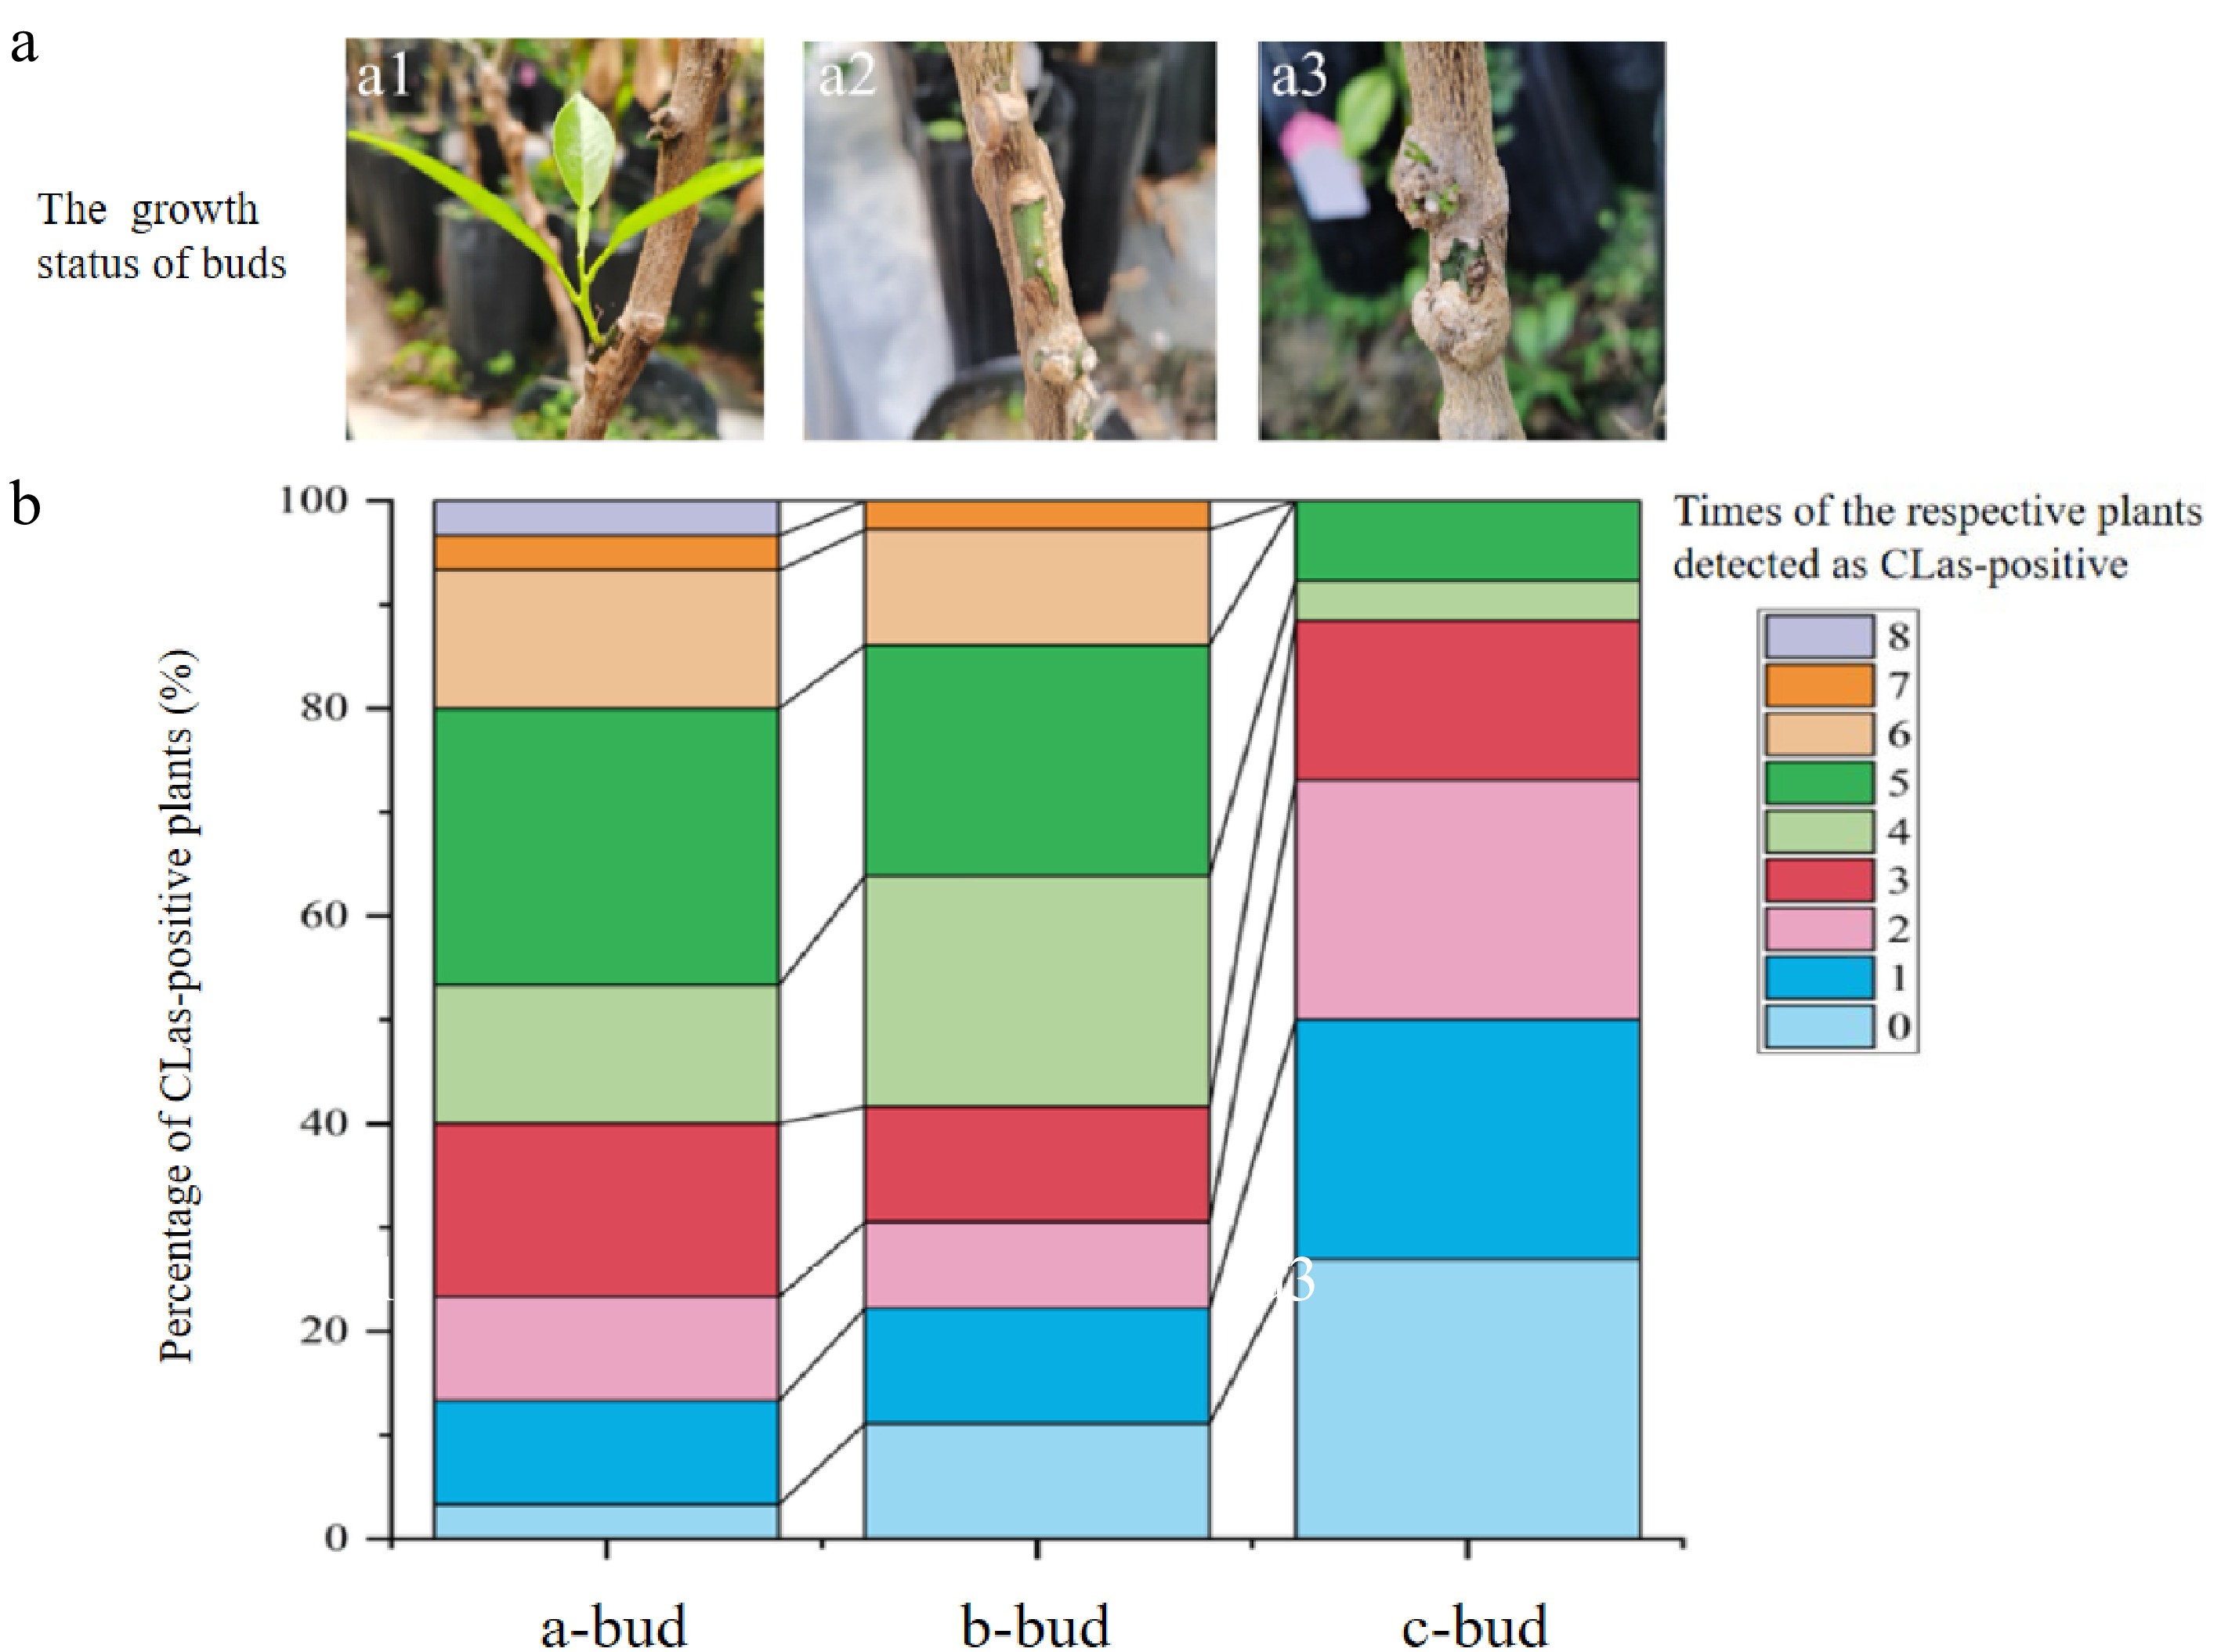
Figure 2.
Different growth status of buds carrying 'Candidatus Liberibacter asiaticus' used for graft inoculation (a) and percentage stacking of the number of months that plants with different buds were positive for CLas (b). (a1) The 'Candidatus Liberibacter asiaticus' (CLas)-infected donor buds were in vigorous growth after grafting. A total of 30 stock plants were with 'a-bud' . (a2) The buds were in moderate growth condition after grafting. A total of 36 acceptor plants were with 'b-bud'. (a3) The buds with poor growth status on stock seedlings after grafting. A total of 26 stock seedlings were with 'c-bud'.
-

Figure 3.
Schematic diagram of (a) side grafting, (b) T grafting and (c) V grafting.
-
Sample weight (g) DNA concentration
(ng/µL)Ct No of CLas per ng DNA No of CLas per g sample and per ng DNA 0.1000 346.80 ± 8.55a 20.59 ± 0.27 437.99 ± 0.18a 4379.88 ± 1.78c 0.0500 302.32 ± 32.65a 20.81 ± 0.18 327.38 ± 14.86b 6547.54 ± 297.13c 0.0250 209.01 ± 9.05b 20.99 ± 0.09 455.11 ± 11.93a 18204.47 ± 477.17b 0.0125 93.24 ± 13.42c 21.98 ± 0.23 443.26 ± 28.64a 35460.98 ± 2291.10a 0.0063 67.27 ± 4.58c 24.88 ± 1.25 41.52 ± 11.59c 6591.01 ± 1839.16c 0.1000 569.70 ± 4.63a 25.52 ± 0.71 4.79 ± 1.55d 47.89 ± 15.48c 0.0500 410.17 ± 24.84b 21.51 ± 0.04 161.35 ± 6.90c 3227.05 ± 138.04b 0.0250 255.51 ± 17.53c 21.76 ± 0.15 218.51 ± 13.48b 8740.35 ± 539.30b 0.0125 133.12 ± 6.73d 22.66 ± 0.69 360.91 ± 9.14a 28873.06 ± 731.36a 0.0063 66.78 ± 2.89e 24.21 ± 0.16 154.34 ± 21.75c 24498.65 ± 3452.89a Data in the table are showed as mean ± standard error (SE). Data of the first five lines are for leaf midrib samples, while the later five lines are for the shoot bark samples. The statistic analysis was carried out separately between sample weight and each of the six groups of relative index separately. Table 1.
DNA quantity and 'Candidatus Liberibcter asiaticus titer' titers of the samples from leaf midrib or bark tissues of sour tangerine (Citrus sunki Hort. Ex Tanaka) seedlings.
-
Time Grafting method Side grafting 'T' grafting 'V' grafting 4 MAG Success rate 16.7%ab 41.7%a 16.7%ab CLas concentration* 35.71 ± 25.83 269.40 ± 97.35 295.61 ± 168.07 Average Ct 25.65 ± 0.96 23.21 ± 0.39 22.78 ± 0.88 5 MAG Success rate 25.0%bc 83.3%a 41.7%b CLas concentration* 171.51 ± 138.89 139.30 ± 28.85 135.07 ± 29.65 Average Ct 25.03 ± 0.95 23.00 ± 0.23 22.76 ± 0.43 6 MAG Success rate 33.3%c 83.3%a 33.3%c CLas concentration* 78.29 ± 18.67 213.69 ± 74.35 232.99 ± 78.33 Average Ct 23.67 ± 0.39 24.66 ± 0.64 23.31 ± 0.22 7 MAG Success rate 33.3%bc 83.3%a 41.7%b CLas concentration* 107.38 ± 28.00 164.86 ± 29.64 266.92 ± 76.64 Average Ct 23.72 ± 0.53 23.78 ± 0.55 24.21 ± 0.53 8 MAG Success rate 33.3%bc 83.3%a 41.7%b CLas concentration* 204.82 ± 63.54 111.26 ± 18.72 83.67 ± 28.61 Average Ct 25.53 ± 1.48 25.25 ± 0.38 26.18 ± 0.54 MAG, Month-after-grafting. Statistic analysis was done horizontally in the table, indicating the differences among different grafting methods.
* The unit of CLas concentration is copy number per ng DNA. The significance analysis was performed with letter markers such as a, b, and c. The difference is not significant if the marked letters are the same, and vice versa.Table 2.
The successful transmission rate and effect of different grafting methods.
-
Time Numbers of buds One bud Two buds Three buds 4 MAG Success rate 13.3%ab 33.3%a 33.3%a CLas concentration* 35.71 ± 25.83 45.81 ± 14.51 231.58 ± 147.16 Average Ct 25.65 ± 0.96 25.19 ± 0.59 25.29 ± 1.74 5 MAG Success rate 20.0%b 80.0%a 66.7%a CLas concentration* 171.51 ± 138.89 153.61 ± 39.57 93.99 ± 16.63 Average Ct 25.03 ± 0.95 24.30 ± 0.48 24.39 ± 0.53 6 MAG Success rate 26.7%bc 73.3%a 53.3%ab CLas concentration* 78.29 ± 18.67 206.20 ± 37.25 158.53 ± 38.07 Average Ct 23.67 ± 0.39 24.62 ± 0.26 25.91 ± 0.69 7 MAG Success rate 26.7%c 93.3%a 66.7%b CLas concentration* 107.38 ± 28.00 180.34 ± 36.64 61.94 ± 12.32 Average Ct 23.72 ± 0.53 23.25 ± 0.51 24.19 ± 0.36 8 MAG Success rate 26.7%c 93.3%a 66.7%b CLas concentration* 204.82 ± 63.54 68.42 ± 14.07 55.99 ± 18.69 Average Ct 25.53 ± 1.48 26.52 ± 0.38 26.46 ± 0.51 MAG, Month-after-grafting. Statistic analysis was carried out horizontally in the table, indicating the differences among different number of buds.
* The unit of CLas concentration is copy number per ng DNA.Table 3.
The successful transmission rate and effect of the numbers of grafting buds on HLB transmission by grafting.
Figures
(3)
Tables
(3)