-

Figure 1.
Radiation (MJ m−2 day−1), average daily temperature (°C) during rice growing periods in 2017 and 2018. The climate data regarding daily radiation and air temperature were measured at a meteorological station located within 3 km of the experimental site. The daily solar radiation and temperature were measured by a silicon pyranometer (LI-200, LI−COR Inc., Lincoln, NE, USA) and a temperature/RH probe (HMP45C, Vaisala Inc., Helsinki, Finland), respectively.
-
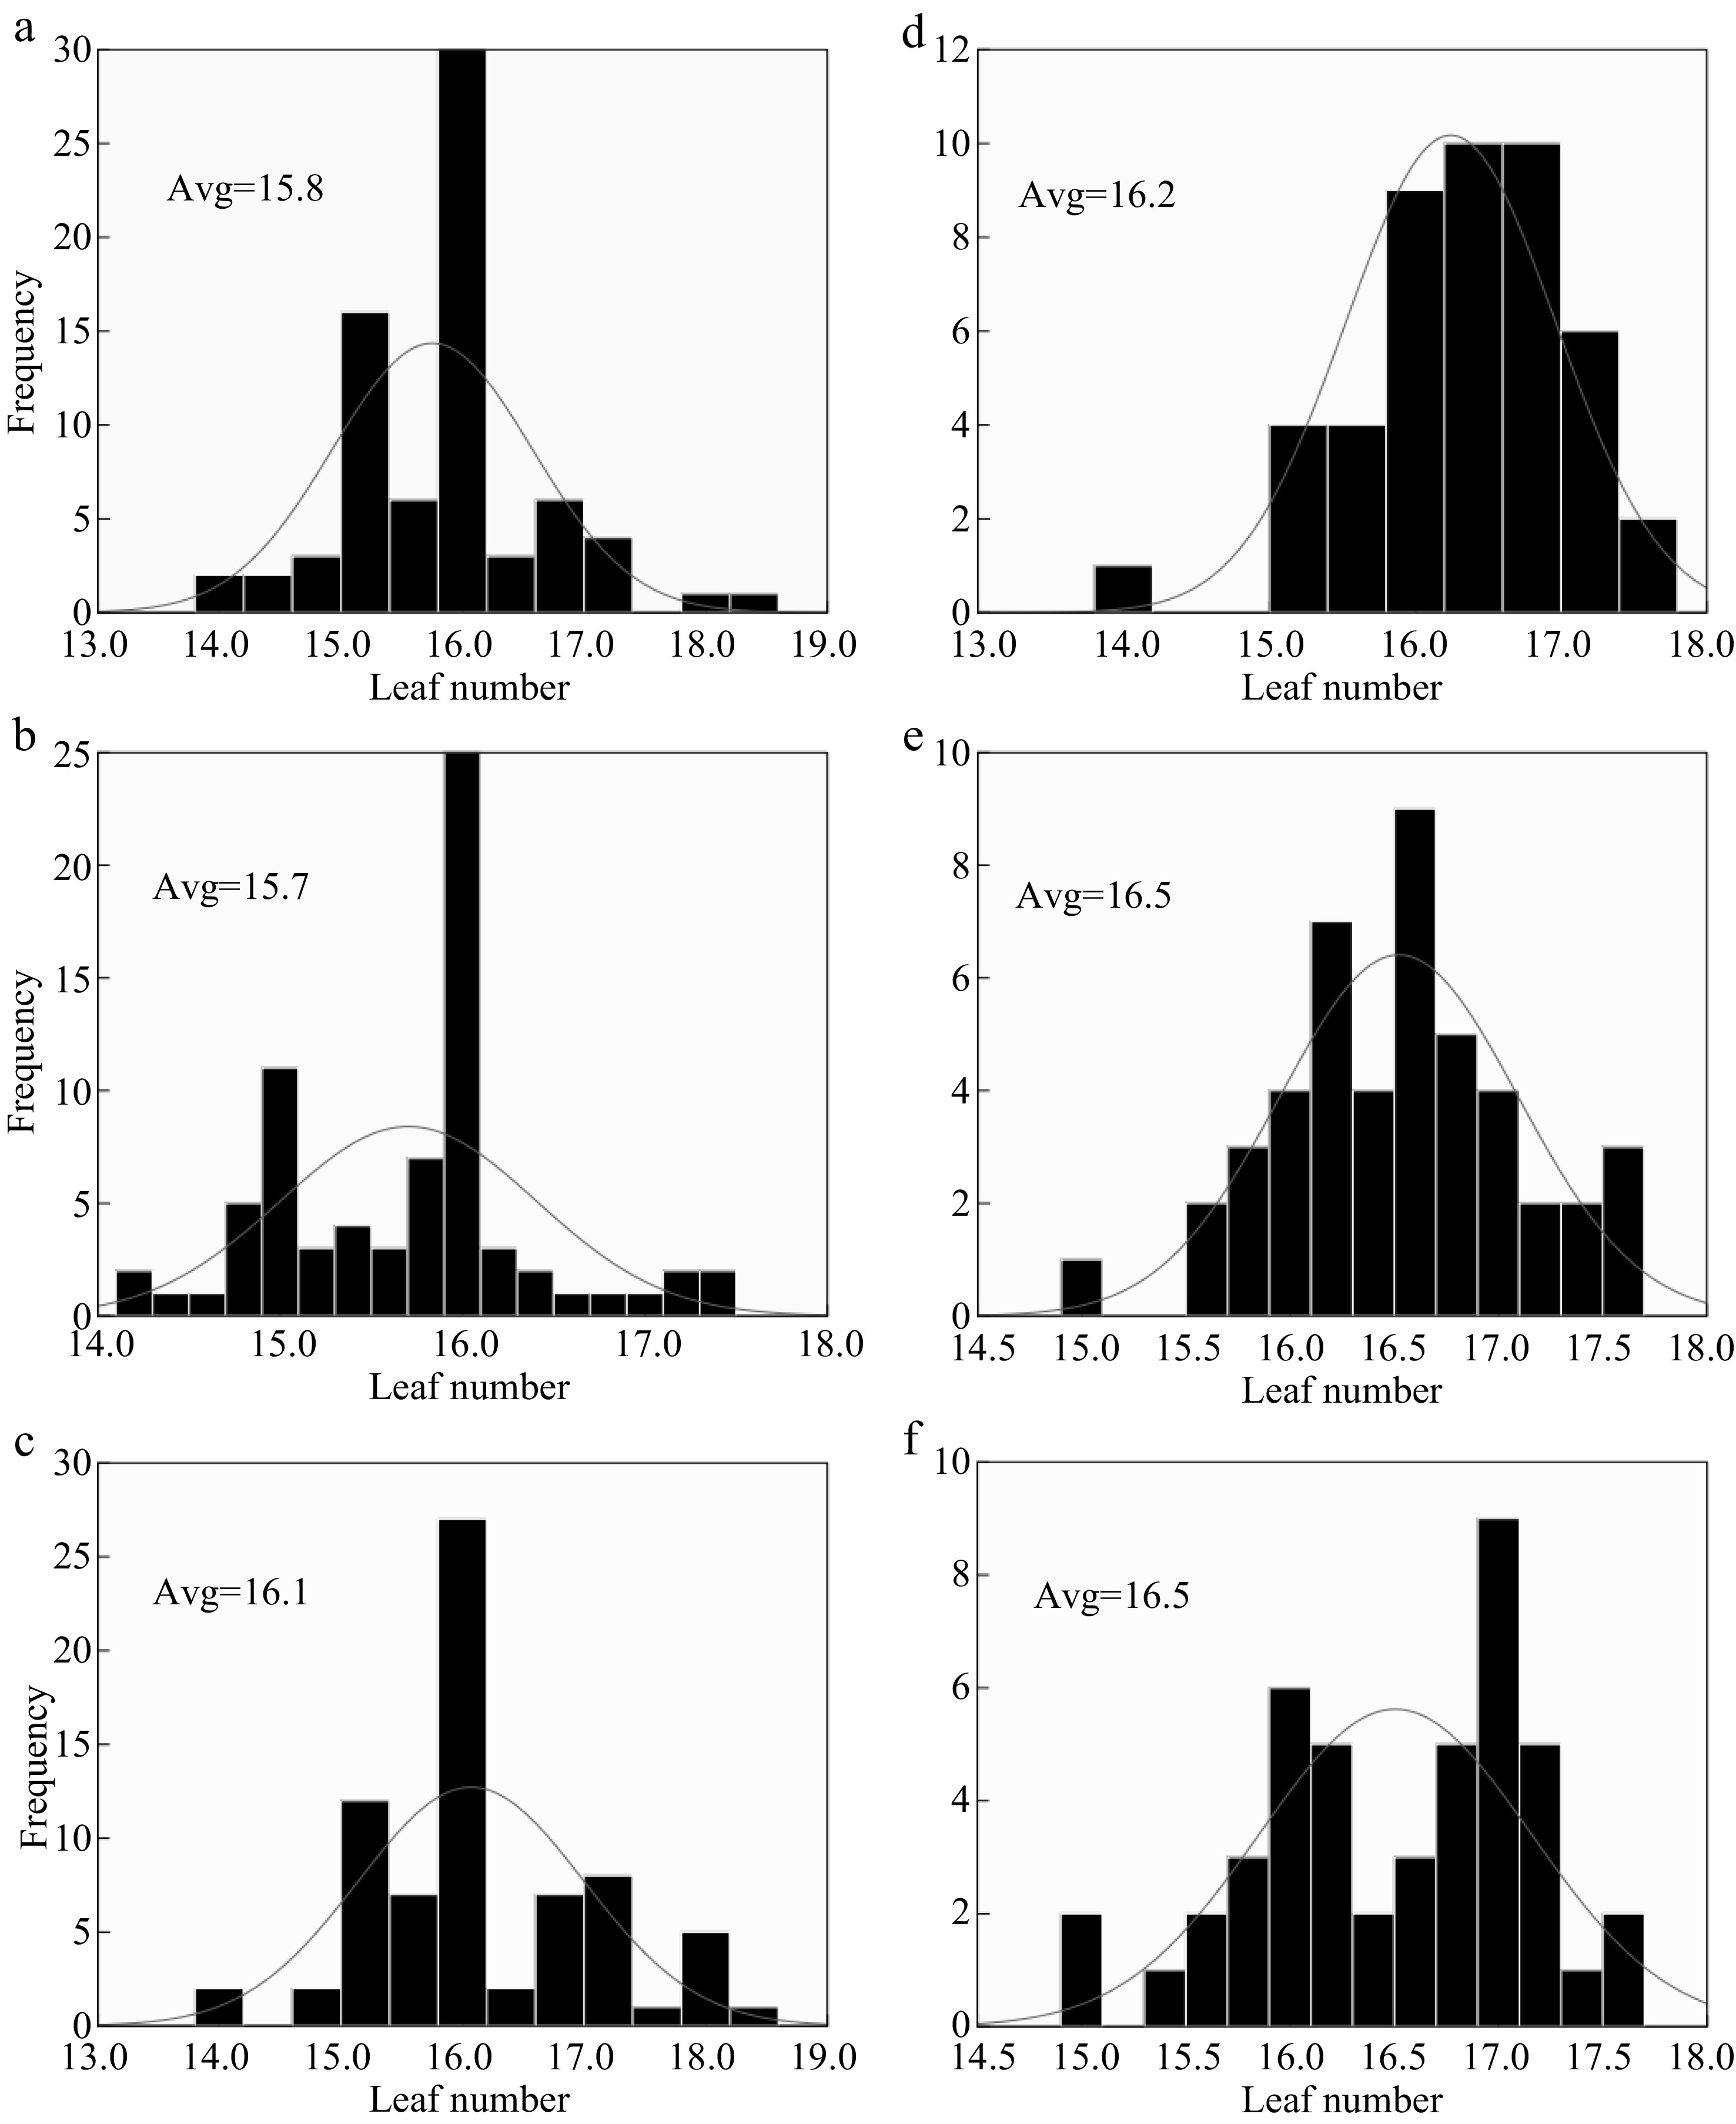
Figure 2.
The response of LN to different N rates in two years 2017 (a), (b), (c) and 2018 (d), (e), (f). (a), (b), (c) and (d), (e), (f) represent N0, N150, N300 nitrogen rates for 2017 and 2018 respectively; Avg. - an average of LN at each nitrogen rate. Comparing the range of the LN at each nitrogen rate between the two years N0 N150 and N300 were 0.4, 0.8 and 0.4, respectively.
-
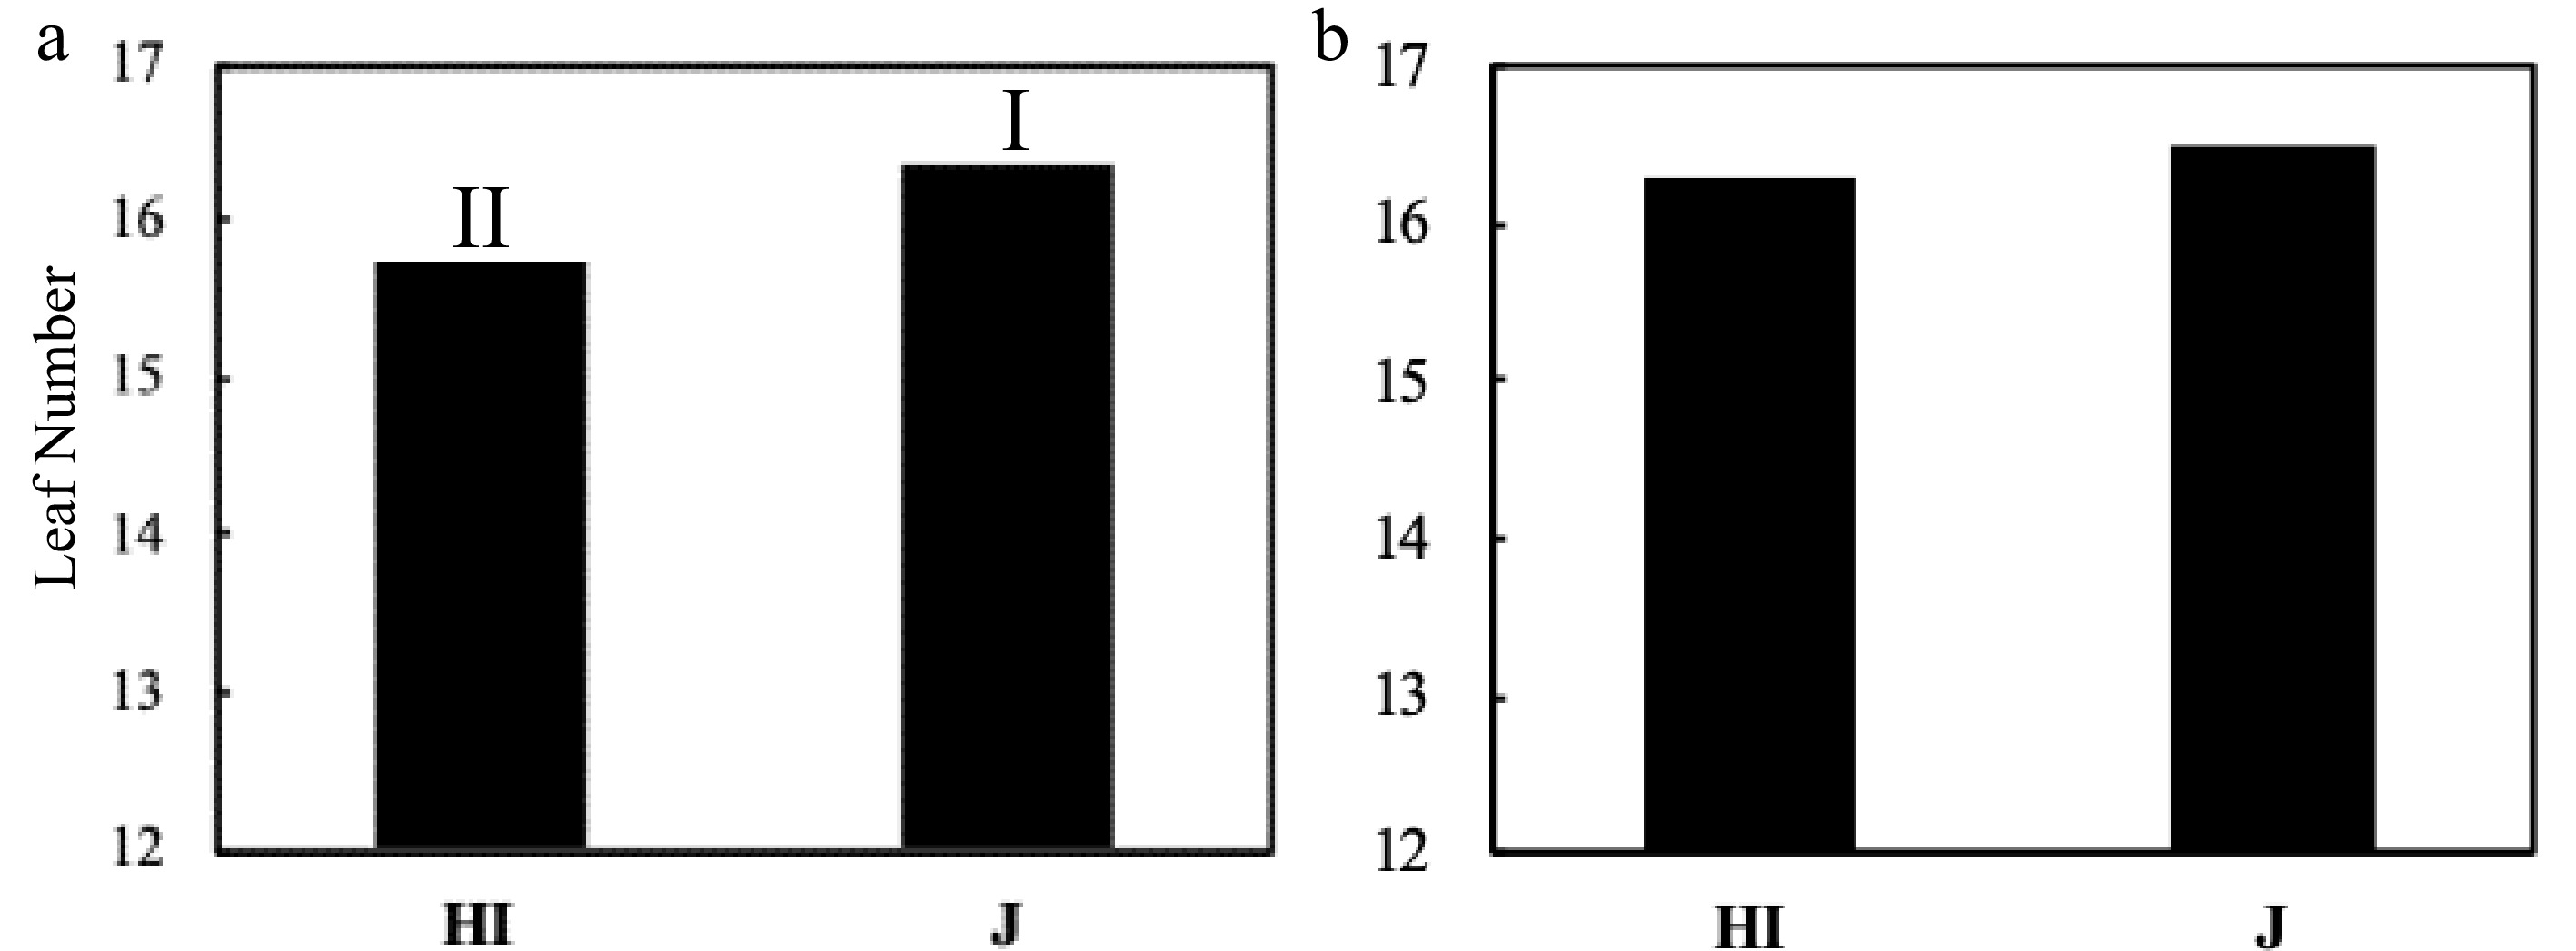
Figure 3.
The LN comparison of Hybrid Indica and Japonica rice type at panicle initiation stage. (a) Expt.1 2017, (b) Expt.2 2018; HI - Hybrid Indica, J - Japonica rice type. Rice type's response to different nitrogen rates for each year is expressed by I and II, and different letters are significantly different at P < 0.05 as determined by the LSD test. There was a significant difference in the first year between HI and J with a range of 0.7 of LN and no significant difference registered in the second year with a range of 0.2 between the rice types.
-
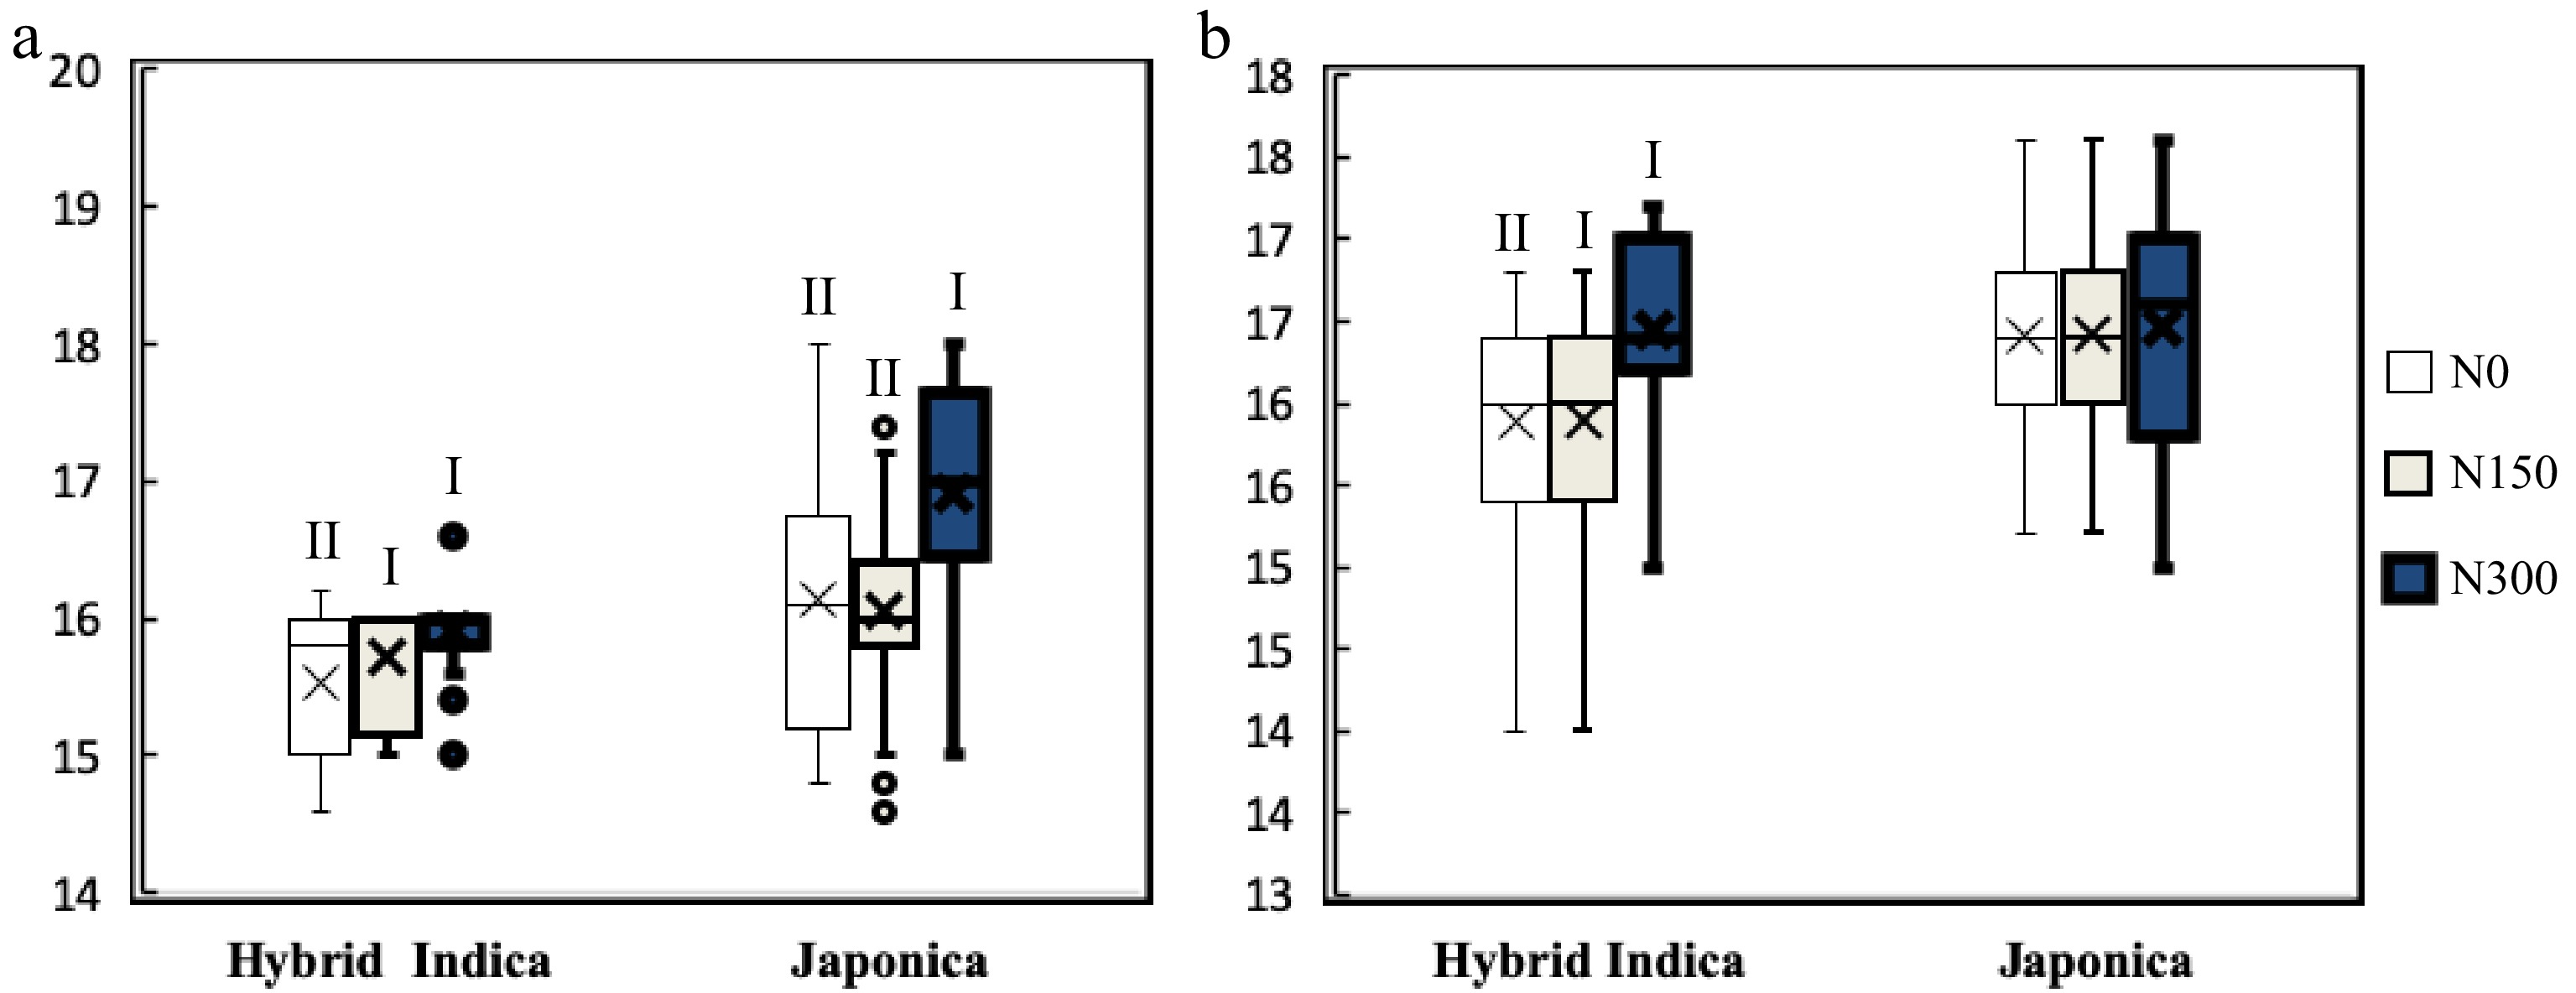
Figure 4.
Hybrid Indica and Japonica LN's responses to different nitrogen rate are expressed by I and II, and different letters are significantly different at P < 0.05 as determined by the LSD test. Hybrid Indica increased LN in function of nitrogen rate applications, with a maximum LN at N150 and N300 for both years ((a) 2017; (b) 2018)), and it decreased considerably in plots with less nitrogen rate at N0 registering the lowest LN. On the other hand, Japonica rice LN's response to different nitrogen rates was not as clear and uniform as it was in Hybrid Indica rice in both years.
-
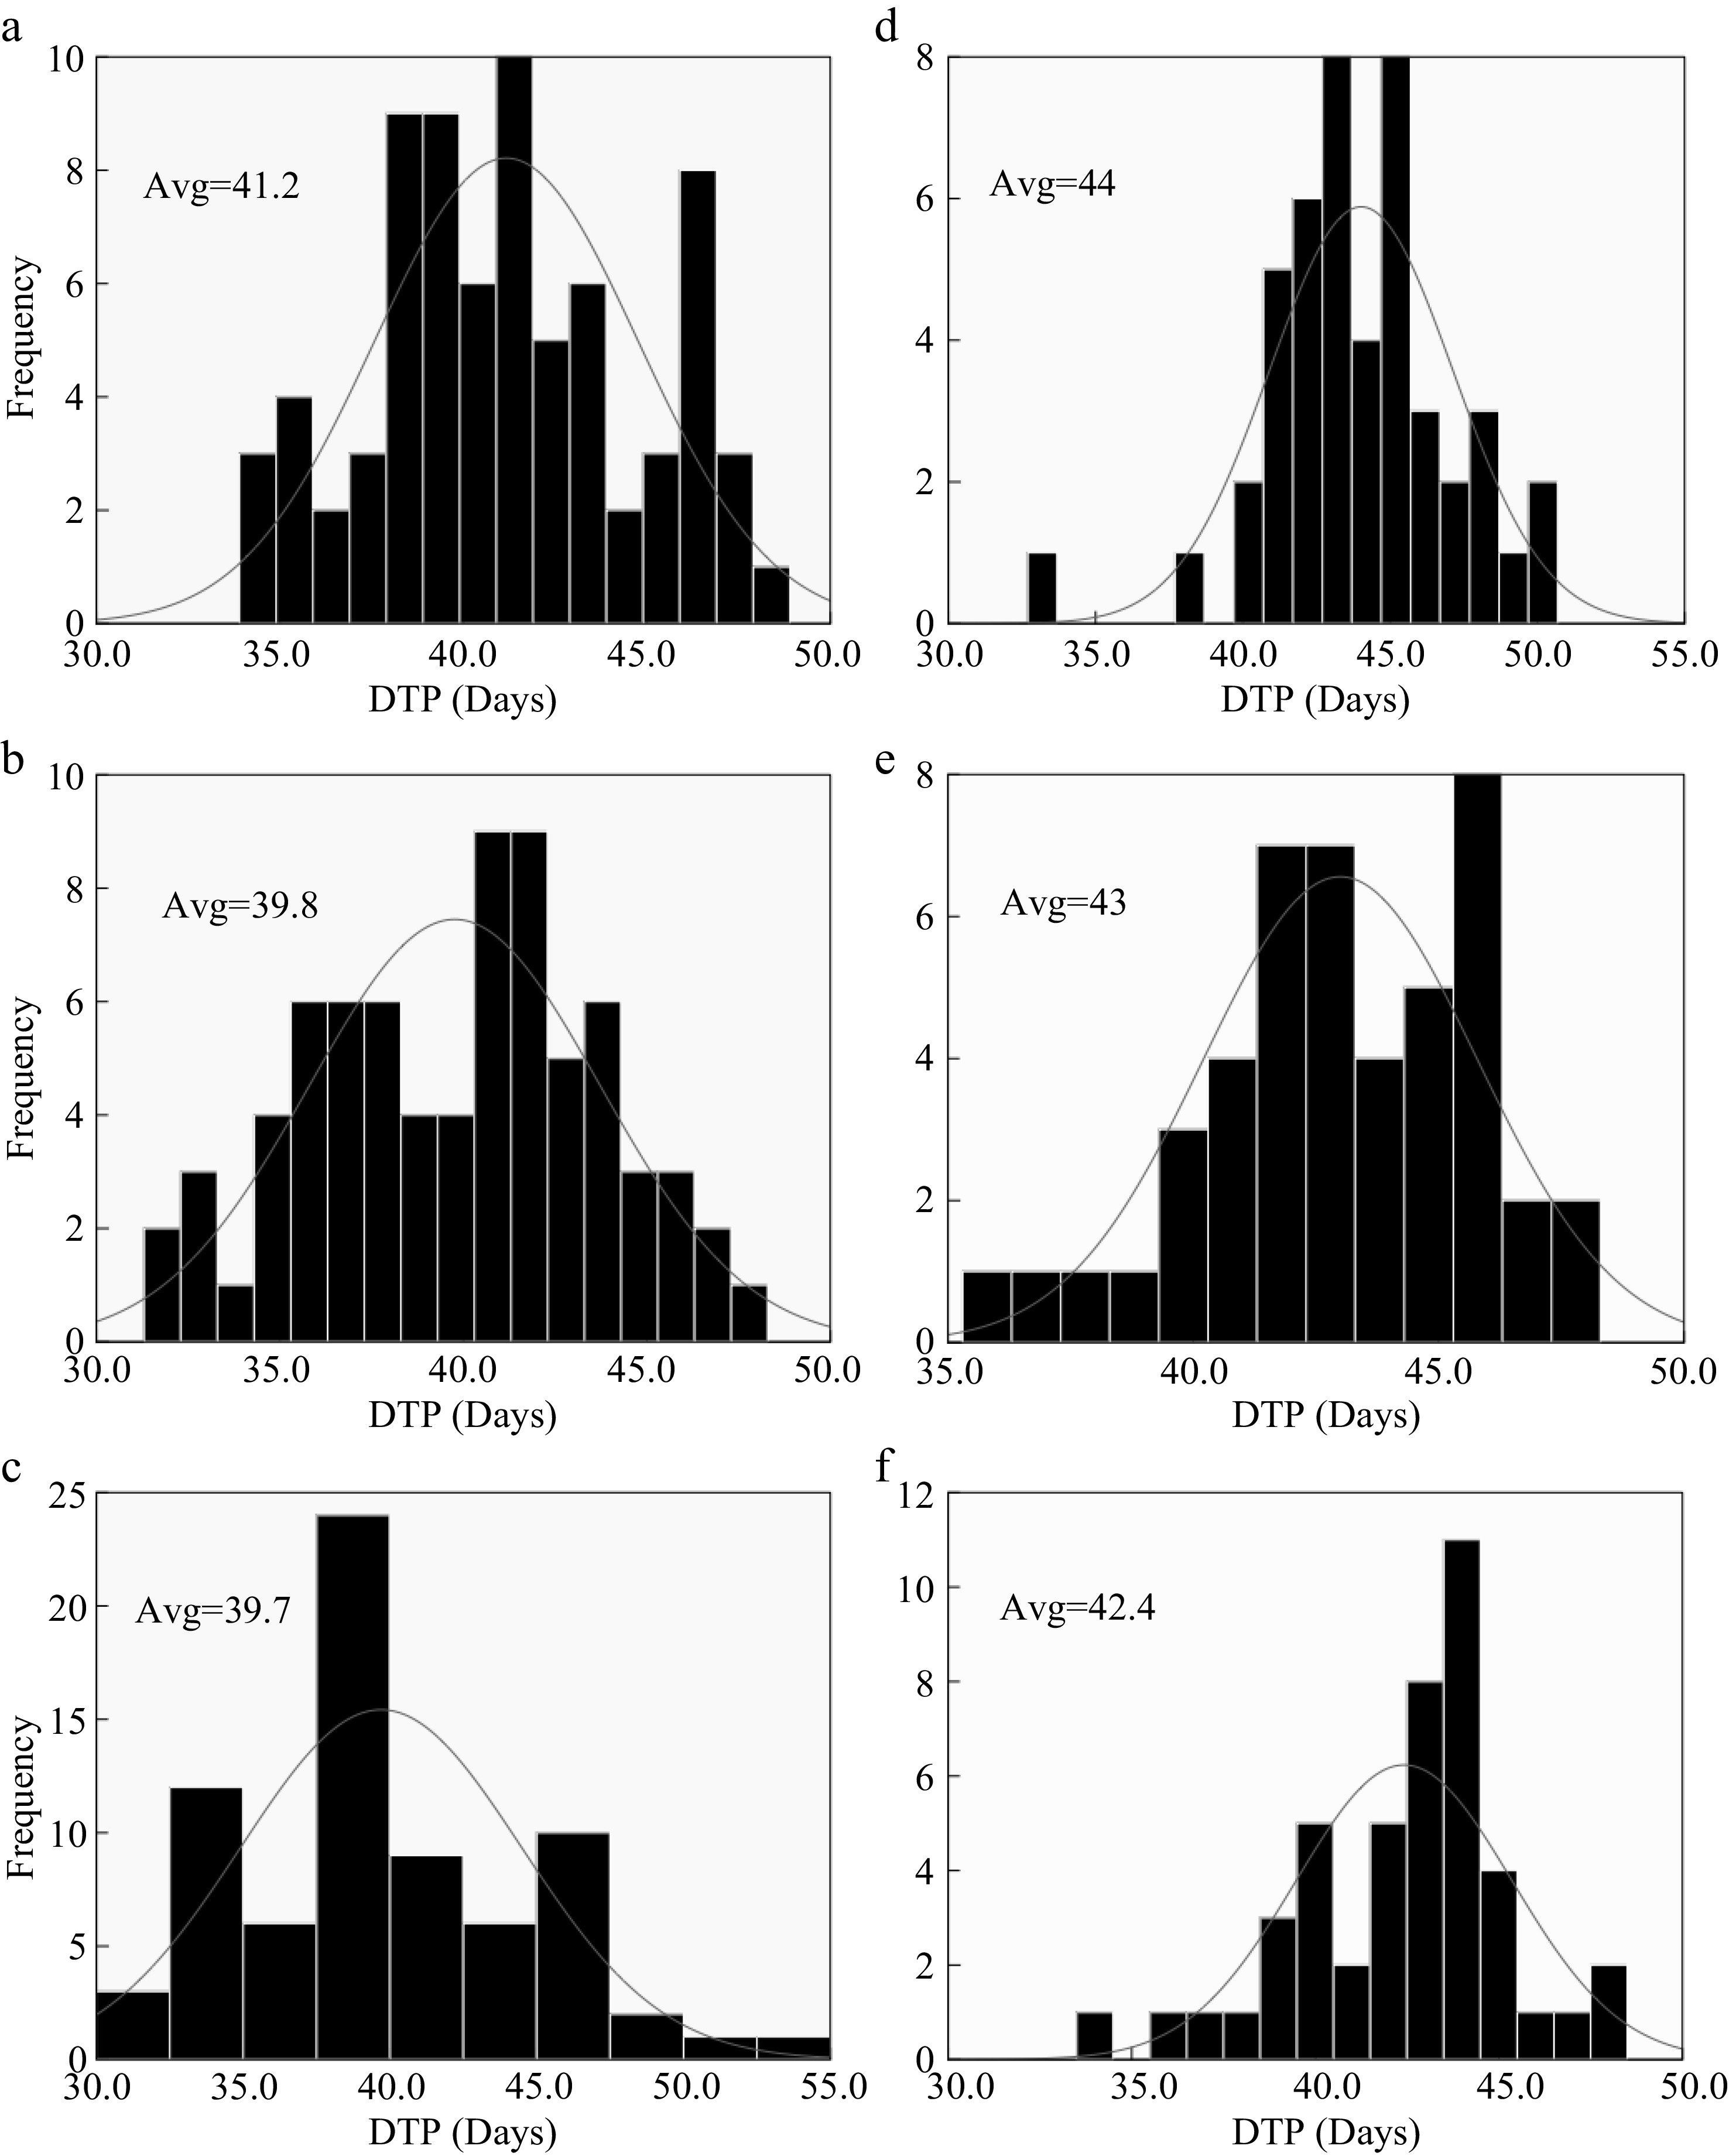
Figure 5.
Nitrogen effect on DTP for Hybrid Indica and Japonica rice types. (a), (b), (c) and (d), (e), (f) represent N0, N150, N300 nitrogen rates for 2017 and 2018 respectively. Avg. - an average of time duration from transplant up to panicle initiation. Nitrogen had a significant effect on DTP; however, the DTP had a downtrend in response to high dosages of nitrogen. The averaged values of LN for both years at different nitrogen rates had a range of 2.8, 3.2 and 2.7 for N0 N150 and N300 respectively.
-
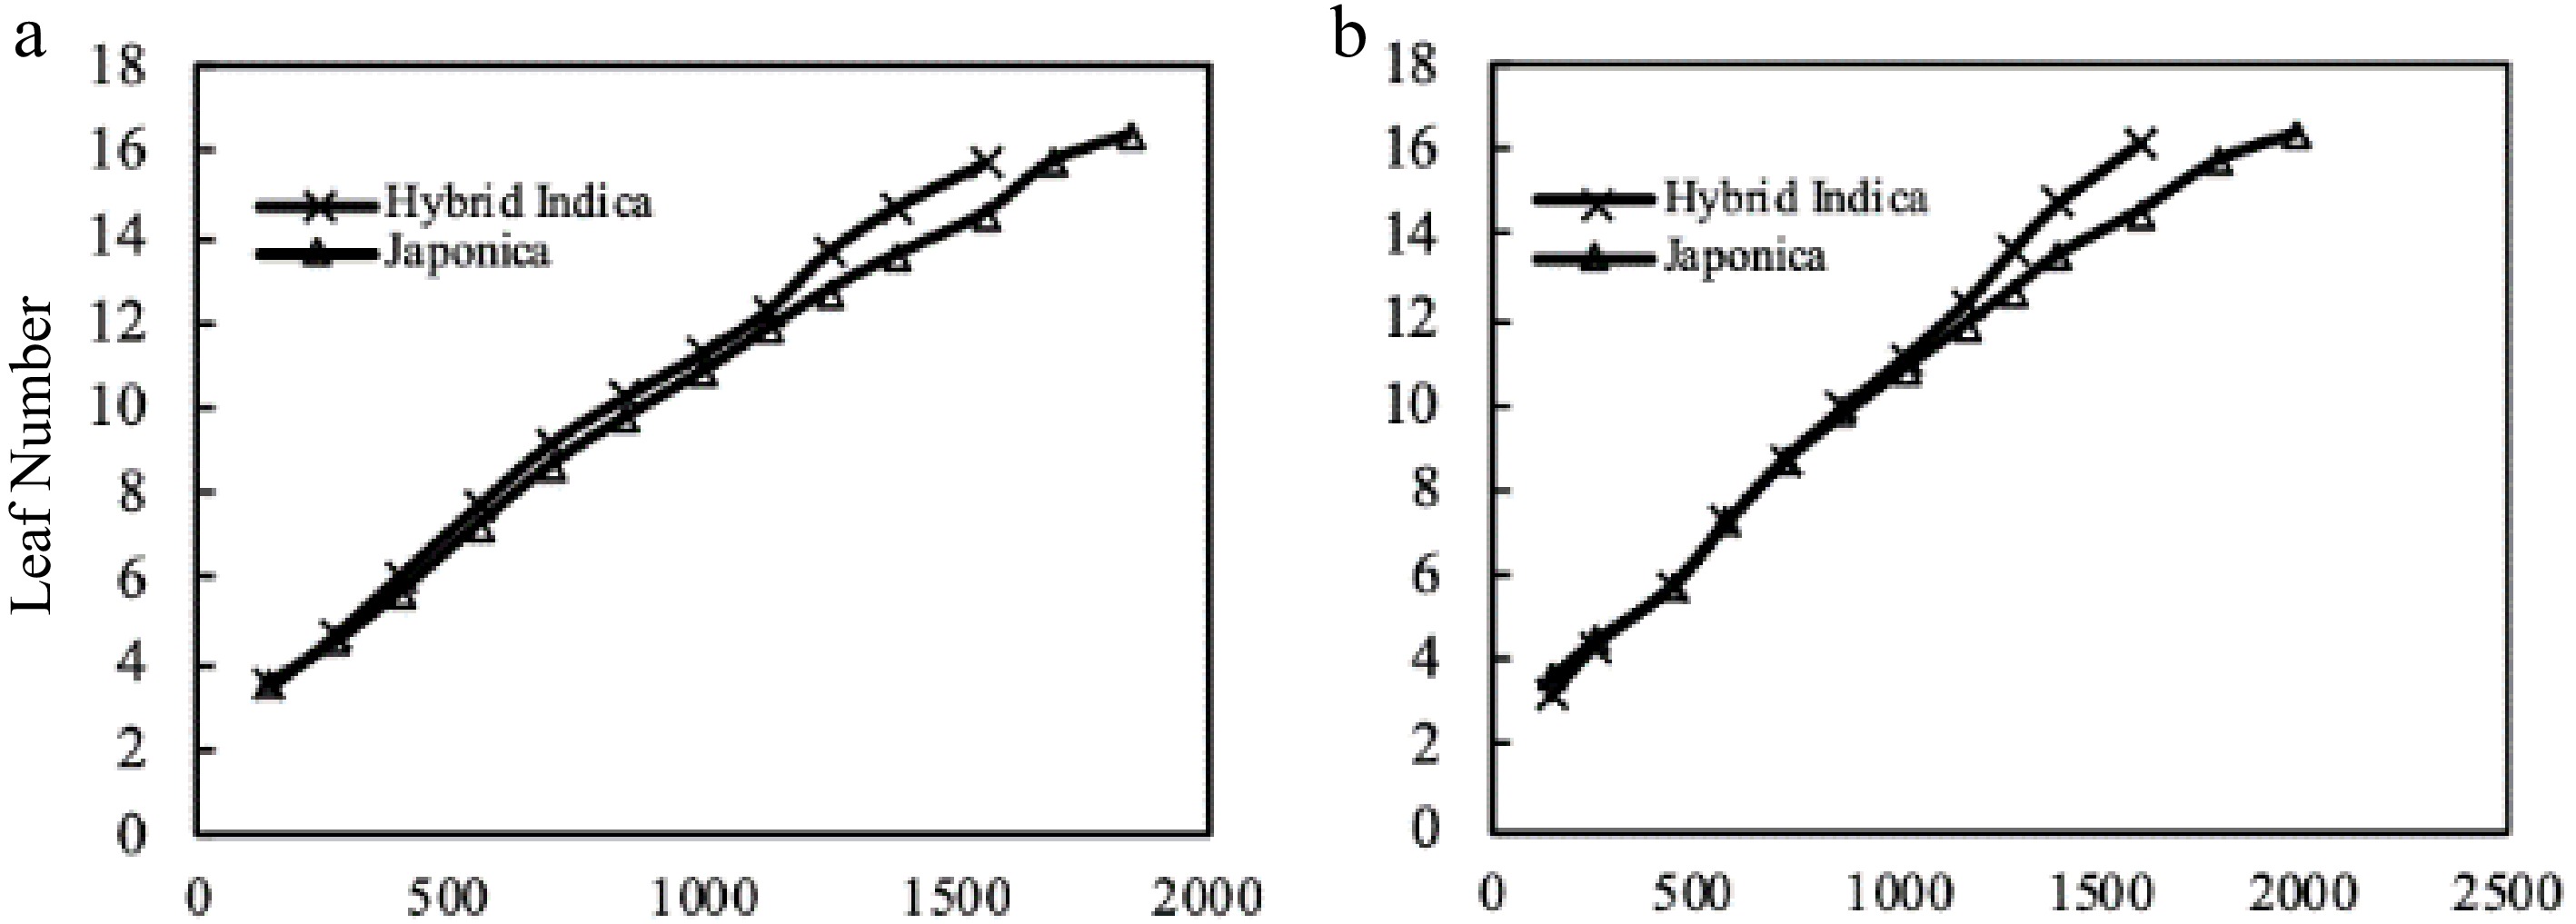
Figure 6.
Hybrid Indica and Japonica rice type LN and thermal time from transplant up to panicle initiation (TT °C/d). (a) 2017 Hybrid Indica and Japonica rice type, (b) 2018 Hybrid Indica and Japonica rice type, (TT - Thermal Time). The TT values resulted from averaged data of daily temperature. Based on the averaged data of both years Hybrid Indica and Japonica, LN under three different nitrogen rates was reached with less than 1,600 and 2,000 °C/d accumulated temperature respectively. Japonica cultivars required more accumulated daily temperature to reach panicle initiation stage as opposed to Hybrid Indica cultivars.
-
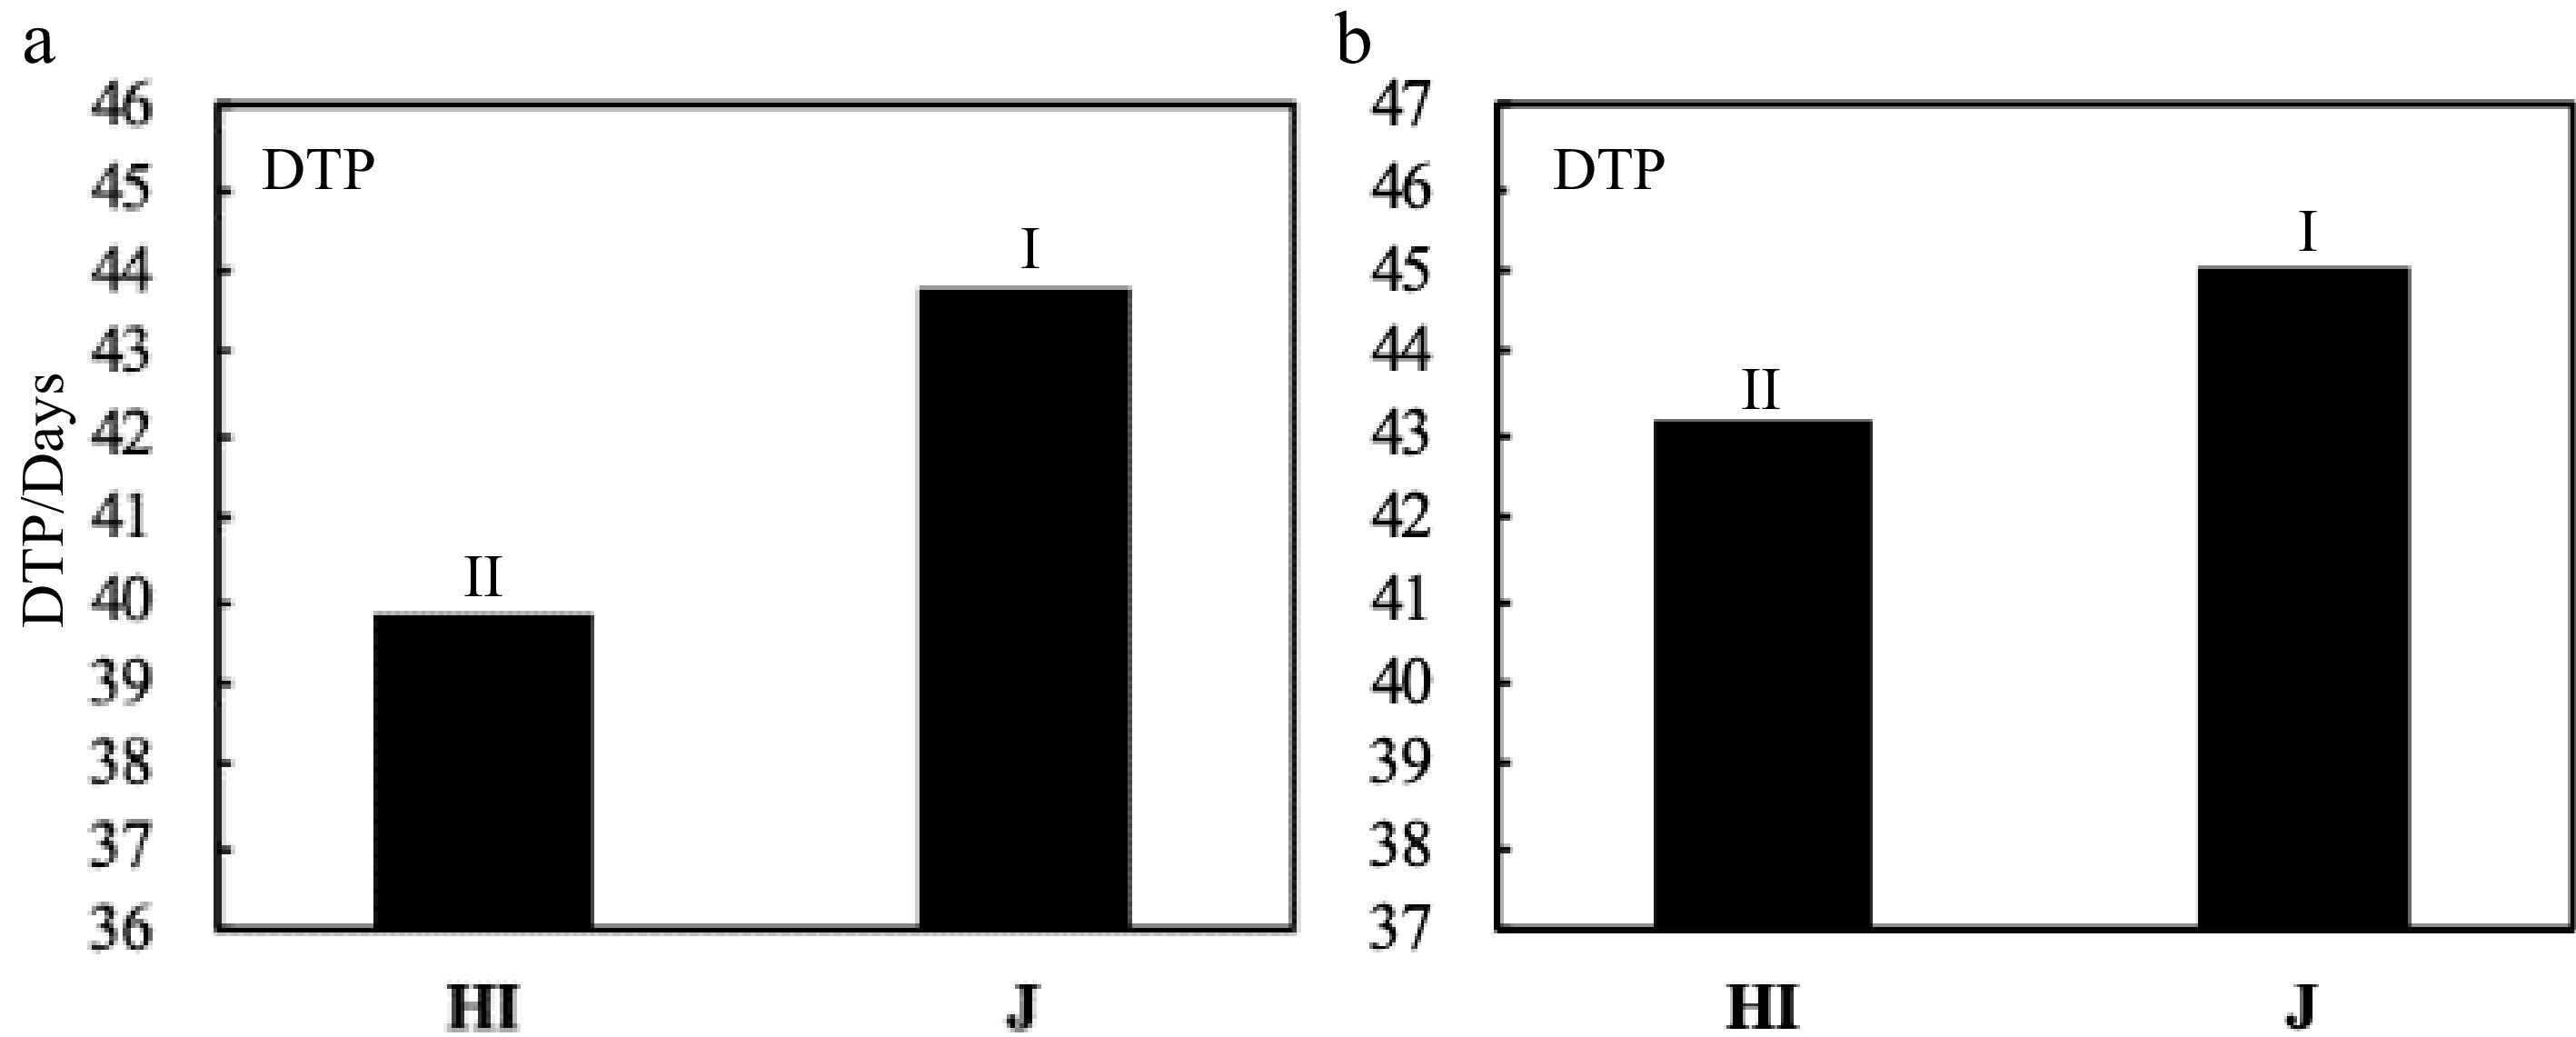
Figure 7.
Comparison of DTP between Hybrid Indica and Japonica rice type in response to different N rates. (a) and (b) represent 2017 and 2018 respectively. There was a significant difference between Hybrid Indica and Japonica rice type in (a) and (b) with a range of 4 and 1.9 respectively.
-
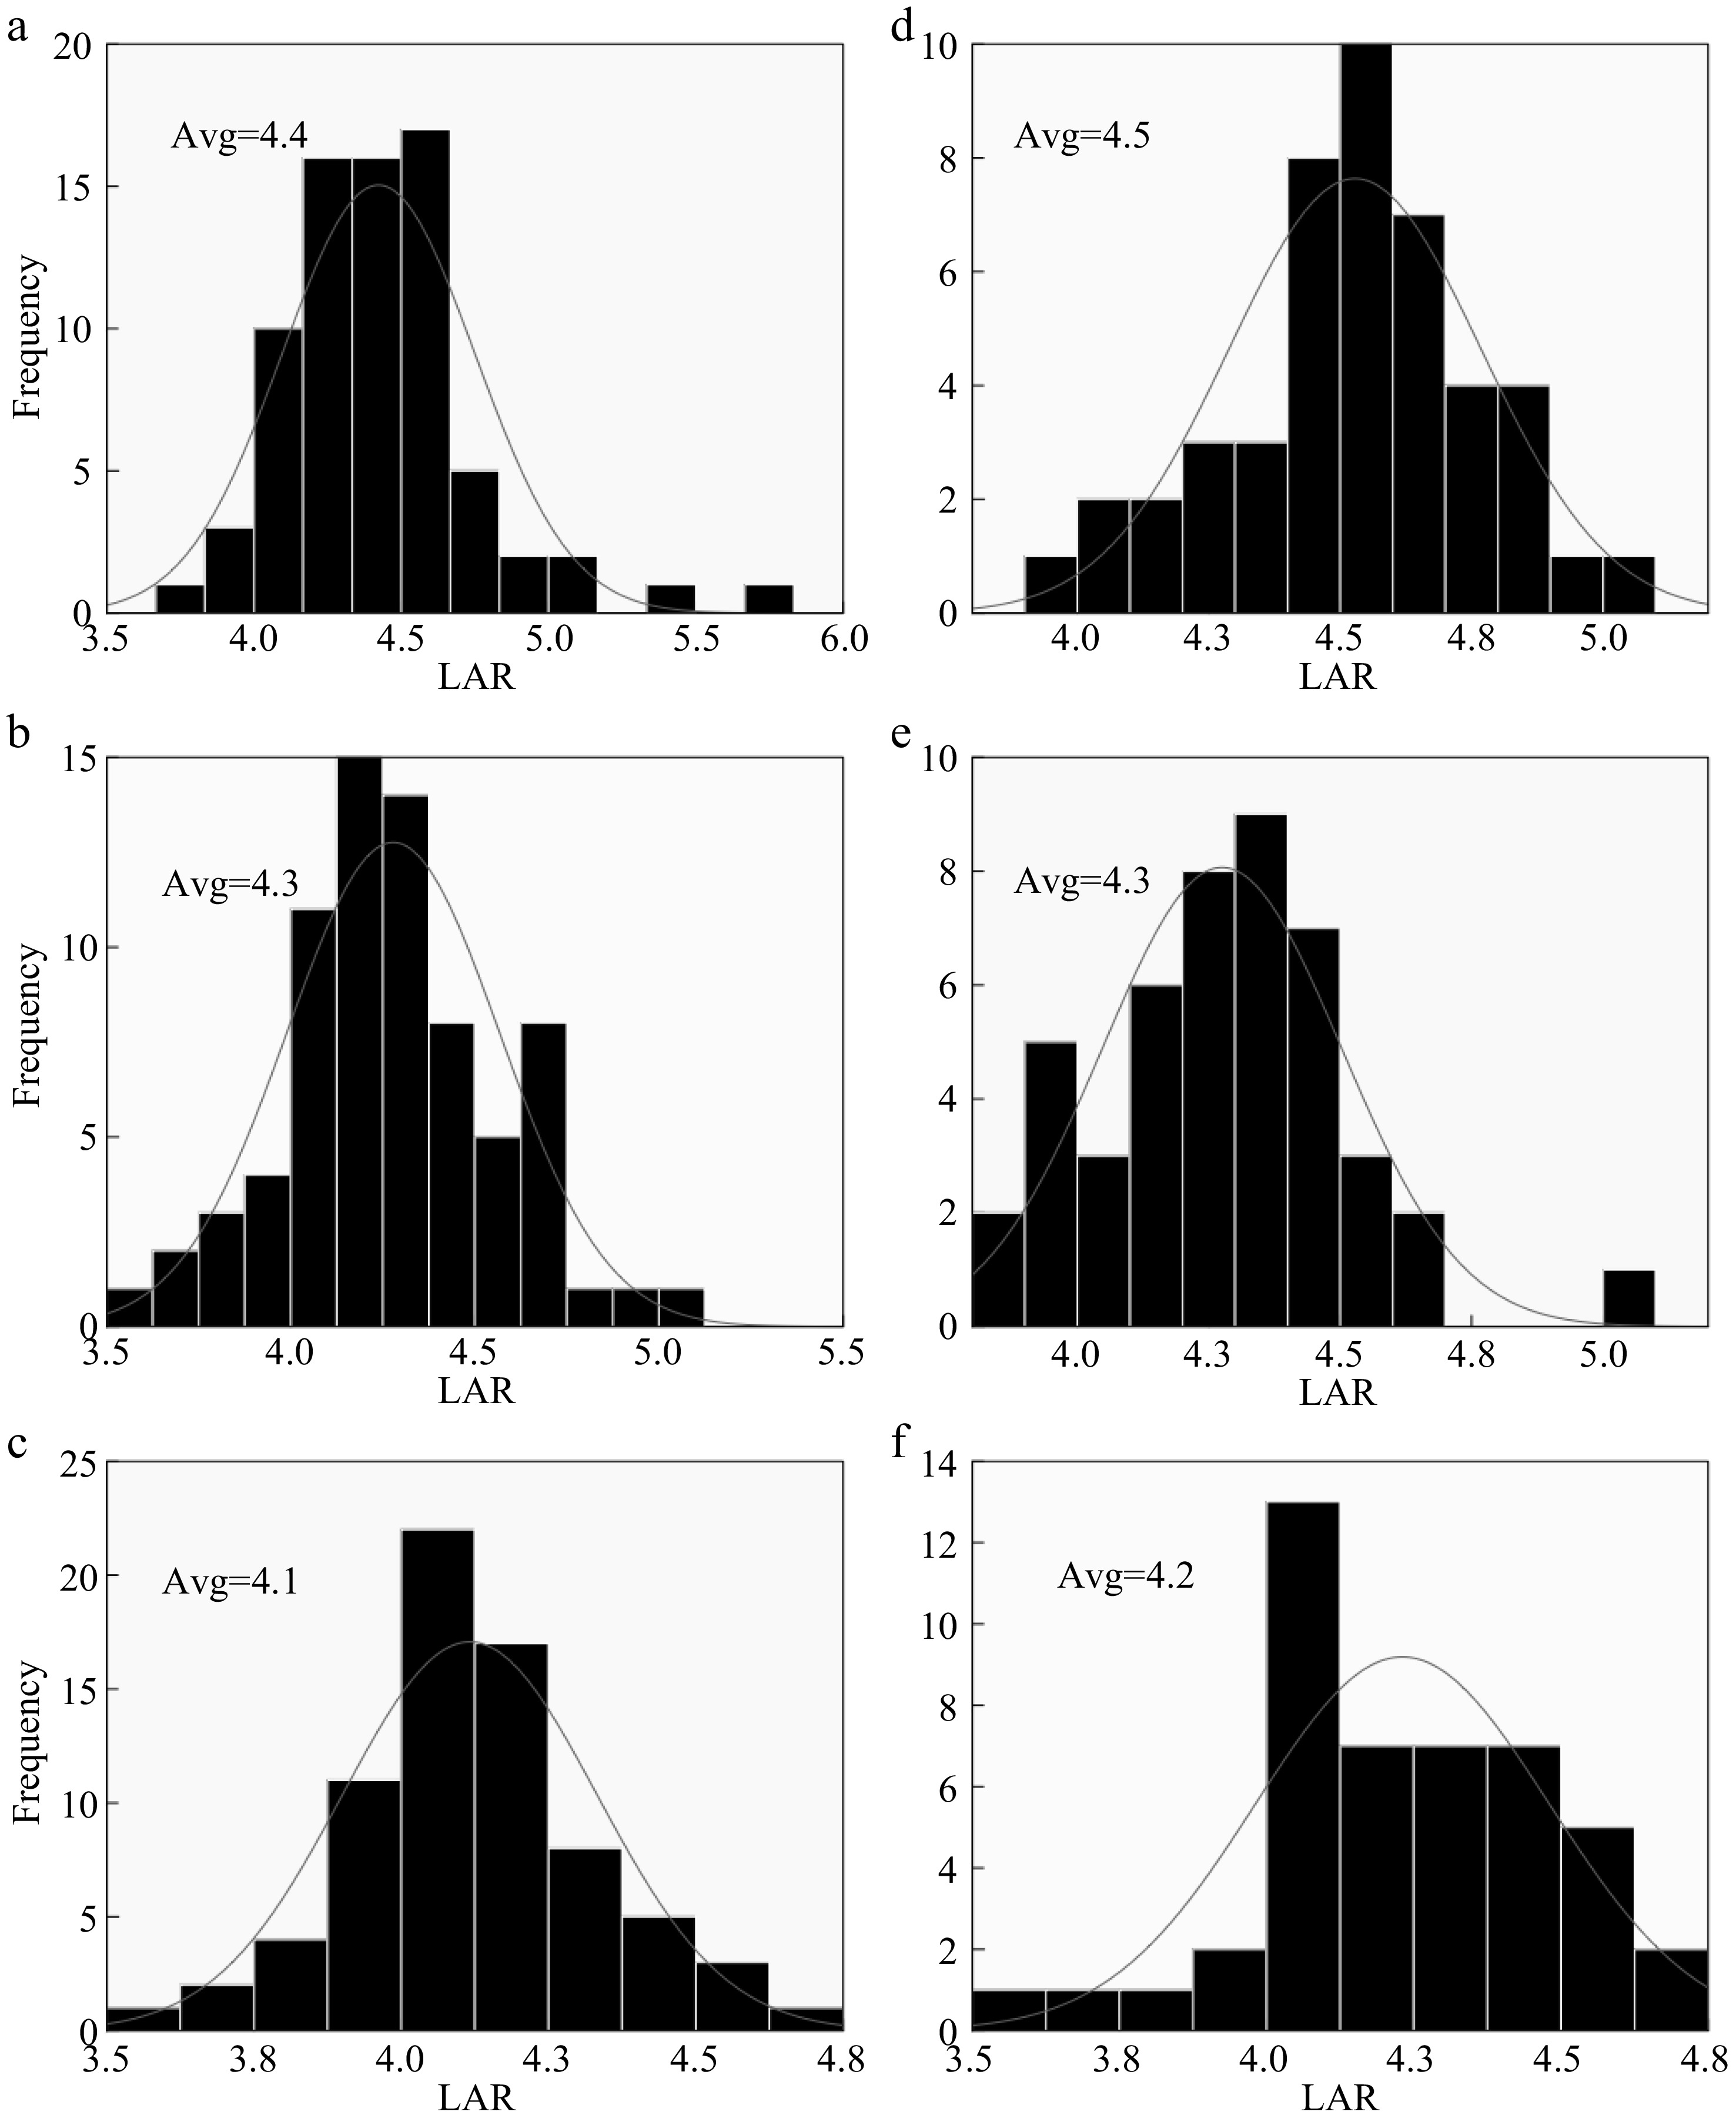
Figure 8.
Nitrogen effect on Hybrid Indica and Japonica rice types. (a), (b), (c) and (d), (e), (f) represent N0, N150, N300 nitrogen rates for 2017 and 2018 respectively. Avg. - Average of LAR at each nitrogen rate. The LAR had no significant difference between the two years and the ranges at N0, N150 and N300 were 0.1, 0, 0.1 respectively.
-
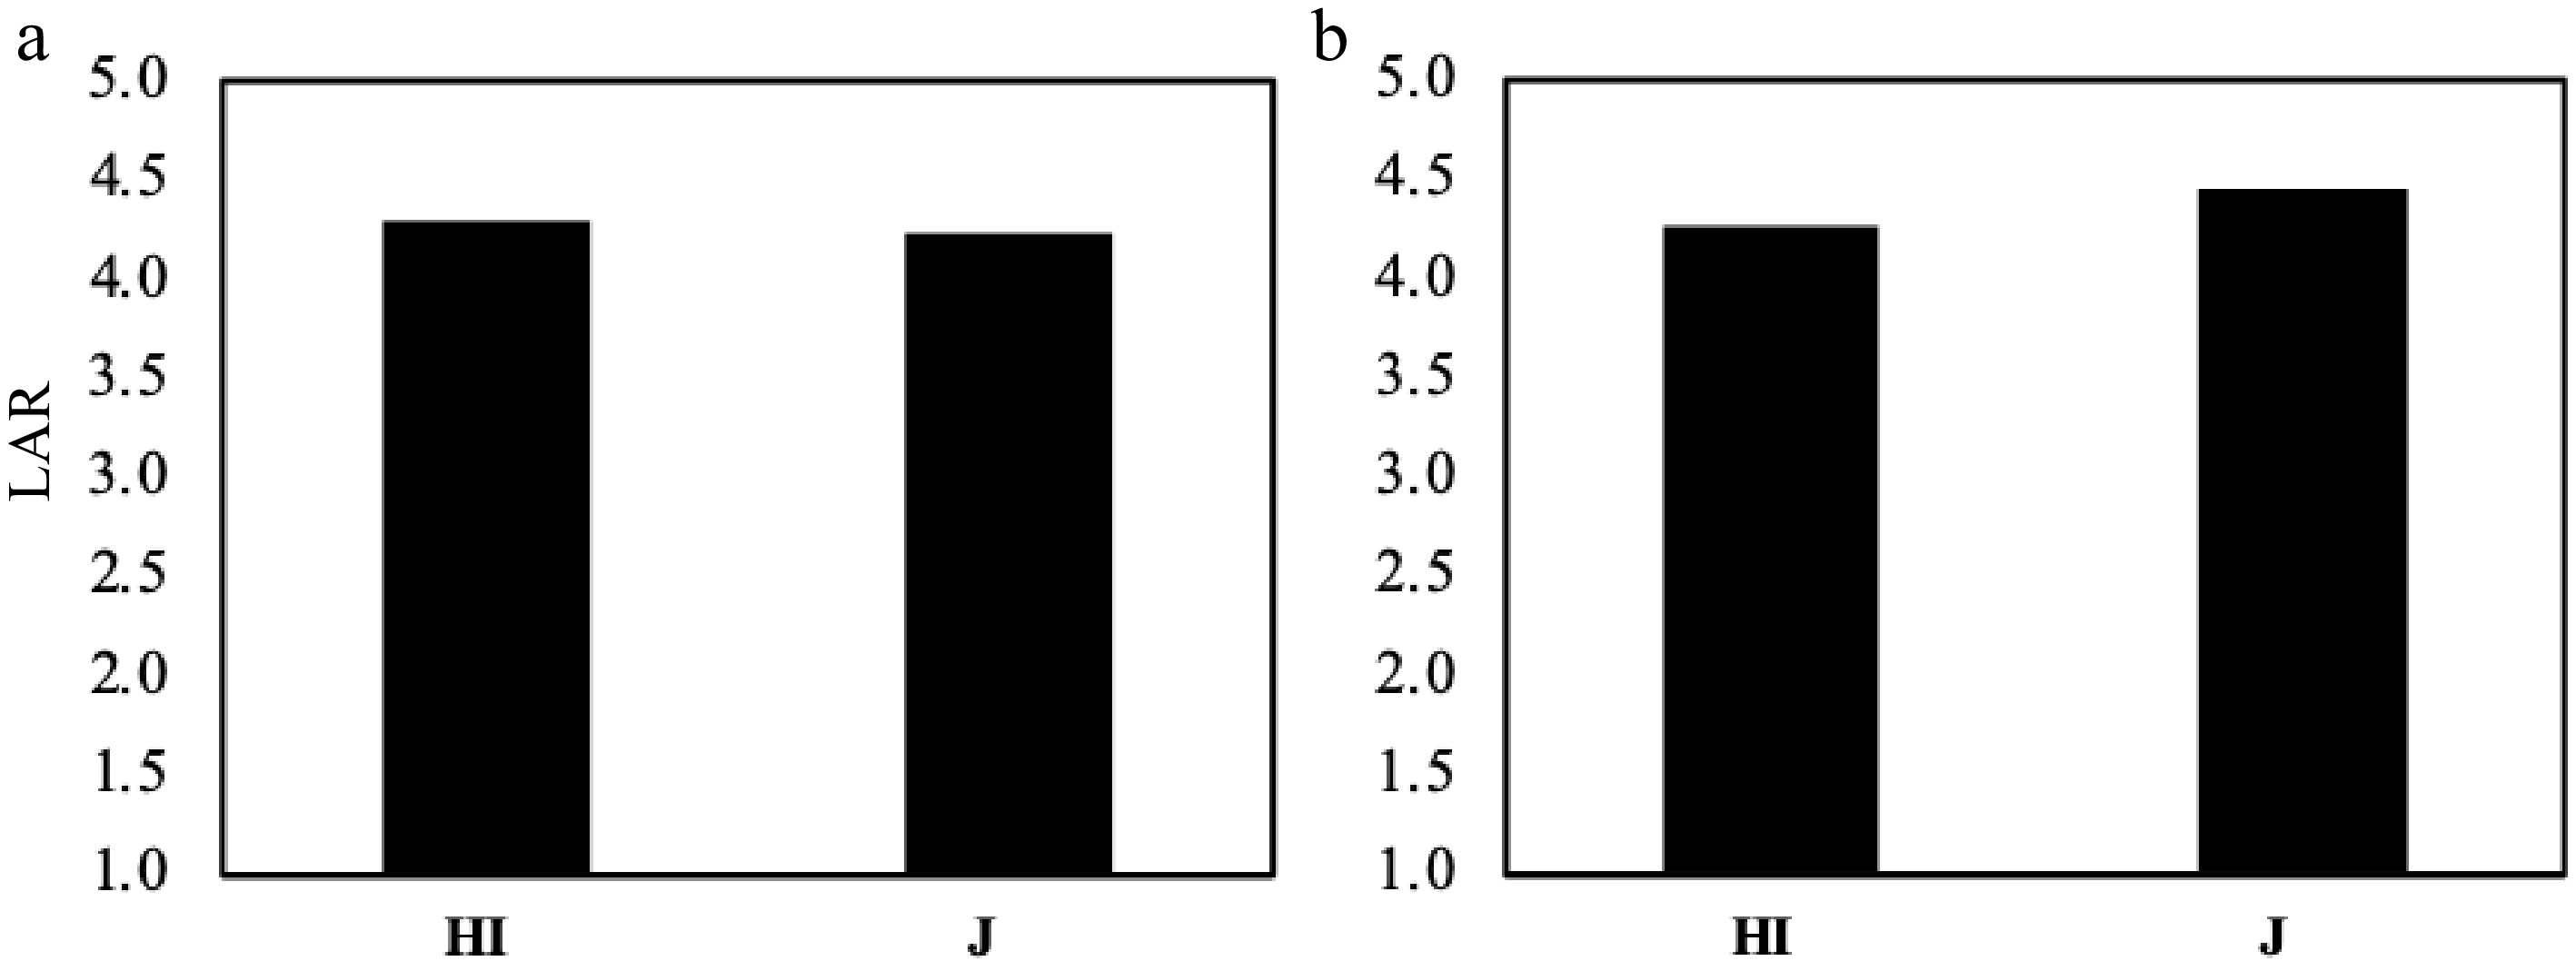
Figure 9.
The LAR comparison between Hybrid Indica and Japonica in response to different nitrogen rates. (a) 2017, (b) 2018. There was no significant difference between Hybrid Indica and Japonica rice type as a response to different nitrogen applications and the range between them in both years was 0.1 and 0.2 respectively.
-
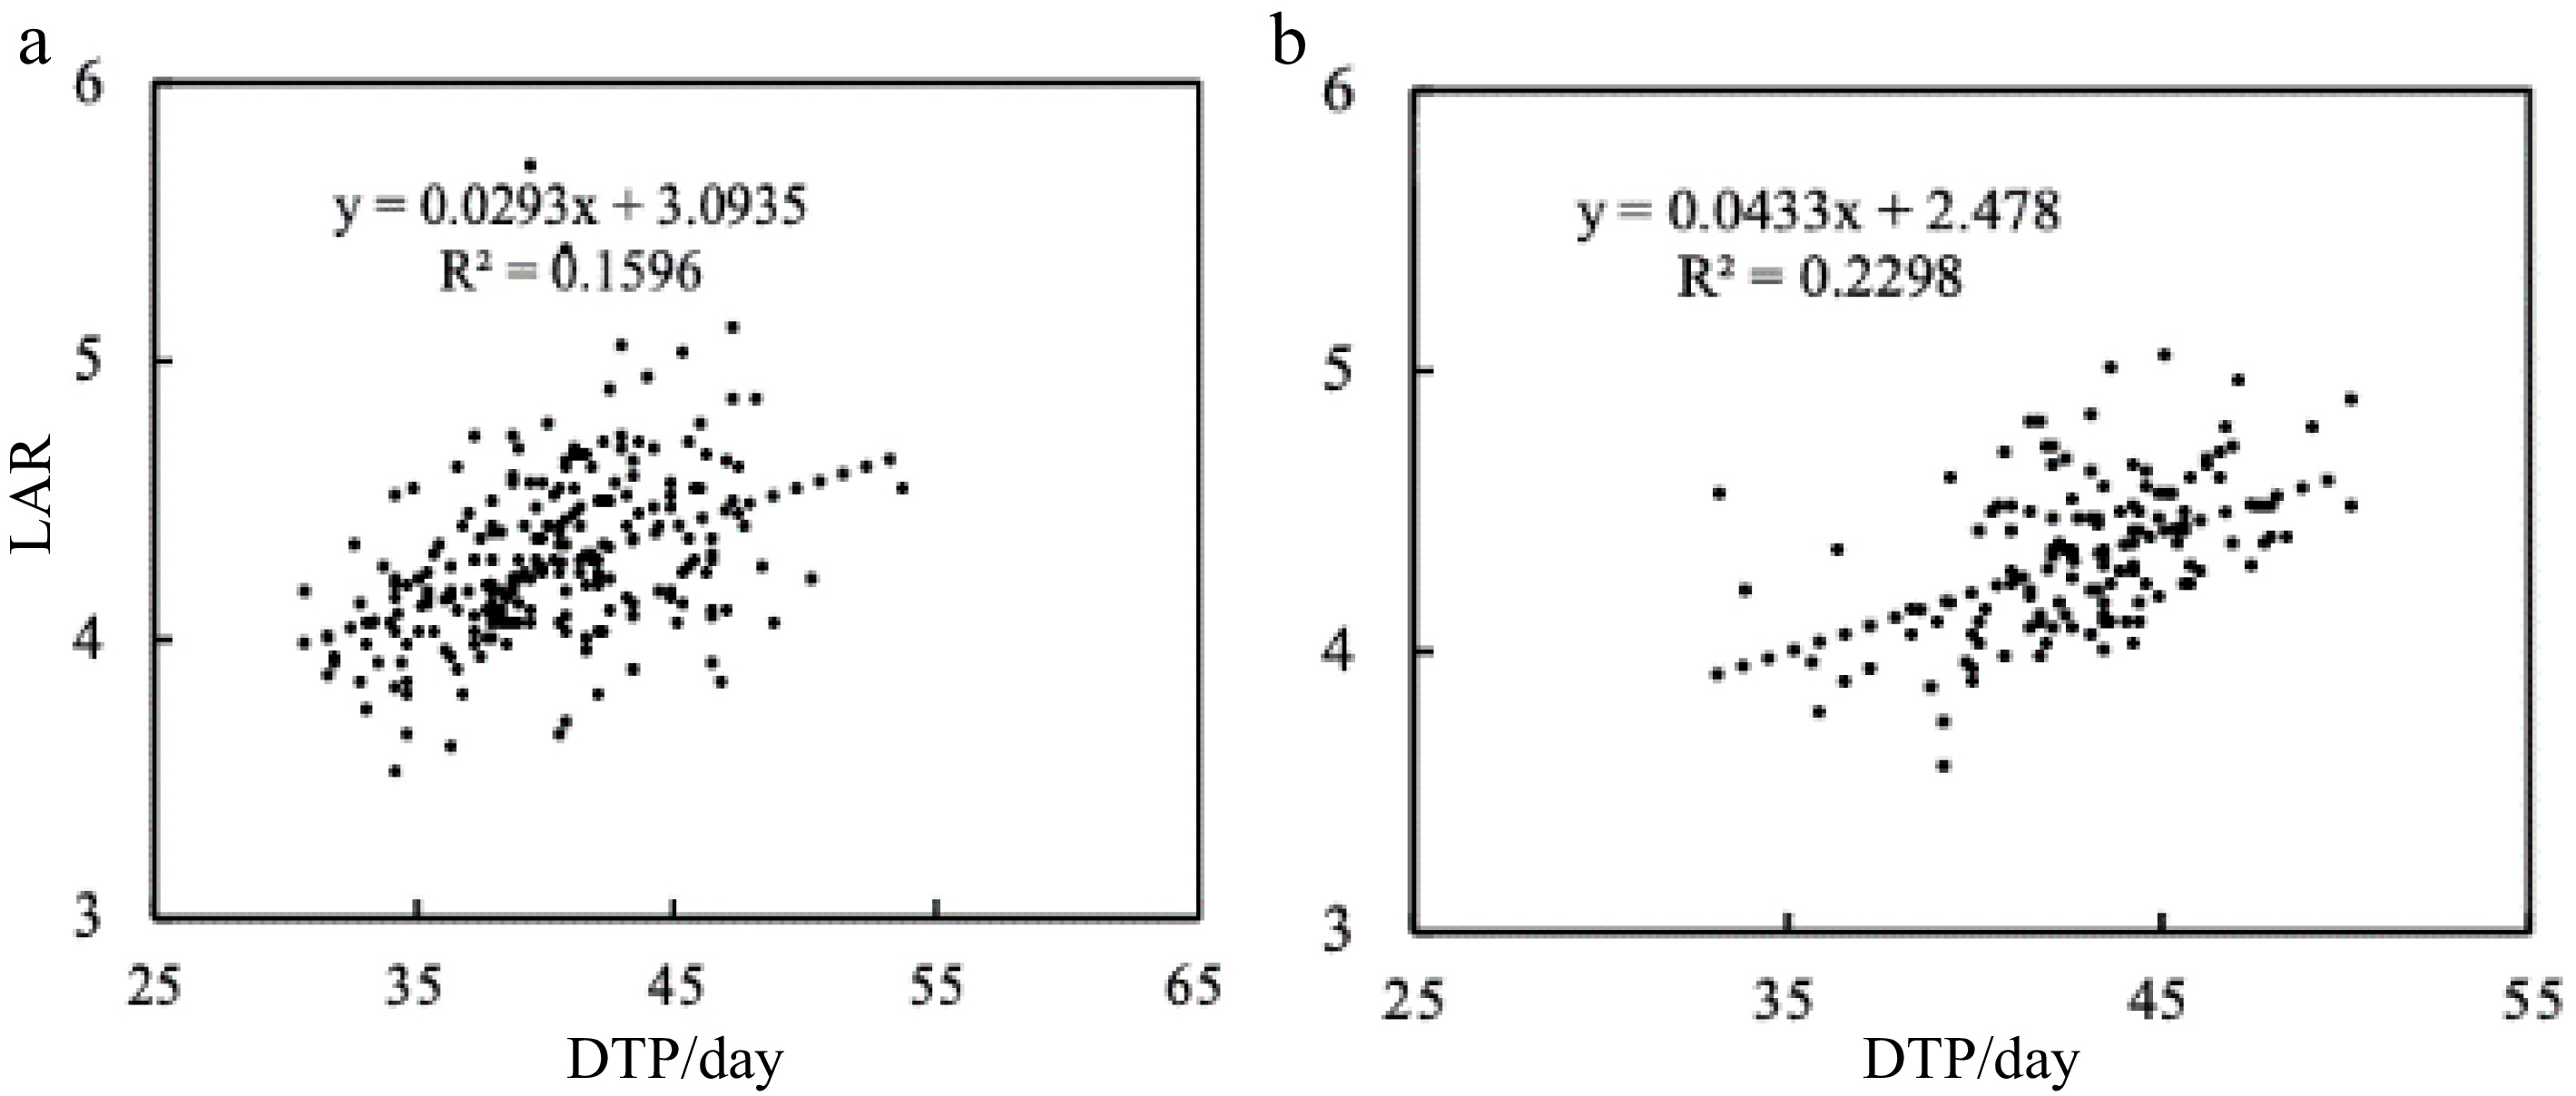
Figure 10.
The relationship between LAR and DTP. Linear regression analyses between DTP and LAR in (a) 2017 and (b) 2018. The LAR increases linearly with DTP, R² = 0.1596 and R² = 0.2298 for (a) and (b) respectively.
-
2017 Year Varieties Type Year Varieties Type Year Varieties Type 2007 C Liangyou 396 Hybrid Indica 2011 xin Liangyou 611 Hybrid Indica 1957 Nong Ken 57 Japonica 2014 C Liangyou Huazhan Hybrid Indica 2002 xin Liangyou 6380 Hybrid Indica 2010 Nan Jing 0212 Japonica 2012 E Liangyou 476 Hybrid Indica 2003 xin Liangyou 6 Hybrid Indica 2004 Nan Jing 46 Japonica 2016 Y Liangyou 1964 Hybrid Indica 2002 Xinyou 188 Hybrid Indica 2005 Nan Jing 5055 Japonica 1993 Y Liangyou No.1 Hybrid Indica 2014 Zaoyou 929 Hybrid Indica 2009 Nan Jing 52 Japonica 2008 Y Liangyou 2 Hybrid Indica 1981 shanyou63 Hybrid Indica 2009 Nan Jing 9108 Japonica 2009 Liangyou 3905 Hybrid Indica 2009 Taifeng You208 Hybrid Indica 2001 Nan Jing No.1 Japonica 2008 Liangyou 688 Hybrid Indica 2006 Huai Liangyou 608 Hybrid Indica 2005 Nan Jing 2 Japonica 1999 Liang You Peijiu Hybrid Indica 2007 Shenliangyou 5814 Hybrid Indica 2005 Nan Jing 3 Japonica 2008 Zhongzheyou 10 Hybrid Indica 2002 Royou 8 Hybrid Indica 2007 Nan Jing 4 Japonica 2001 Zhongzheyou No.1 Hybrid Indica 2002 Anhui rice 153 Hybrid Indica 2007 Nan Jing 5 Japonica 2001 Zhongzheyou 8 Hybrid Indica 2009 Juliangyou 747 Hybrid Indica 2005 Nan Jing 6 Japonica 2005 Fengliangyou No.4 Hybrid Indica 2013 Quanyou 3301 Hybrid Indica 2011 Nan Jing 7 Japonica 2011 Fengliangyou 6348 Hybrid Indica 2008 Quan Zaoyou 406 Hybrid Indica 2008 Nan Jing 8 Japonica 2001 Fengyouxiangzhan Hybrid Indica 2006 Quan zaoyou simiao Hybrid Indica 2004 Yang Jing 4038 Japonica 2007 Wushan silk seedling Hybrid Indica 2014 Chao you 1000 Hybrid Indica 2006 Yangyu Jing 2 Japonica 2004 Tianliangyou 616 Hybrid Indica 2010 Qian You 911 Hybrid Indica 1999 Wu Jing 14 Japonica 2007 Tianyou Huazhan Hybrid Indica 2009 Qian You 930 Hybrid Indica 1990 Wuyujing 3 Japonica 2009 Yixiangyou 2115 Hybrid Indica 2005 Wuyunjing 23 Japonica 2012 Juliangyou 60 Hybrid Indica 2006 Wuyunjing 24 Japonica 2008 Guangliangyou 272 Hybrid Indica 2009 Wuyunjing 30 Japonica 2008 Guangliangyou 476 Hybrid Indica 2010 Wuyunjing 31 Japonica 2010 Guangliangyou 5 Hybrid Indica 1995 Wuyunjing 7 Japonica 2005 Guangliangyouxiang 66 Hybrid Indica 1994 Huaidao No.5 Japonica 2007 Huiliangyou No.6 Hybrid Indica 2008 Huaixiangjing 15 Japonica 2011 Huiliangyou 898 Hybrid Indica 2011 Su Xiangjing 100 Japonica 2008 Huiliangyou 996 Hybrid Indica 1995 Su Xiangjing No.1 Japonica 1992 Yangliangyou 6 Hybrid Indica 2006 Su Xiangjing 3 Japonica 2007 Zhendao 18 Japonica 2018 Year Varieties Type Year varieties Type Year Varieties Type 2007 C Liangyou Huazhan Hybrid Indica 1957 Nongken 57 Japonica 2006 Wu Yun Jing 24 Japonica 1993 Y two you 1 Hybrid Indica 2010 Nan Jing 0212 Japonica 2010 Wu Yun Jing 31 Japonica 2008 Two you 688 Hybrid Indica 2004 Nan Jing 46 Japonica 1995 Wuyunjing 7 Japonica 1999 Two you Pei nine Hybrid Indica 2005 Nan Jing 5055 Japonica 1994 Huai Dao 5 Japonica 2001 Zhongzheyou No.1 Hybrid Indica 2009 Nan Jing 52 Japonica 2011 Su Xiangjing 100 Japonica 2001 Zhongzheyou 8 Hybrid Indica 2009 Nan Jing 9108 Japonica 2006 Su Xiangjing 3 Japonica 2001 Feng you Xiang Ju Hybrid Indica 2001 Ning Jing 1 Japonica 2007 Tian You Hua Zhan Hybrid Indica 2005 Ning Jing Japonica 2012 Ju liang you 60 Hybrid Indica 2005 Ning Jing 3 Japonica 2005 Guangliangyouxiang 66 Hybrid Indica 2007 Ning Jing 4 Japonica 2011 Hui two you 898 Hybrid Indica 2007 Ning Jing 5 Japonica 1992 Yangliangyou 6 Hybrid Indica 2005 Ning Jing 6 Japonica 2003 xin Liangyou 6 Hybrid Indica 2011 Ning Jing 7 Japonica 1981 shanyou63 Hybrid Indica 2008 Ning Jing 8 Japonica 2007 Shenliangyou 5814 Hybrid Indica 1999 Wu Jing 14 Japonica 2013 Tsuen you 3301 Hybrid Indica 1990 Wuyujing 3 Japonica 2014 Chao you 1000 Hybrid Indica 2005 Wu Yun Jing 23 Japonica 2009 Qian You 930 Hybrid Indica Table 1.
List of varieties used in 2017 and 2018.
-
Year N0 N150 N300 LN range 2017 15.8b 15.7b 16.1 0.3 2018 16.1a 16.5a 16.5 0.4 Table 2.
Leaf range between 2017 and 2018.
Figures
(10)
Tables
(2)