-
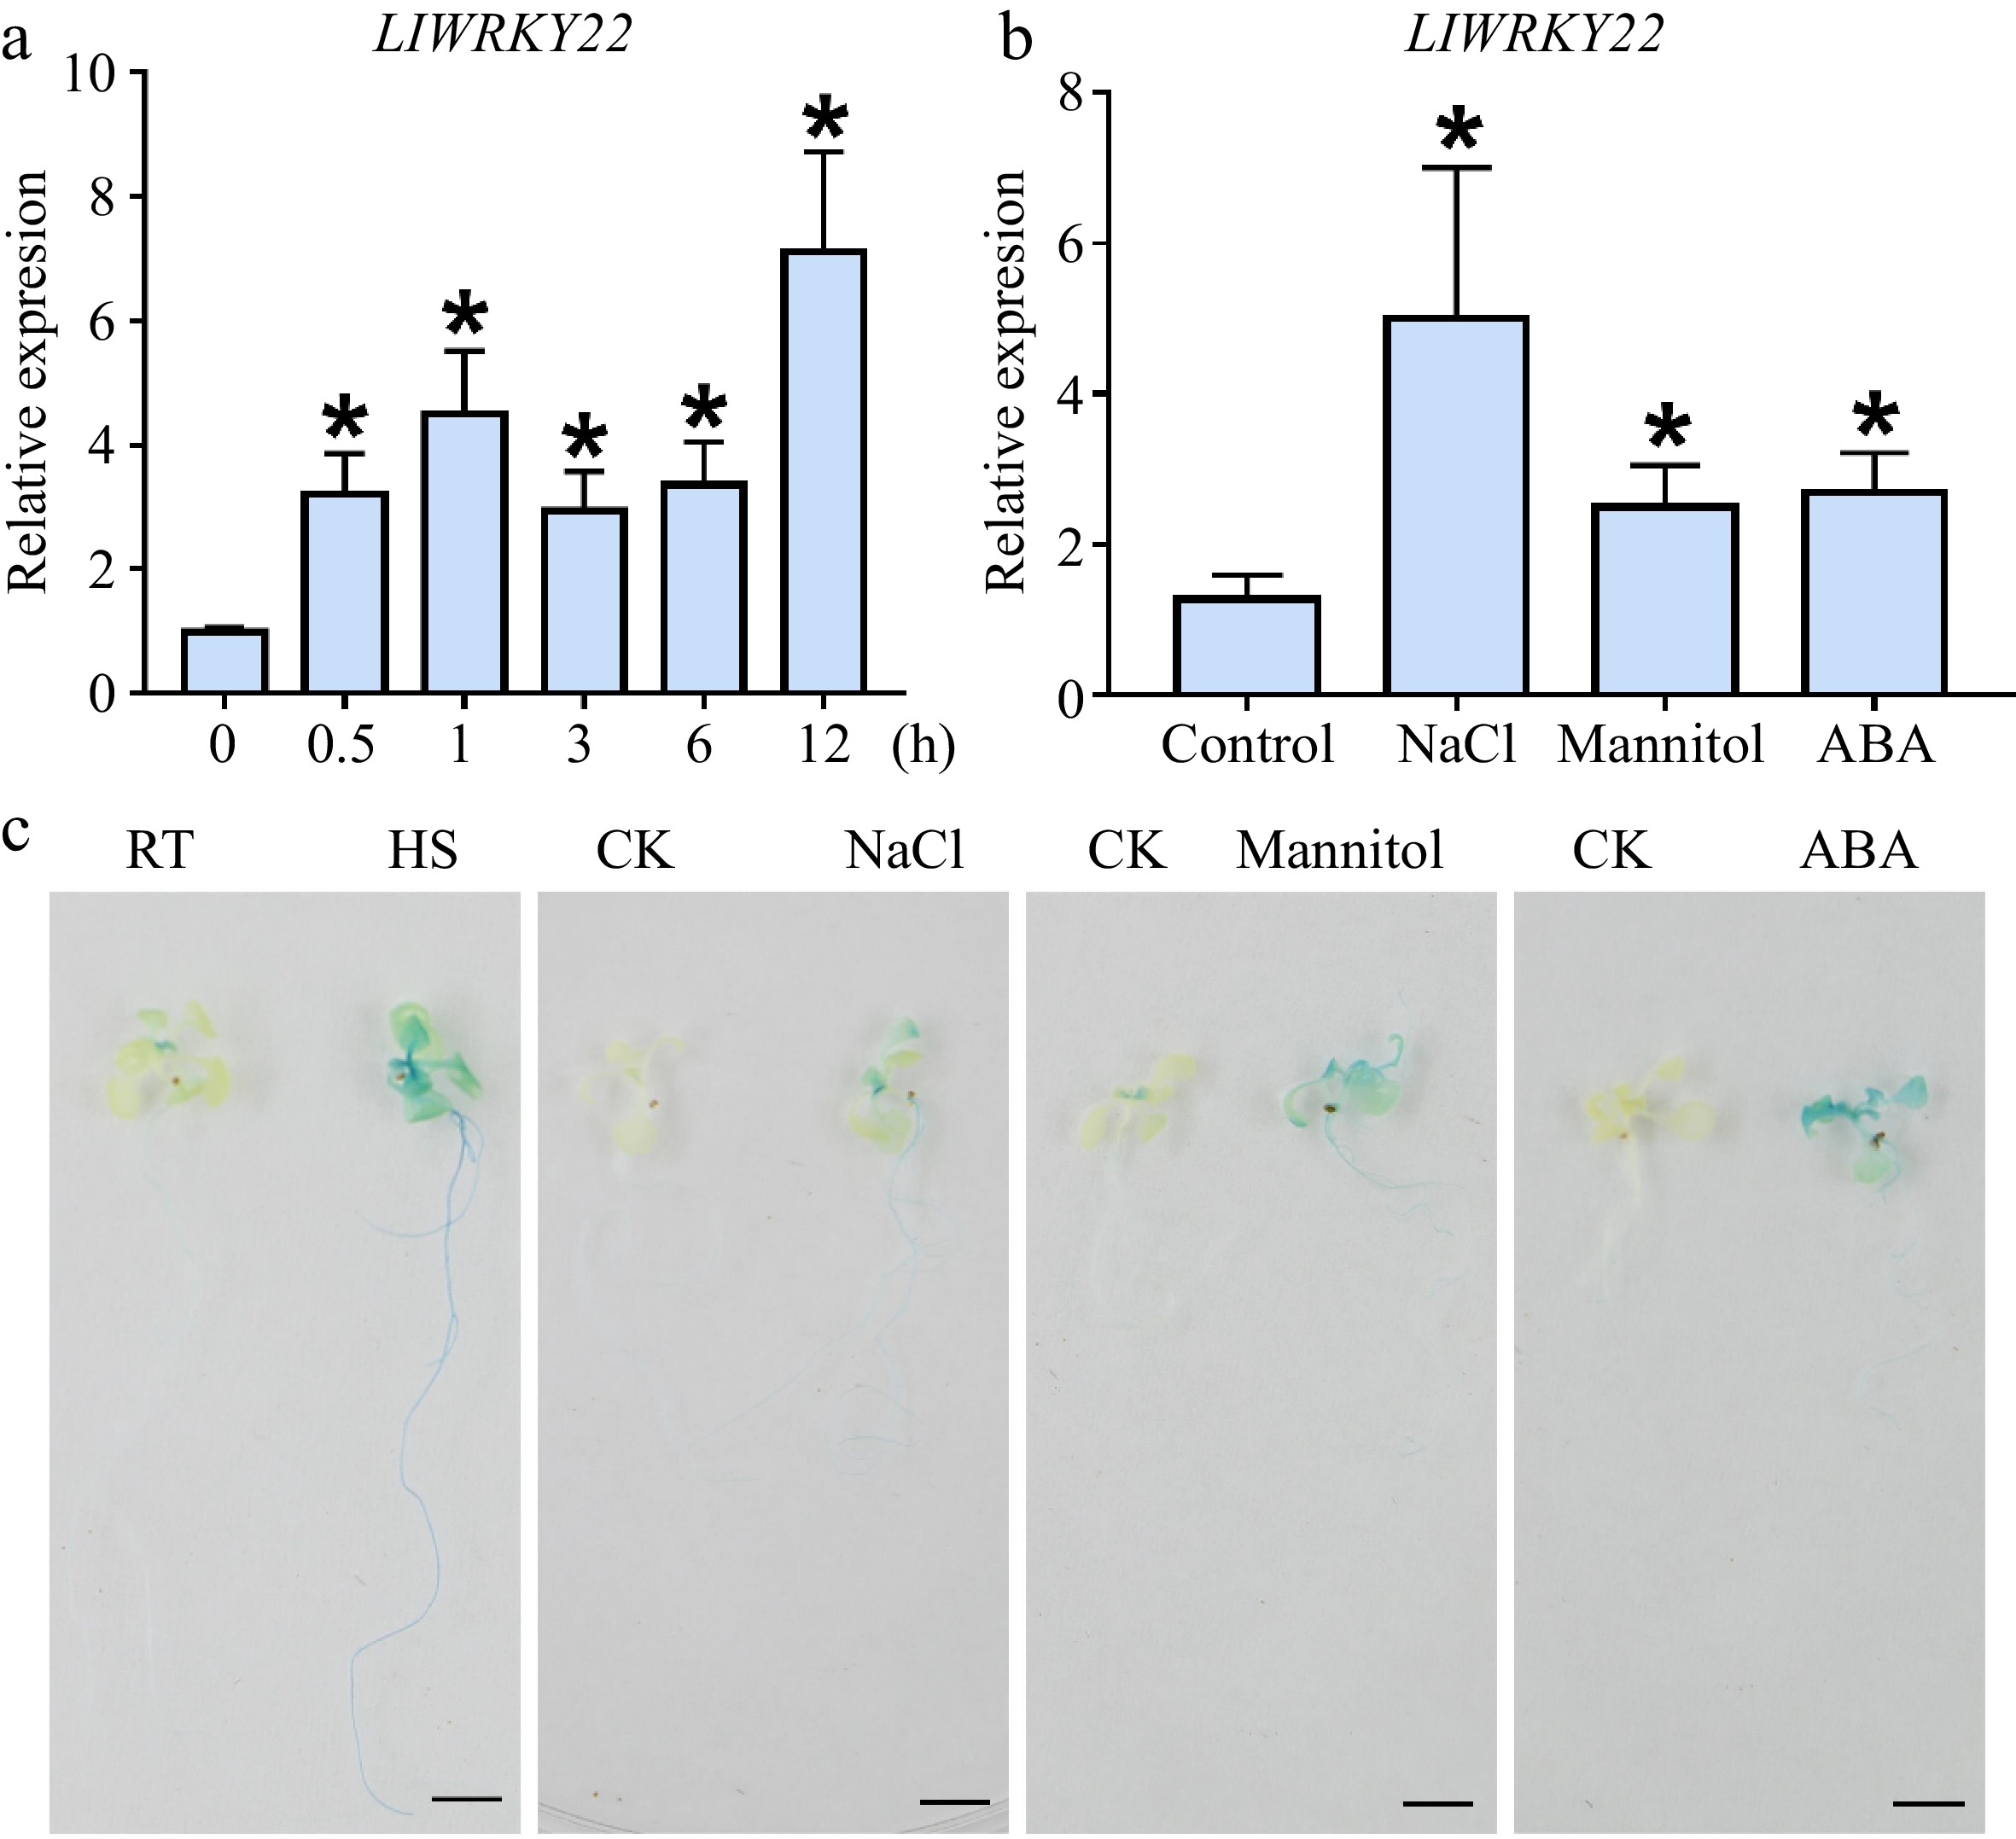
Figure 1.
The expression analysis of LlWRKY22 under different abiotic stresses. (a) Analysis of LlWRKY22 expression pattern in lily leaves after time-controlled exposure to 37 °C. (b) Detection of LlWRKY22 expression in lily under NaCl, mannitol, or ABA treatment. The tissue-cultured seedlings of lily were treated with water (CK), salt solution (NaCl, 200 mM), mannitol solution (300 mM), or ABA solution (10 μM) for 3 h, after which their leaves were collected for expression analysis. The data were normalized to the lily 18S rRNA, and the 2−ΔΔCᴛ method was used in the RT-qPCR analysis. Data are the mean (± SD) of three independent experiments (Student’s t-test, *P < 0.05). (c) Promoter activity in the LlWRKY22-pro::GUS transgenic Arabidopsis seedlings under different treatments. The 10-day-old seedlings were selected for the promoter activity analysis. RT, room temperature (22 °C), HS, heat stress (37 °C, 3 h). CK, control (sterile water). NaCl, NaCl solution (200 mM, 3 h). Mannitol, mannitol solution (400 mM, 3 h). ABA, ABA solution (10 μM, 3 h). Three replicates were conducted, and one representative picture is presented. Scale bar = 1 cm.
-
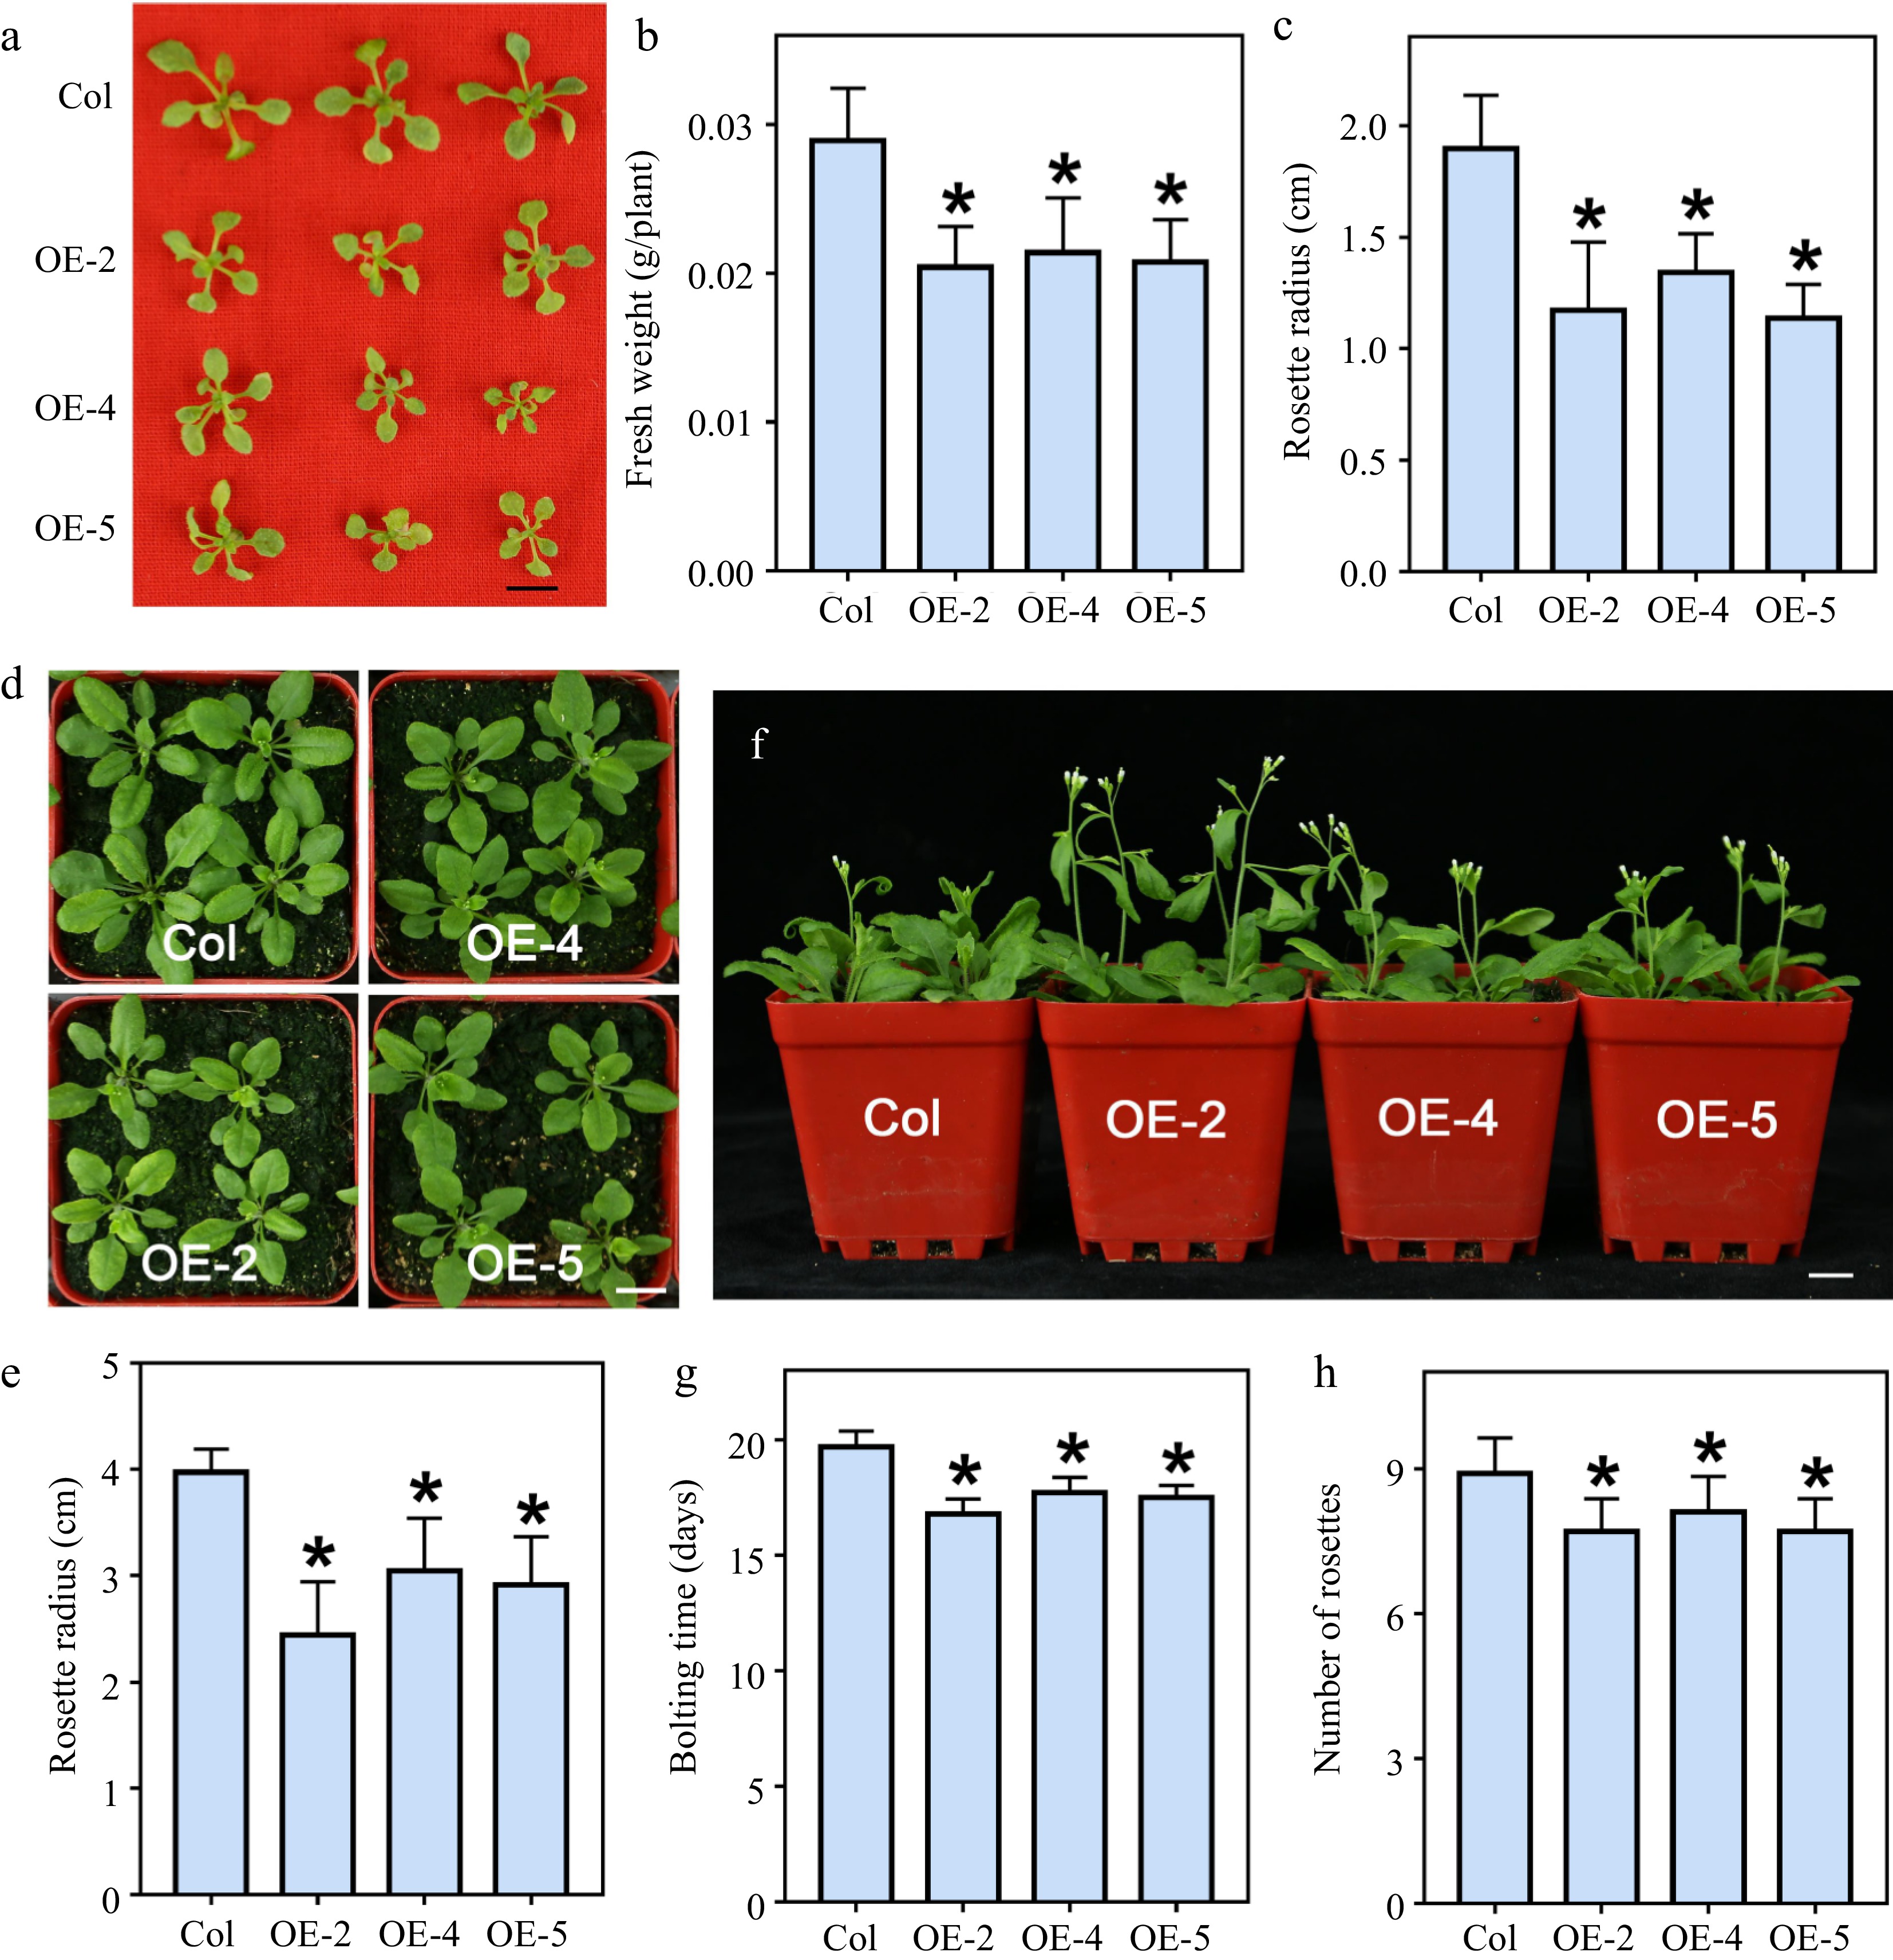
Figure 2.
The growth phenotypes of LlWRKY22 overexpression Arabidopsis plants. (a) The 3-week-old wild-type and transgenic seedlings grew on MS medium. Scale bar = 1 cm. (b) Fresh weight of three-week-old plants which grew on MS medium. Bars are means ± SD of the tested plants (n = 9). (c) Rosette radii of 3-week-old seedlings growing on MS medium. Bars are means ± SD of the tested plants (n = 9). (d) The seedlings growing on agar were transferred from agar plates to soil for 2 weeks. Scale bar = 1 cm. The representative picture is based on three replicates. (e) Rosette radii of 2-week-old plants which grew on the soil were counted. Bars are means ± SD of the tested plants (n = 12). Three replicates were performed, and one representative picture is shown. (f) Seedlings were planted on agar plates for 10 d and then transmitted to soil for 3 weeks. Scale bar = 1 cm. The representative picture is based on three replicates. (g) Bolting time of wild-type and transgenic seedlings. Bars are means ± SD of three independent experiments. (h) Rosette leaf number of the bolting plants. Bars are means ± SD of three replicates (n = 12, Student's t-test, * P < 0.05).
-
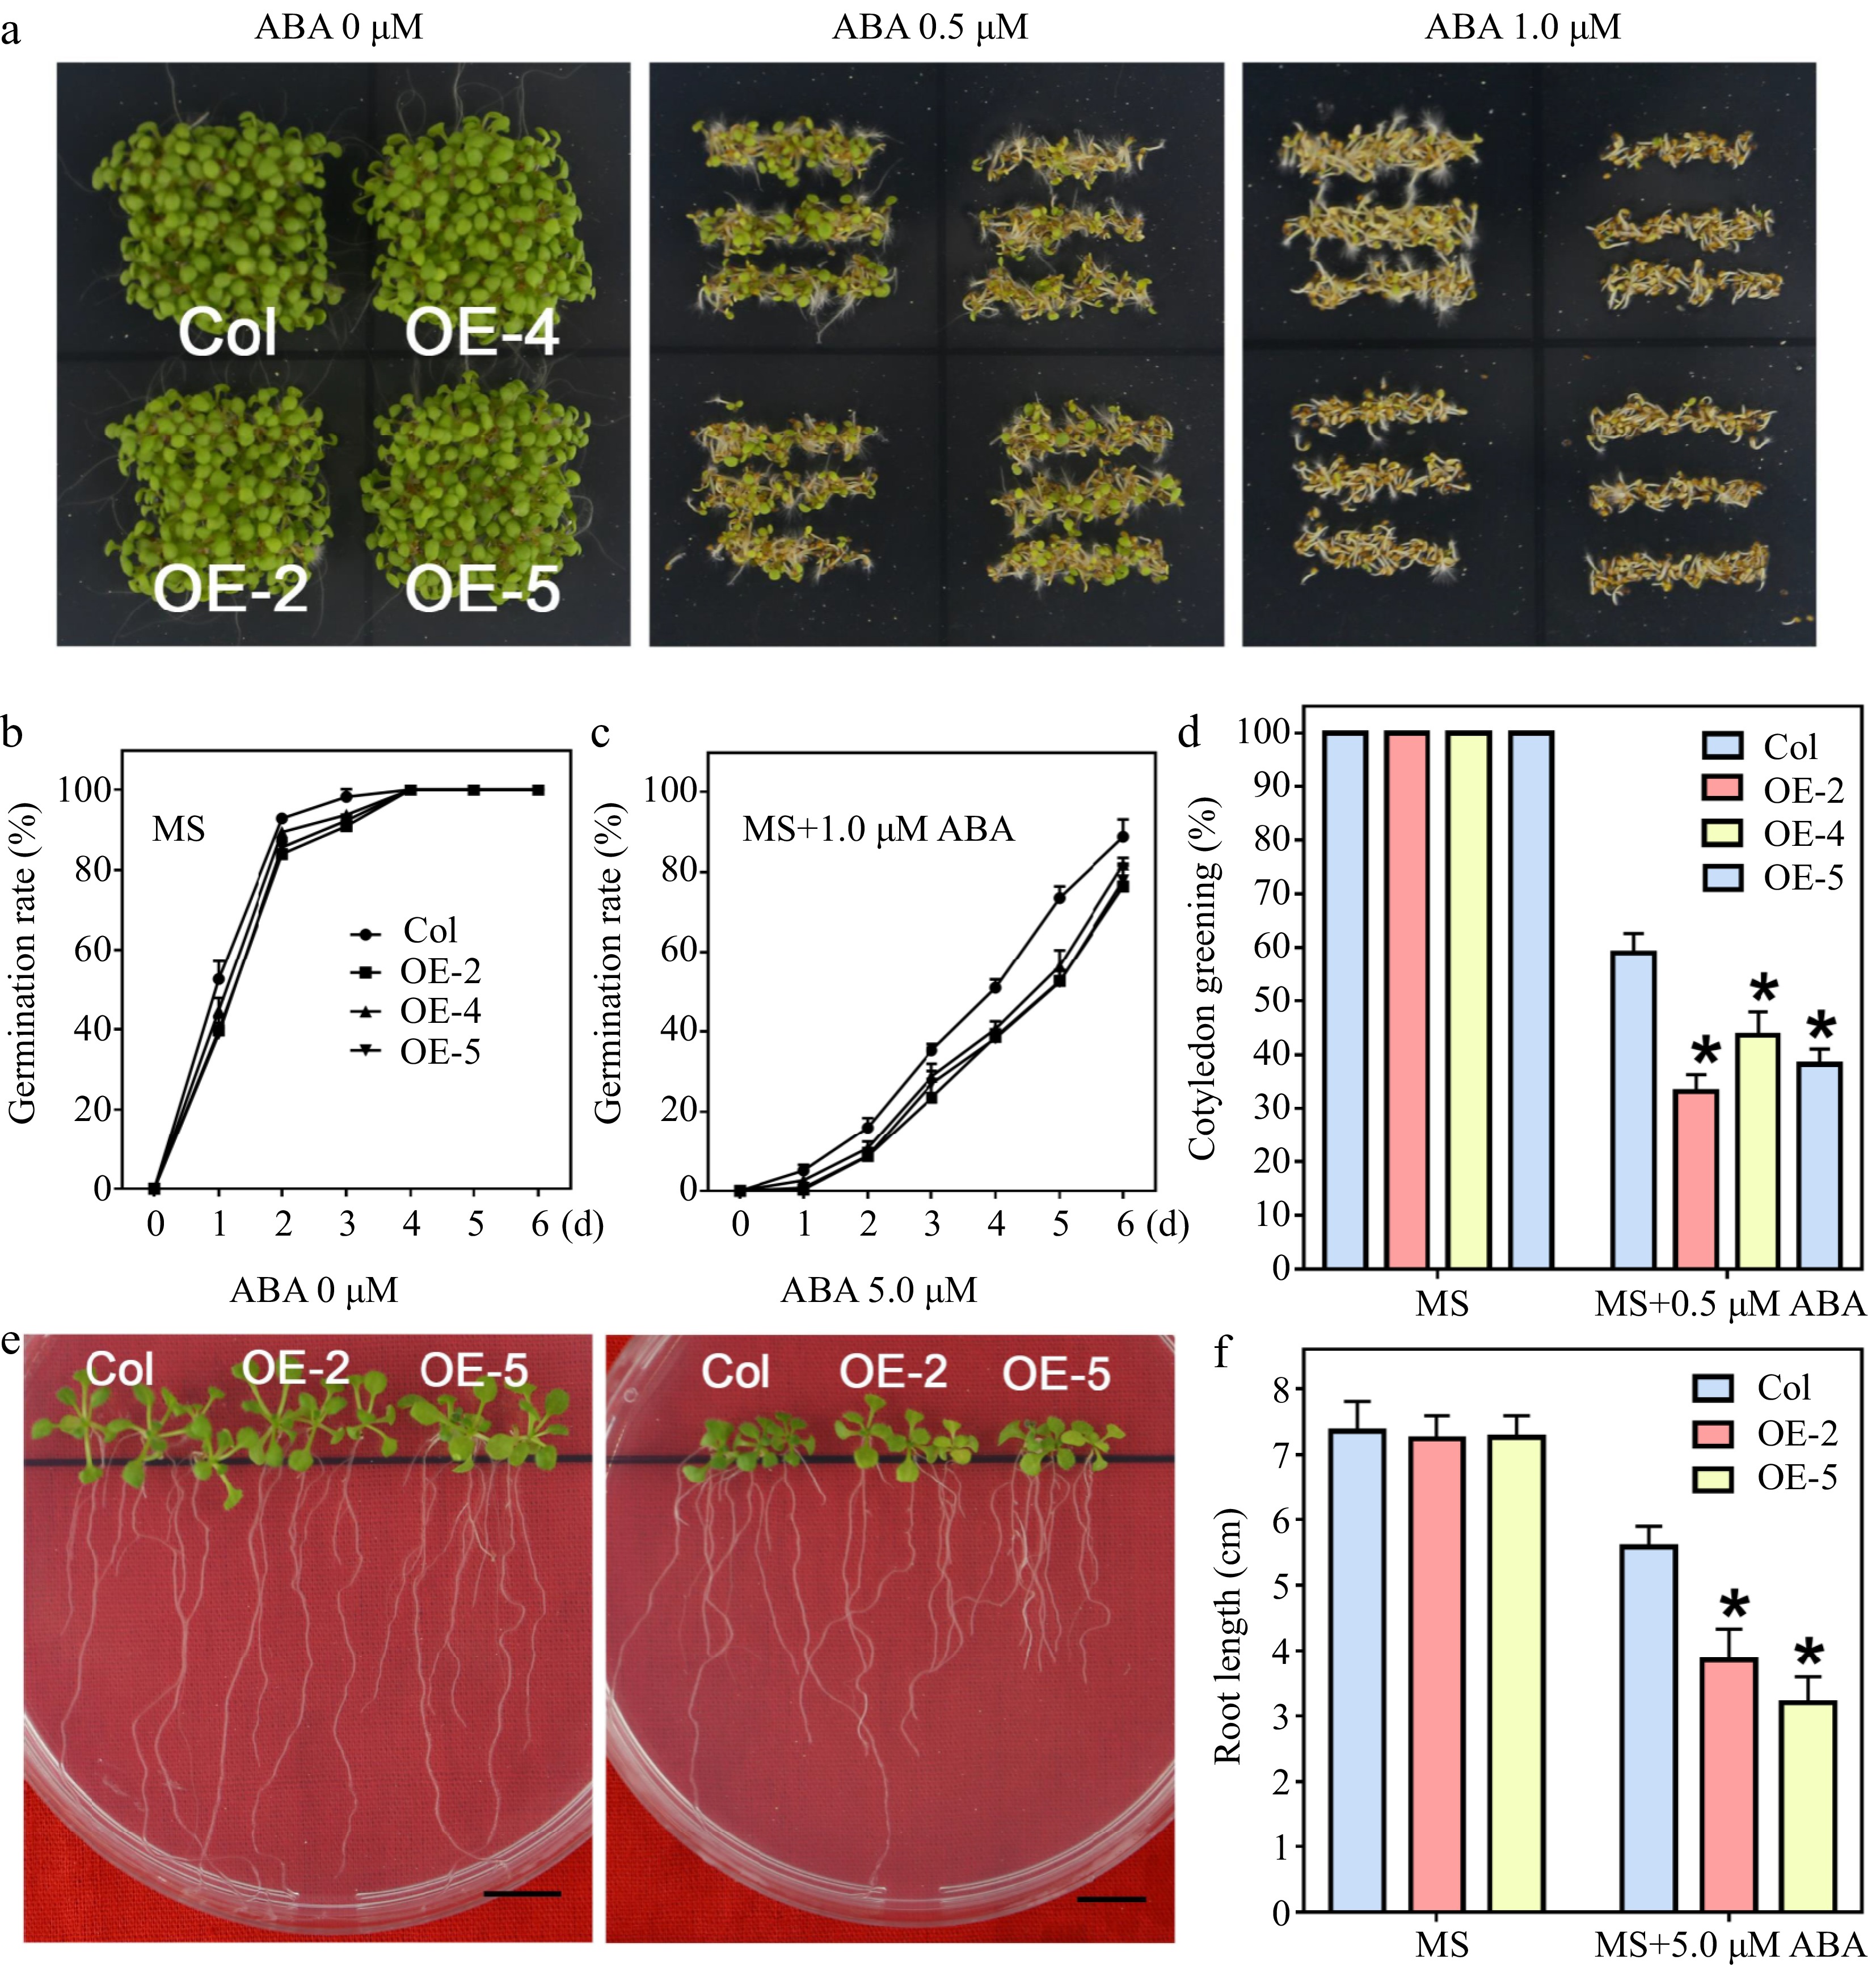
Figure 3.
Seed germination and seedling growth of LlWRKY22 overexpression Arabidopsis plants responding to ABA treatments. (a) The wild-type and transgenic Arabidopsis seeds were planted on ABA-supplemented MS medium for 6 d under light. Three replicates were performed and one representative image was exhibited. (b), (c) Seeds germinated on MS medium with or without 1.0 μM ABA and the germination rates were recorded daily. (d) Seeds were sown on MS medium with or without 0.5 μM ABA, and the percentage of cotyledon greening was recorded after 6 d. Data represent the means (± SD) of three replicates (Student's t-test, * P < 0.05). (e) The 5-day-old seedlings were used as materials and transplanted to MS medium with or without 5.0 μM ABA, and after 10 d of growth, the root lengths were photographed. Scale bar = 1 cm. (f) Root elongation of each plant was calculated, and the average value of 9 biological replicates for each line is shown. Bars are means ± SD of three replicates (n = 9, Student's t-test, * P < 0.05).
-
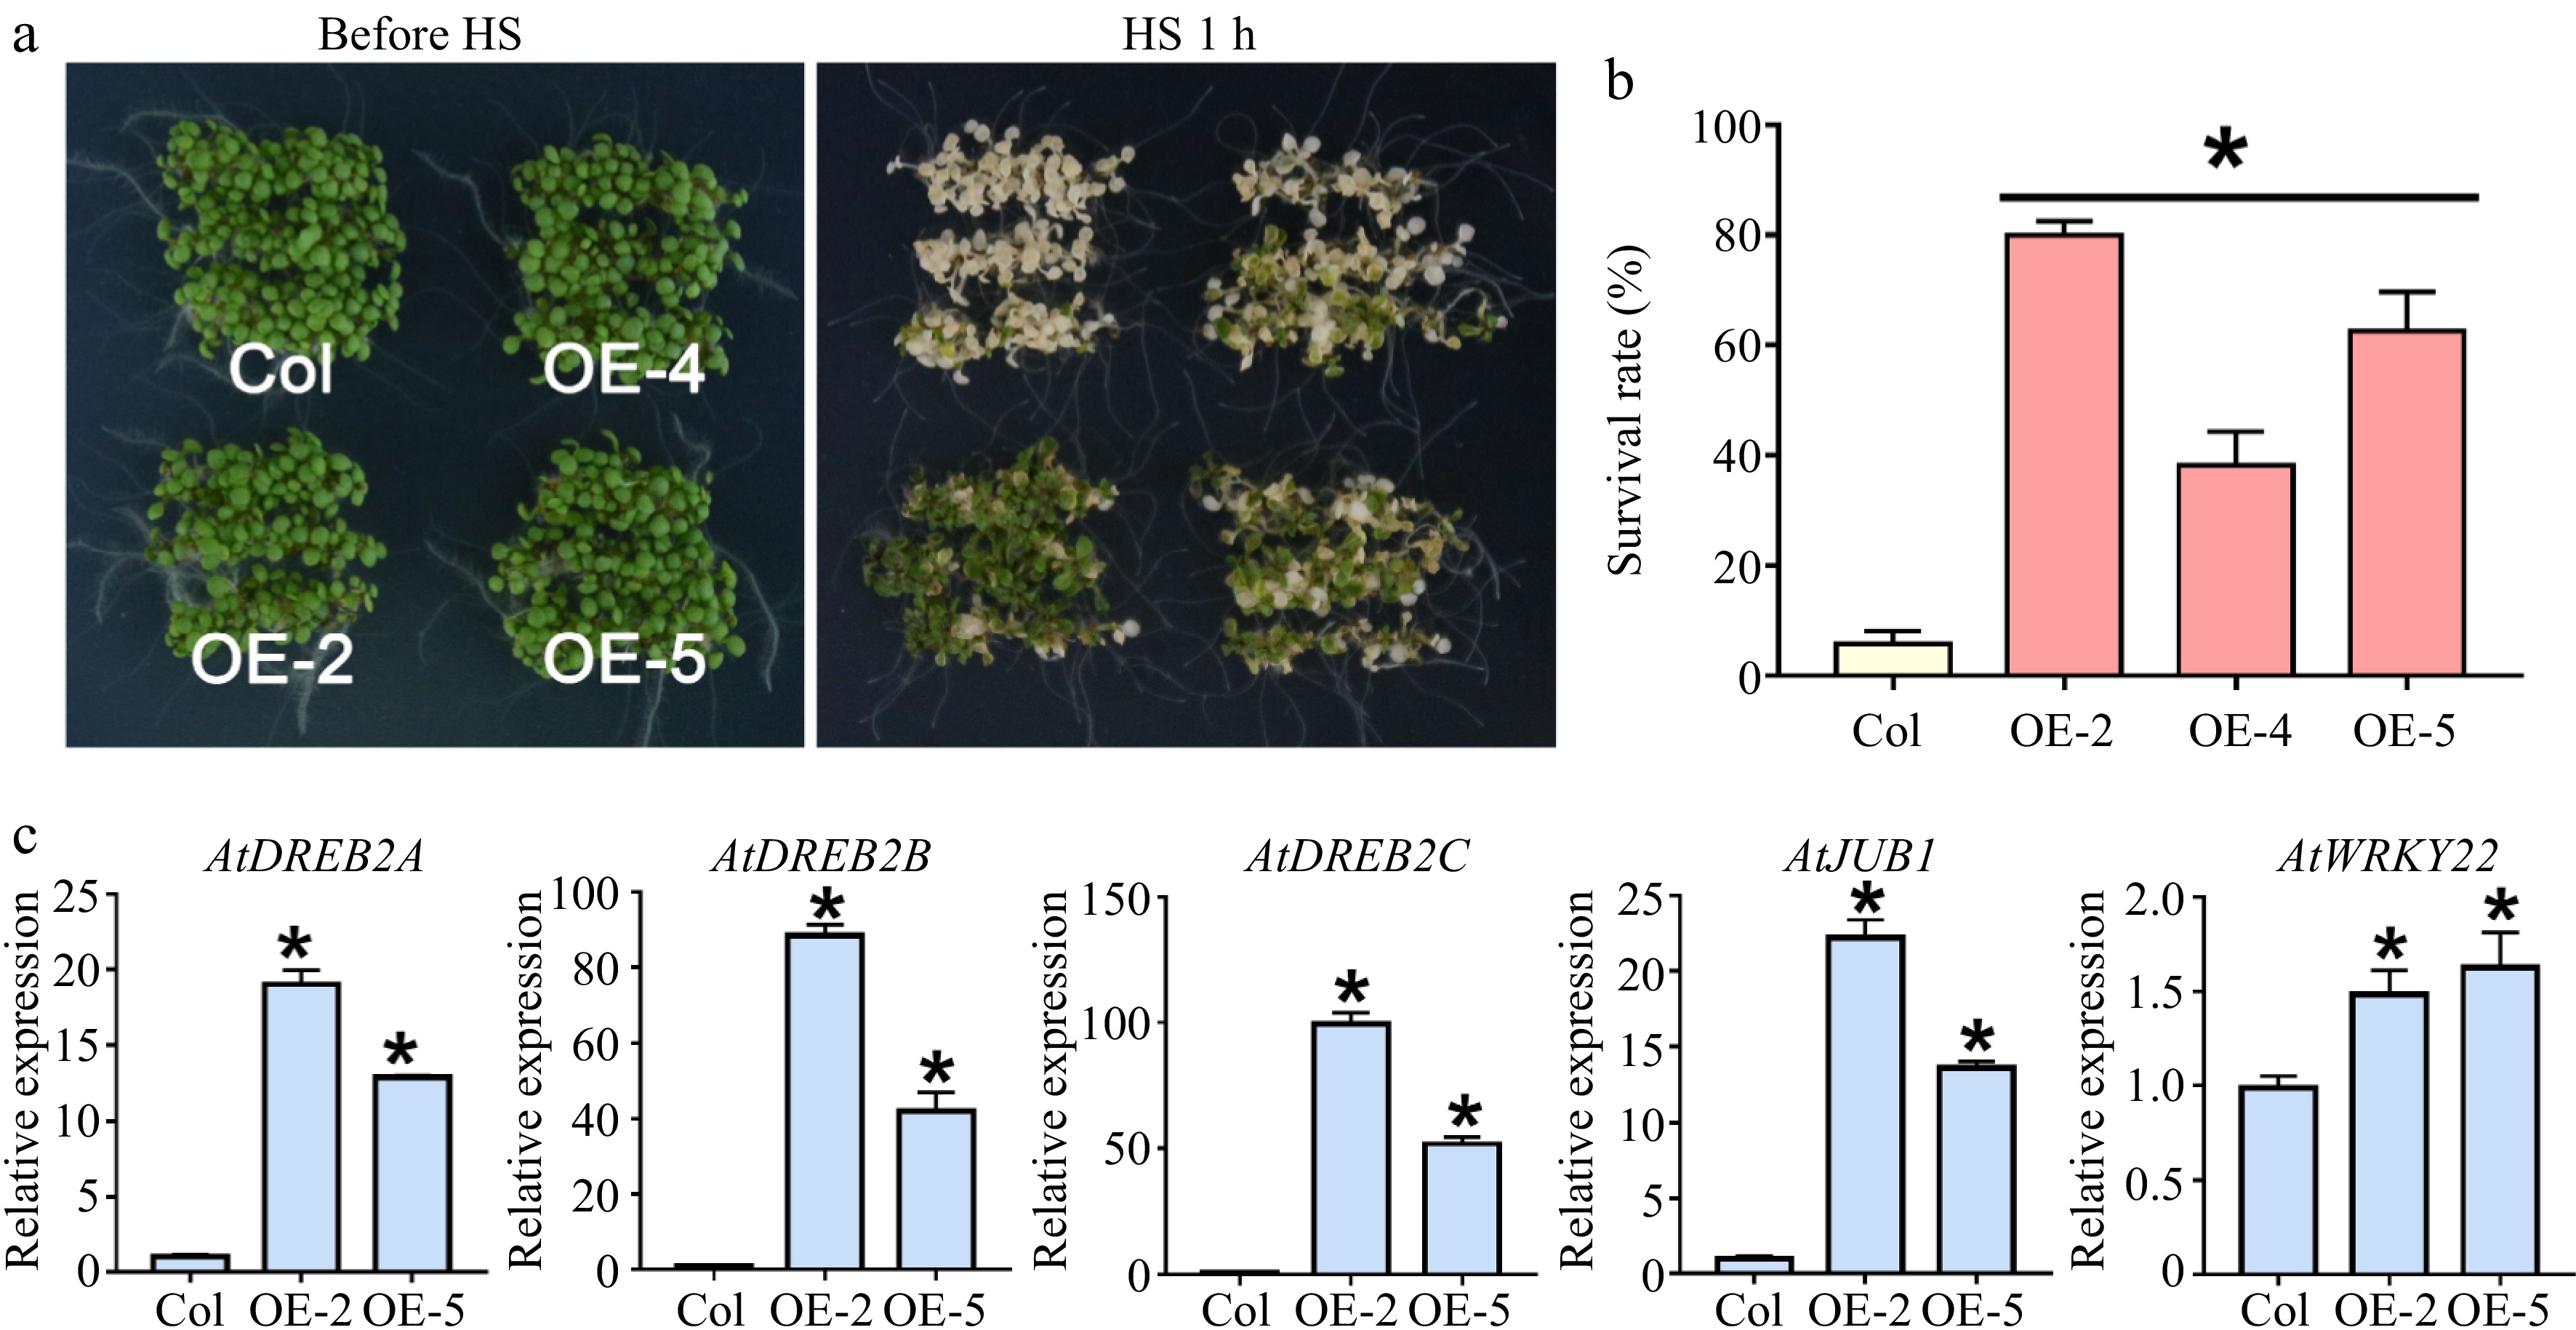
Figure 4.
Thermotolerance test of LlWRKY22 overexpressing Arabidopsis plants. (a) The thermotolerance of three LlWRKY22 overexpression lines (OE-2, OE-4, and OE-5) were examined. The phenotypes with 1-h 45 °C heat stress (HS) of wild-type and transgenic seedlings are exhibited. (b) The survival rate of wild type and transgenic lines was calculated after HS following by a 7-day recovery at 22 °C. Data are the mean ± SD of three replicates (Student's t-test, * P < 0.05). (c) Expression of AtDREB2A, AtDREB2B, AtDREB2C, AtJUB1, and AtWRKY22 under normal conditions was detected in transgenic Arabidopsis plants under normal conditions. Data are the mean ± SD of three replicates (Student's t-test, * P < 0.05).
-
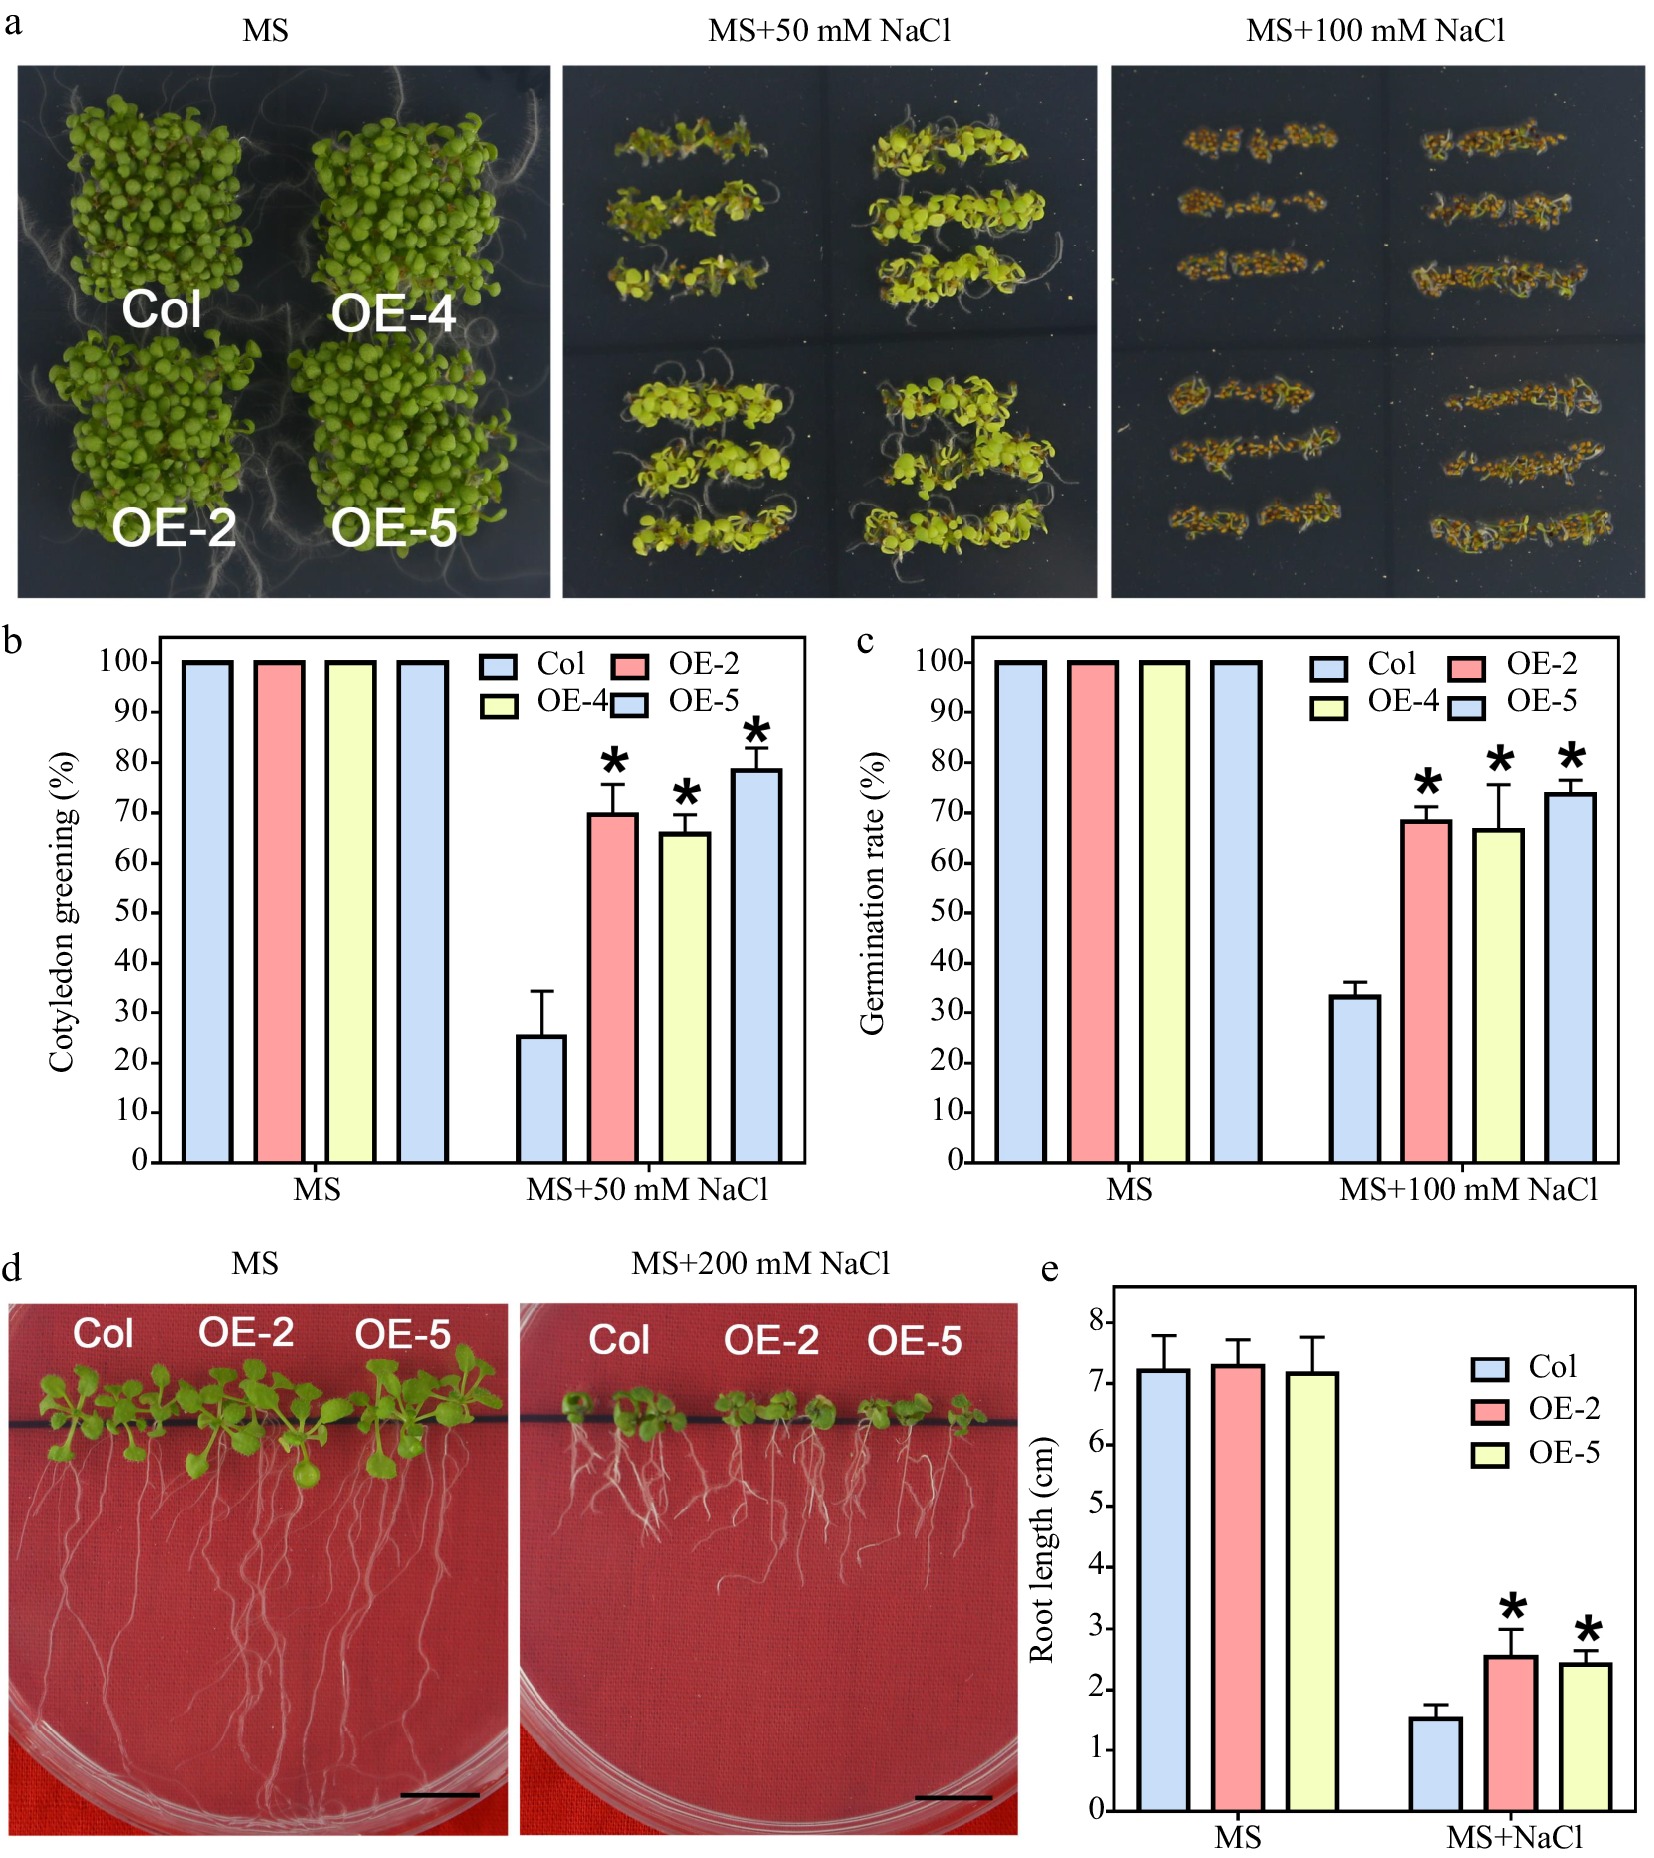
Figure 5.
Salt tolerance test of LlWRKY22 overexpression Arabidopsis plants. (a) Wild-type and transgenic Arabidopsis lines were cultivated and photographed on NaCl-supplemented MS medium for 5 d under light. Three independent experiments were performed and one representative picture is presented. (b), (c) The germination rate of seeds which germinated on the MS medium with 100 mM NaCl were recorded daily (MS medium without NaCl served as control). Data represent means ± SD of three biological replicates (Student's t-test, * P < 0.05). (d) The cotyledon greening rate of seeds which germinated on the MS medium with or without 50 mM NaCl was recorded after 6 d. Data represent means ± SD of three biological replicates (Student's t-test, * P < 0.05). (e) The 5-day-old seedlings were used as materials and grew on MS medium with or without 200 mM NaCl for 10 d, after which their root lengths were recorded and photographed. Scale bar = 1 cm. Bars are means ± SD of three replicates (n = 9, Student's t-test, * P < 0.05).
-
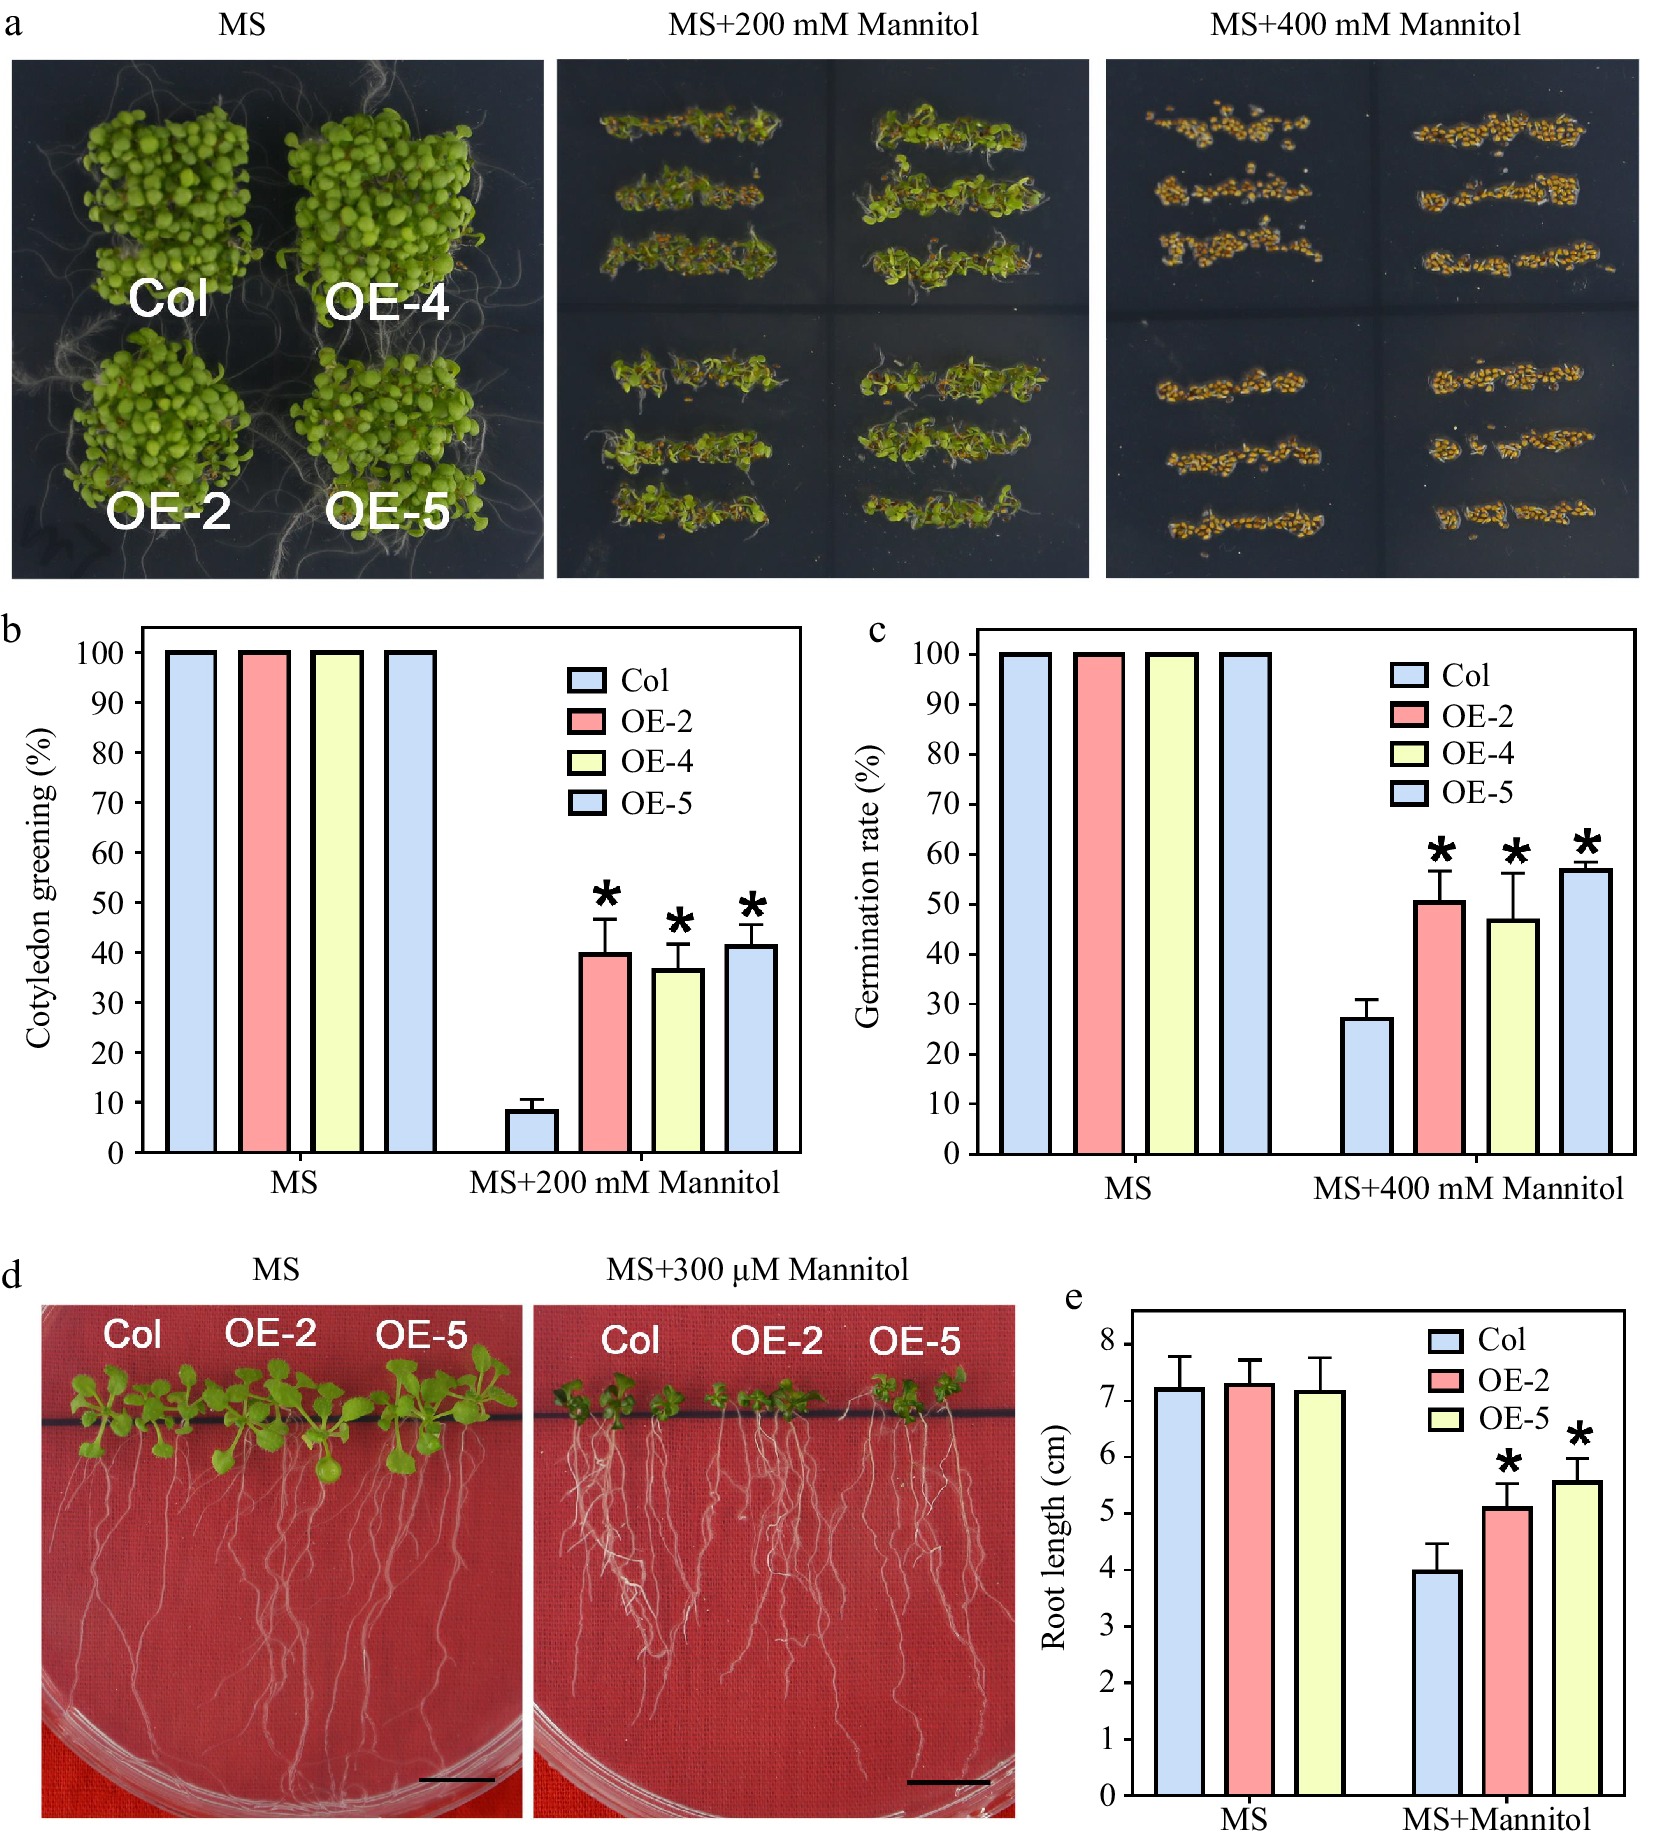
Figure 6.
Mannitol tolerance test of LlWRKY22 overexpression Arabidopsis plants. (a) Wild-type and transgenic Arabidopsis lines were planted under light for 5 d on mannitol-supplemented MS medium and the seed germination was photographed and recorded. Three independent experiments were conducted and one representative picture is shown. (b), (c) The germination rate of seeds which germinated on MS medium with 400 mM mannitol were recorded daily (MS medium without mannitol served as control). Data represent means ± SD of three biological replicates (Student's t-test, * P < 0.05). (d) The cotyledon greening rate of seeds which germinated for 6 d on the MS medium with 200 mM mannitol was recorded (MS medium without mannitol served as control). Data represent means ± SD of three biological replicates (Student's t-test, * P < 0.05). (e) Root lengths of 5-day-old seedlings were transplanted to MS medium with or without 300 mM mannitol. After 10 d, their root lengths were recorded and photographed. Scale bar = 1 cm. Bars are means ± SD of three replicates (n = 9, Student's t-test, * P < 0.05).
Figures
(6)
Tables
(0)