-
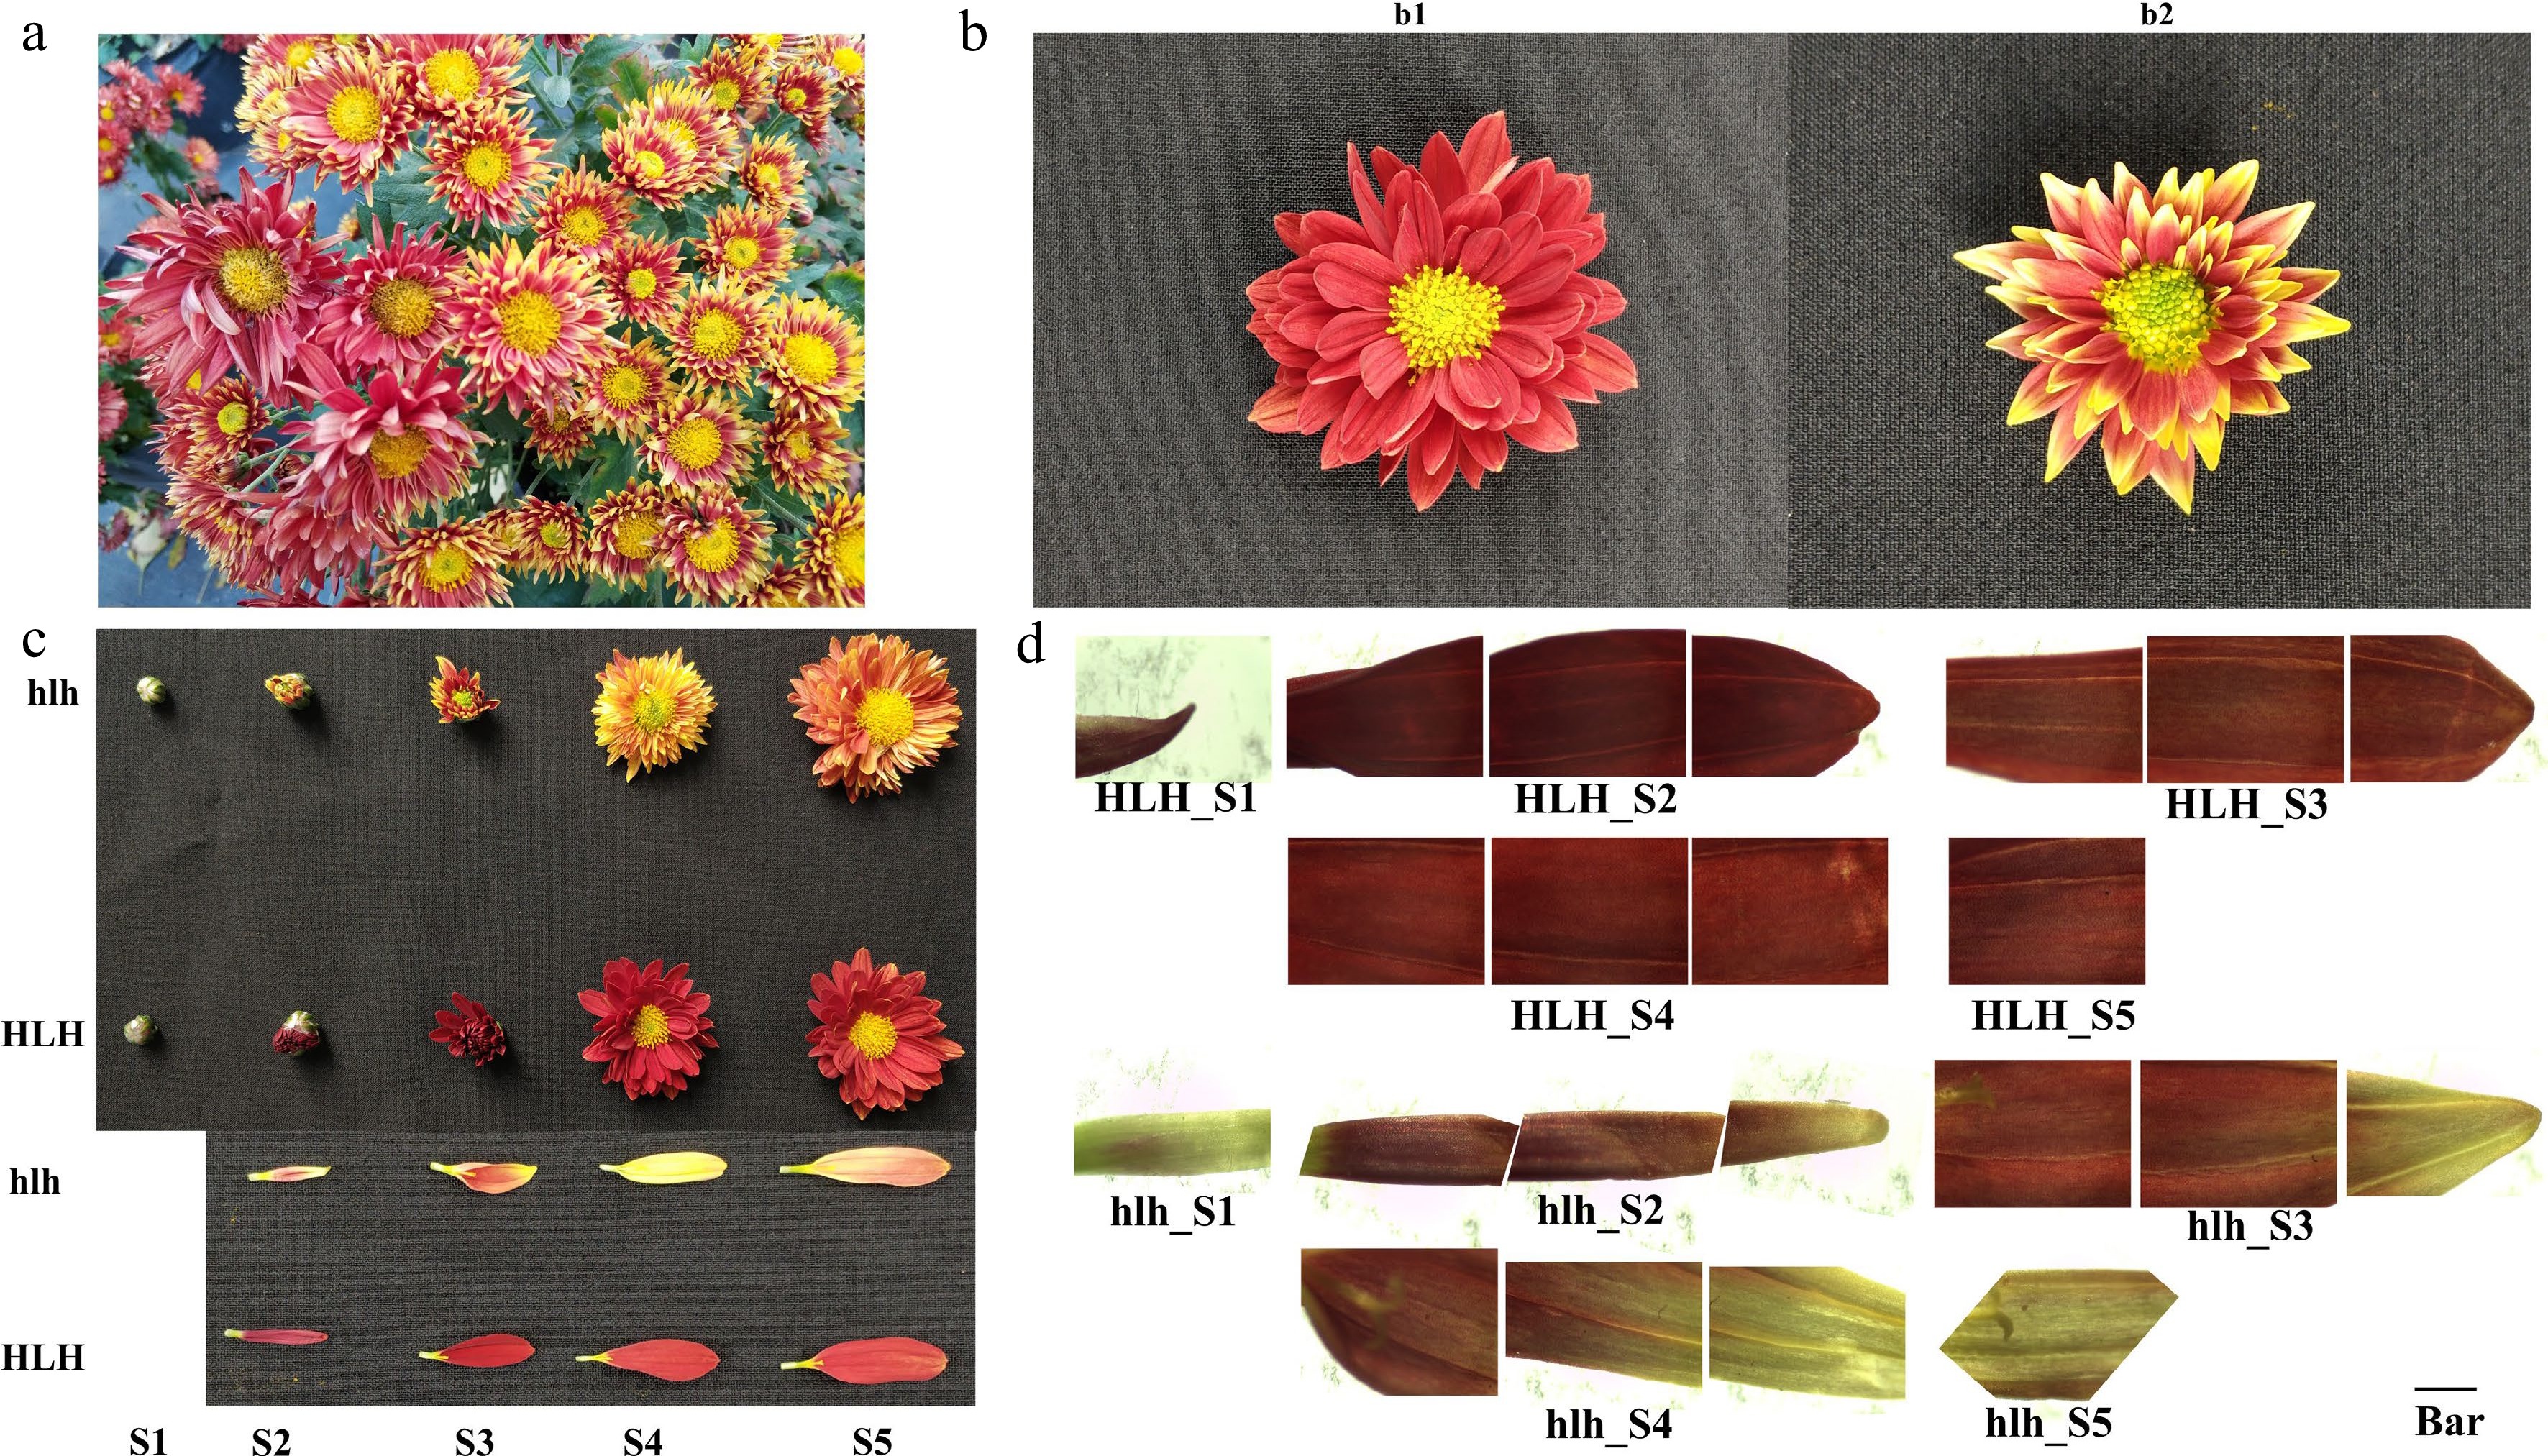
Figure 1.
Appearance of mutant and stabilization of mutant character, (a) first appearance of flower color mutant in C. morifolium. The different shoots displayed varied flower colors in the same plant; (b) the mutation was fixed by using micro-cutting technology. (b1) Original parent flower (HLH); (b2) stabilized mutant flower (hlh); (c) comparison of flower color changes between HLH and hlh at five development stages; (d) representative bright field microscopic images of petal sections for five stages of flower development. From left to right in each stage are the base, middle and tip of the ray floret; Bar = 1 cm, The microscope magnification = 35 ×.
-
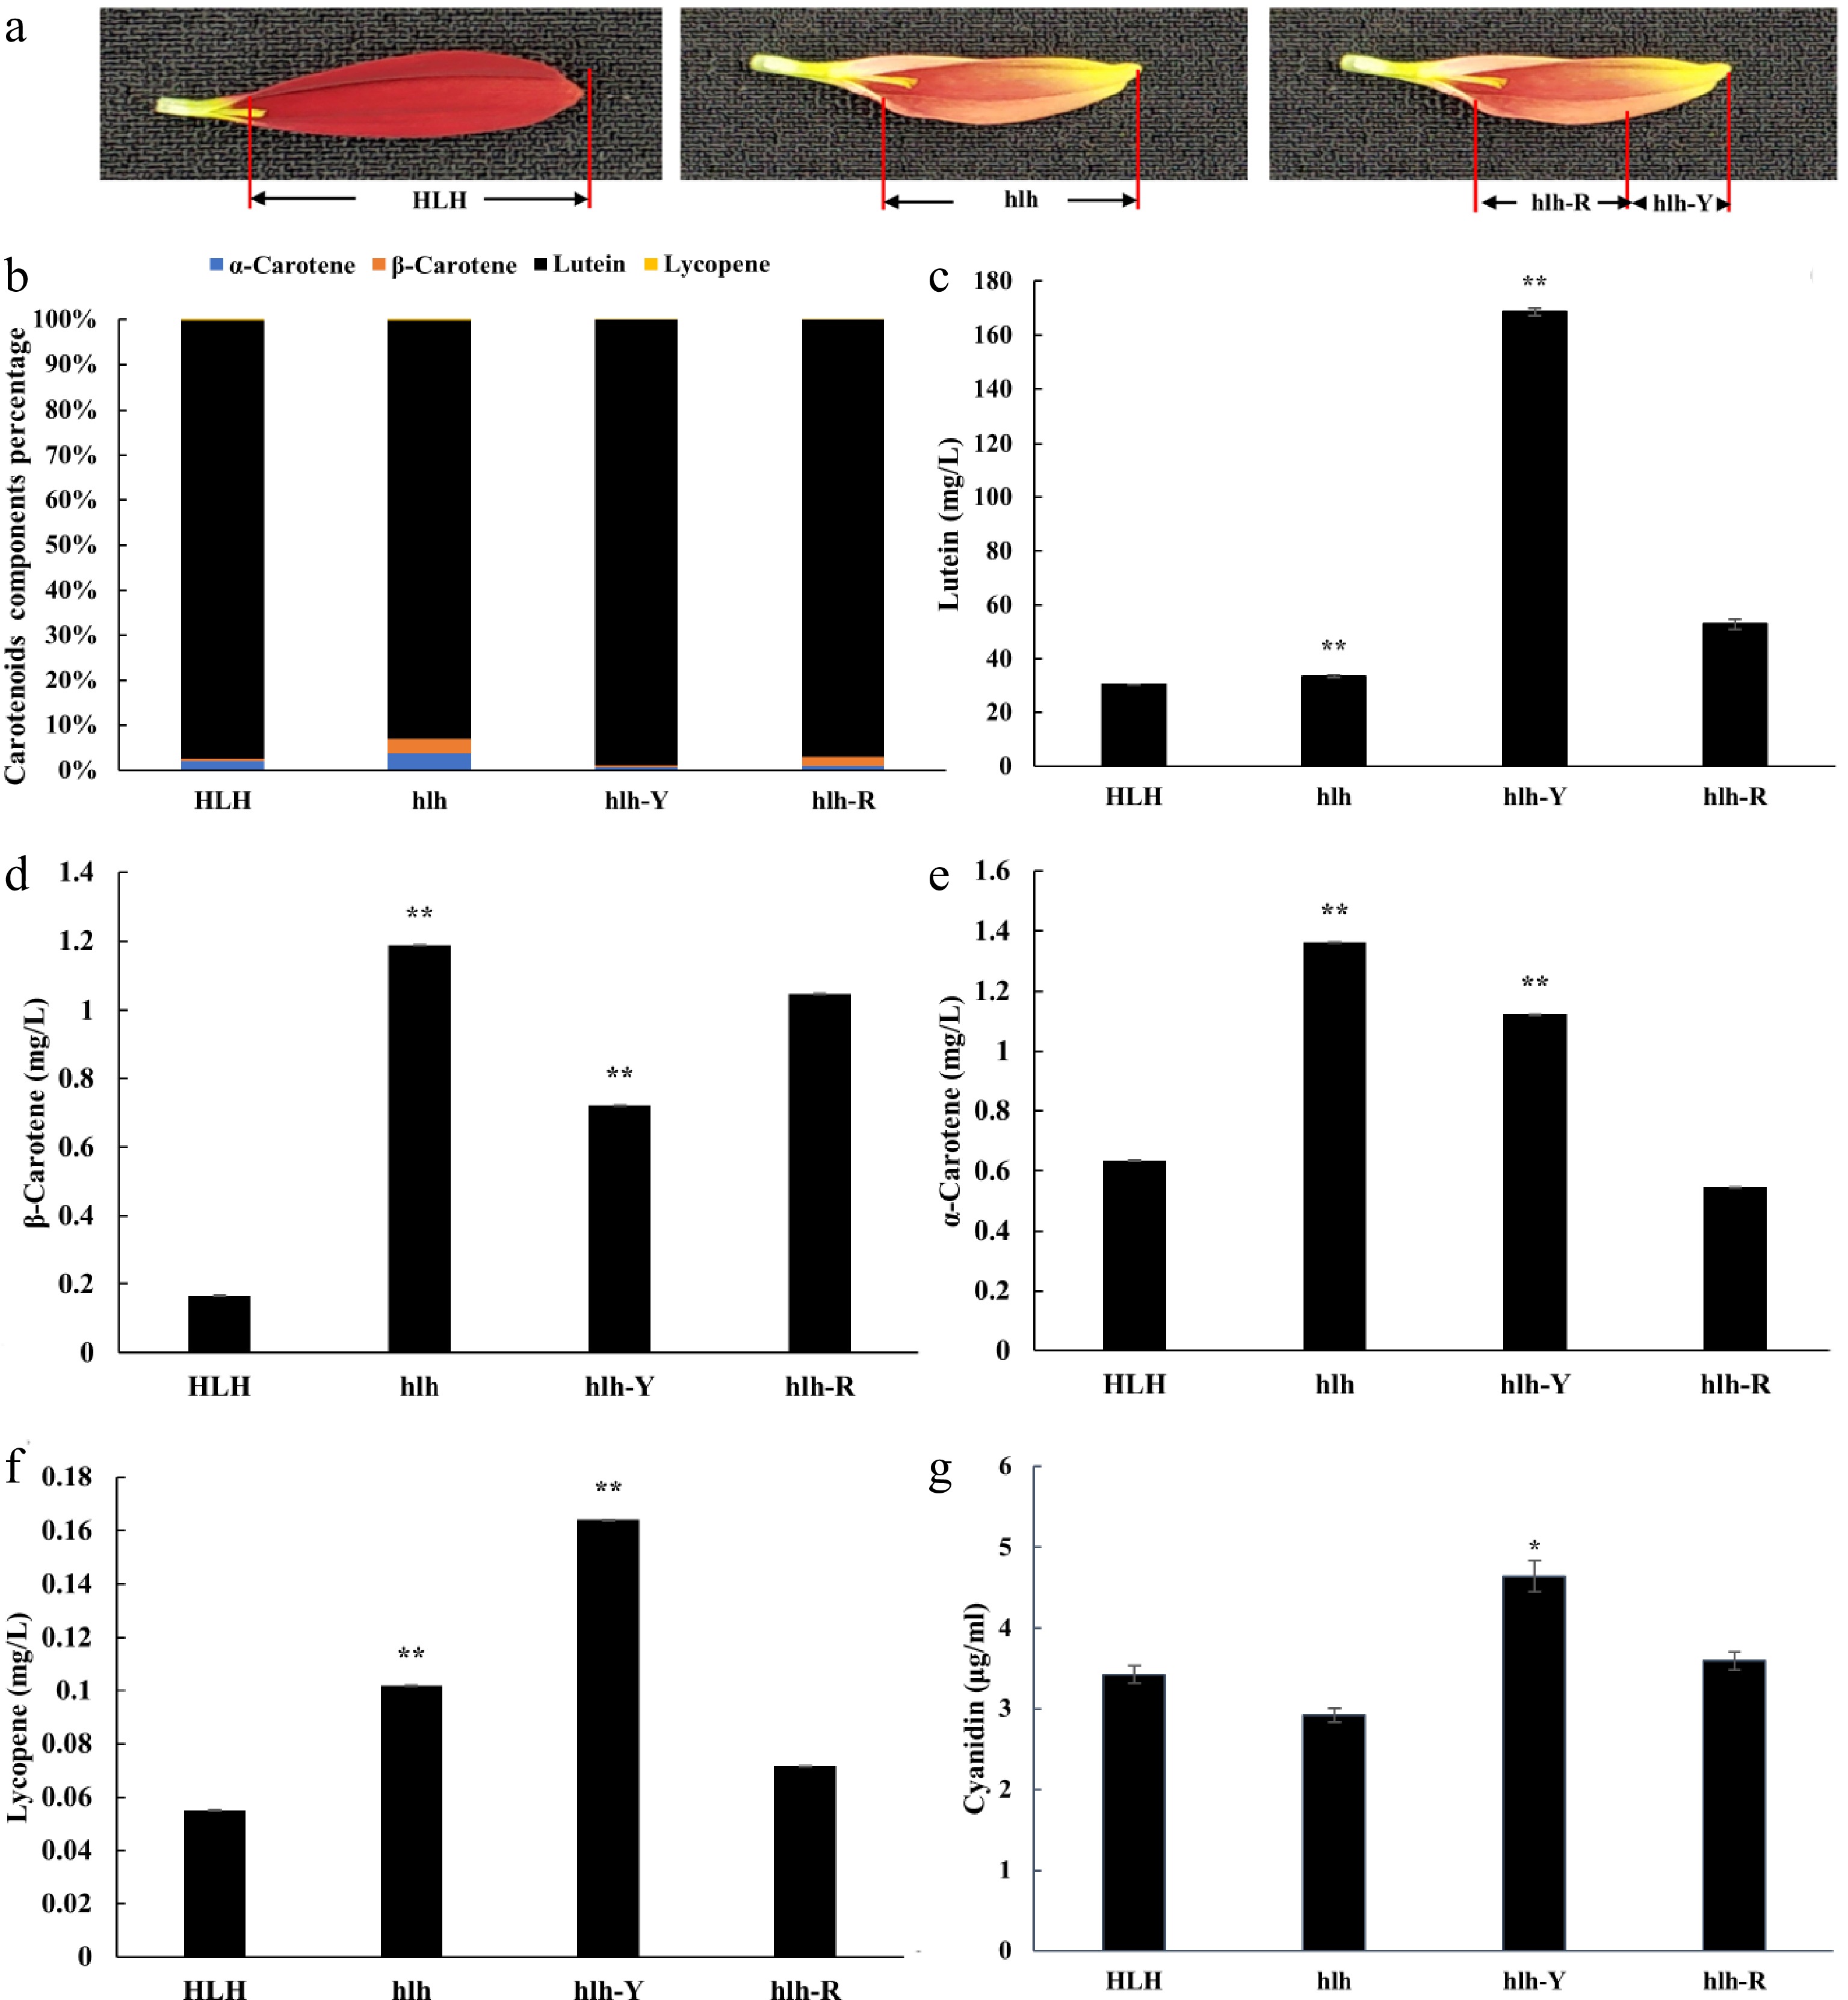
Figure 2.
The HPLC-MS/MS concentrations of carotenoids (α-carotene, β-carotene, lutein and lycopene) and anthocyanidins (cyanidin). Distribution of pigments were compared with parent (HLH) and mutant (hlh) at the whole flower petal level and distinct position level within the petal of mutant flowers at third stage of development. (a) Schematic diagram of sample collection of hlh-R and hlh-Y, hlh-R represents the red base samples collected from the petals of mutant flower, hlh-Y represents the yellow tip samples collected from the petals of mutant flower; (b) represents percentage of each carotenoids components; (c) represents changes in lutein content; (d) represents changes in β-carotene content; (e) represents changes in α-carotene content; (f) represents changes in lycopene content; (g) represents changes in cyanidin content. Significance is shown at p < 0.05 (*) and p < 0.01 (**).
-
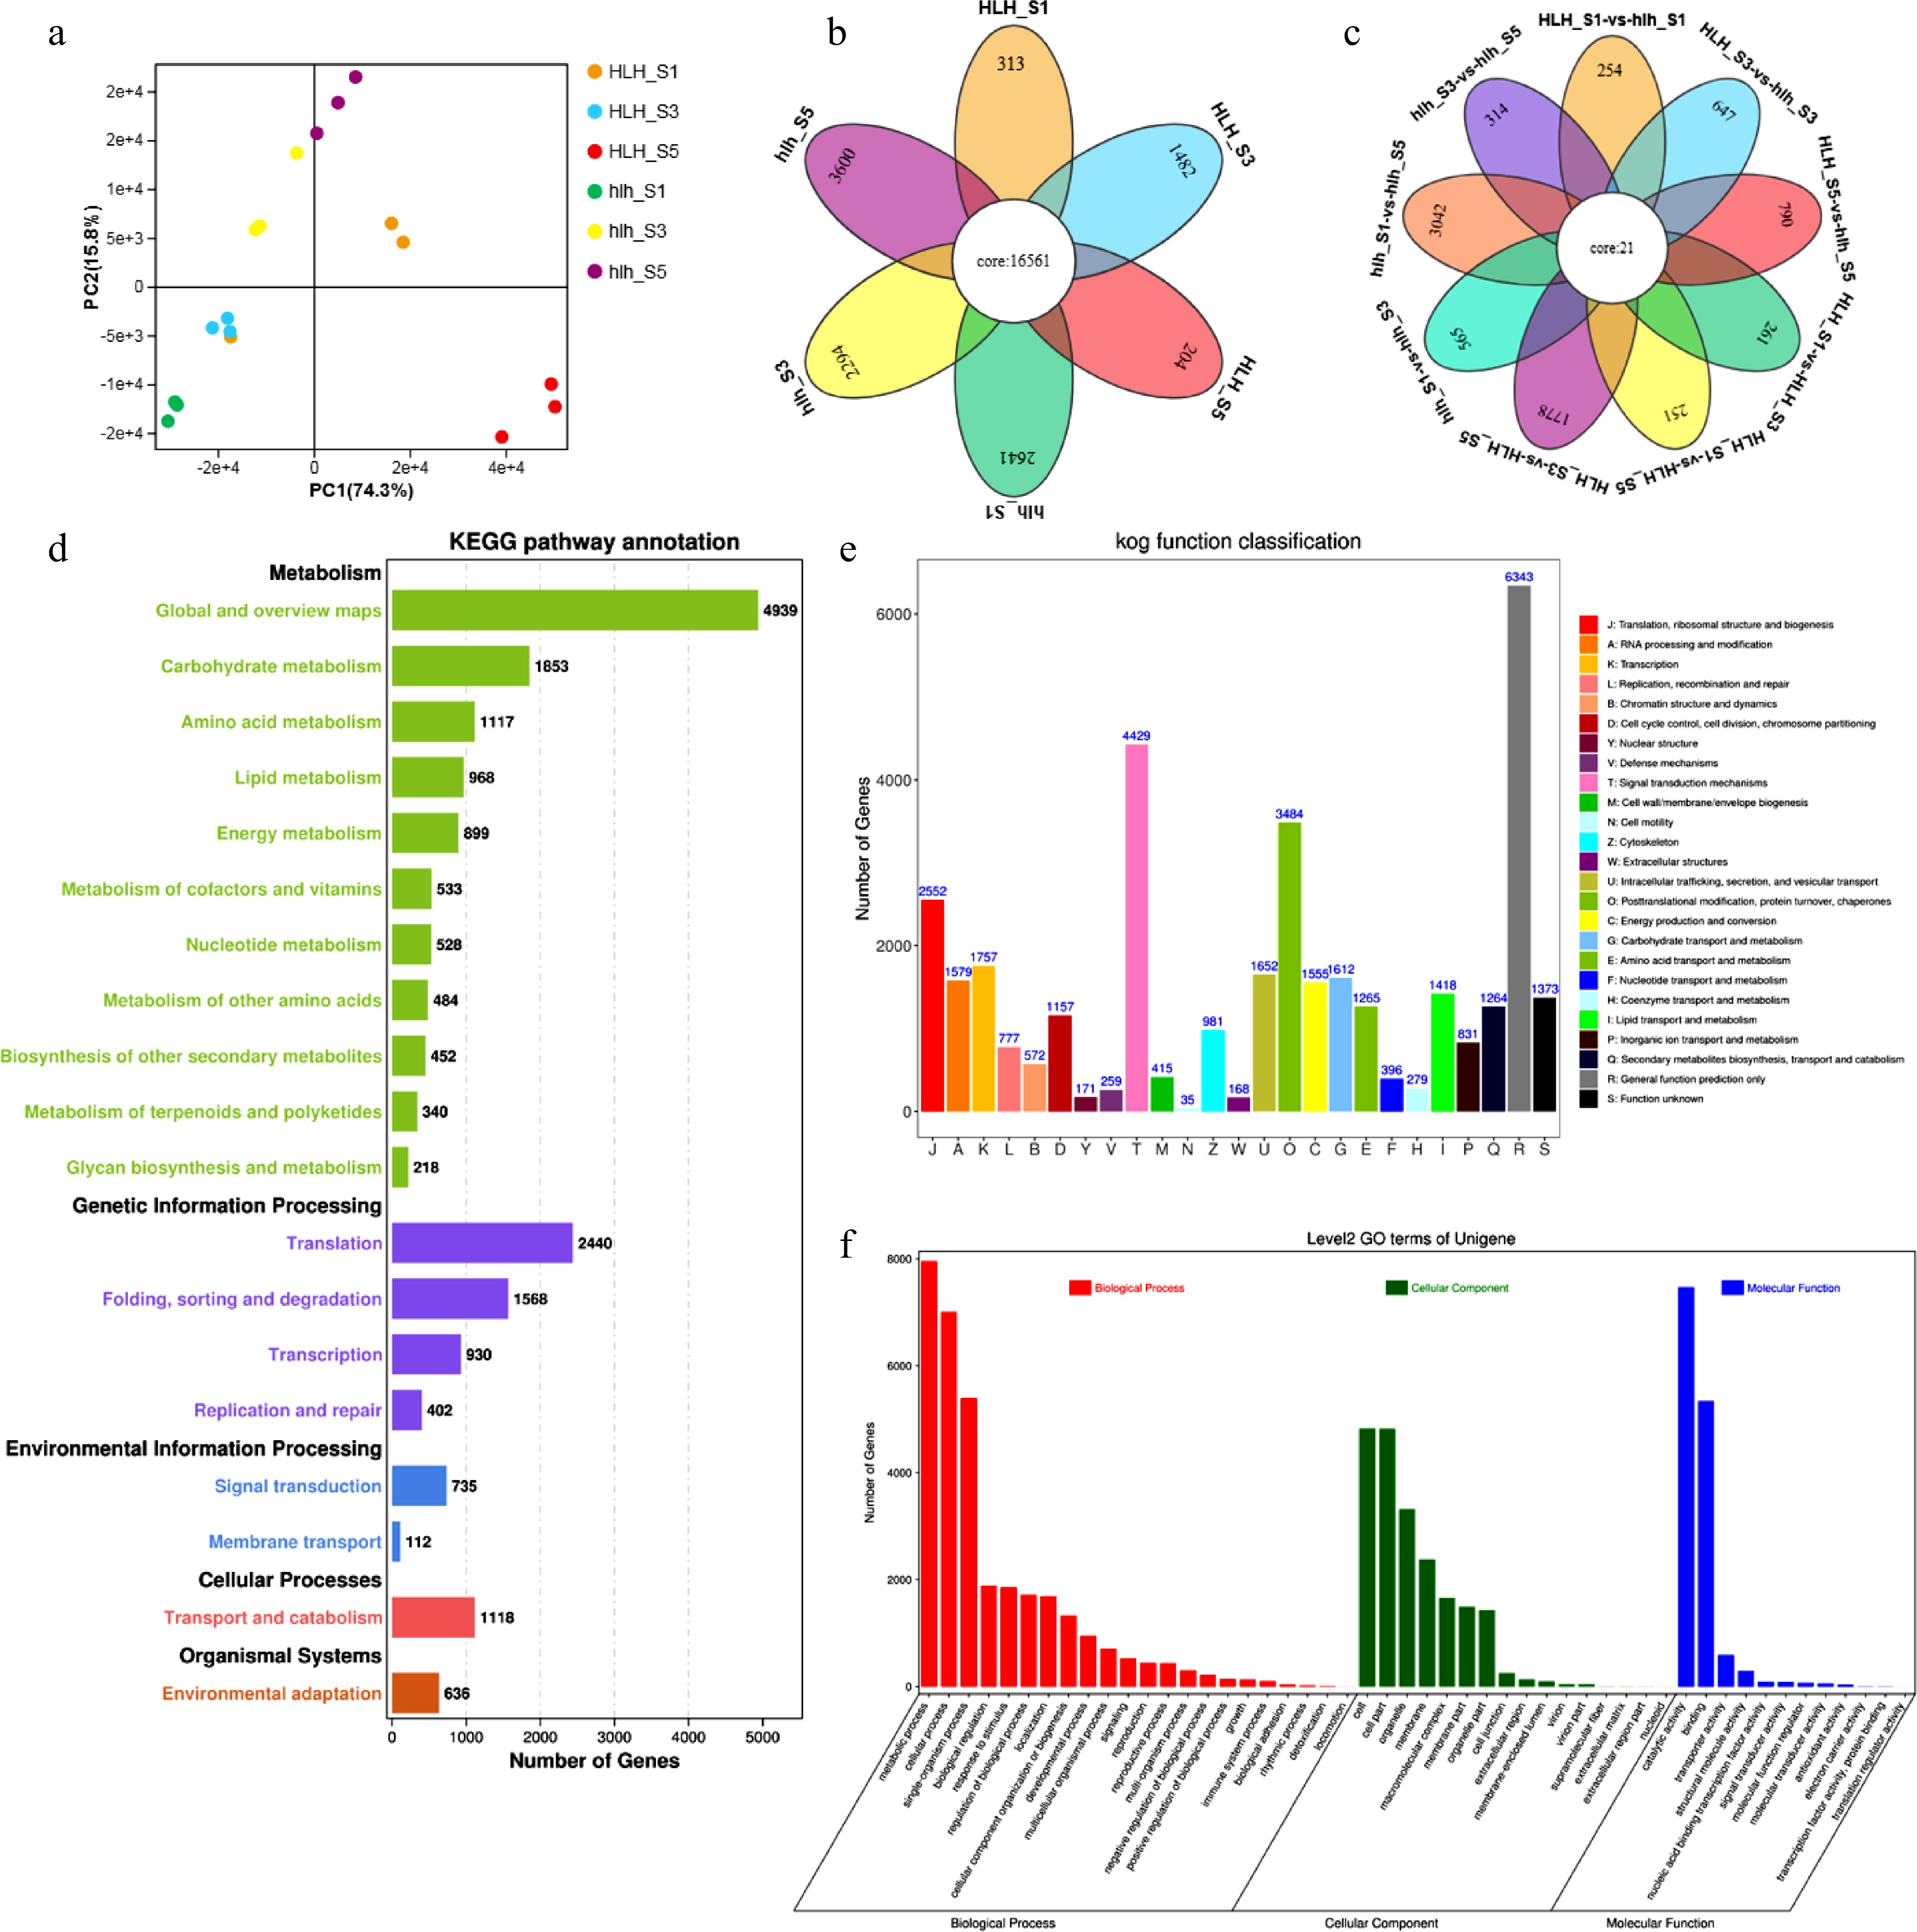
Figure 3.
Transcriptomic features for HLH and hlh, (a) principal component analysis; (b) Venn diagram for stage specificity of DEGs for FD stages 1, 3, and 5; (c) Venn diagram for multiple comparisons among different stages of flower development between HLH and hlh; (d) KEGG pathway annotation for HLH and hlh; (e) KOG/COG functional annotation for mutant and original cultivars; (f) biological process enrichment of DEGs.
-
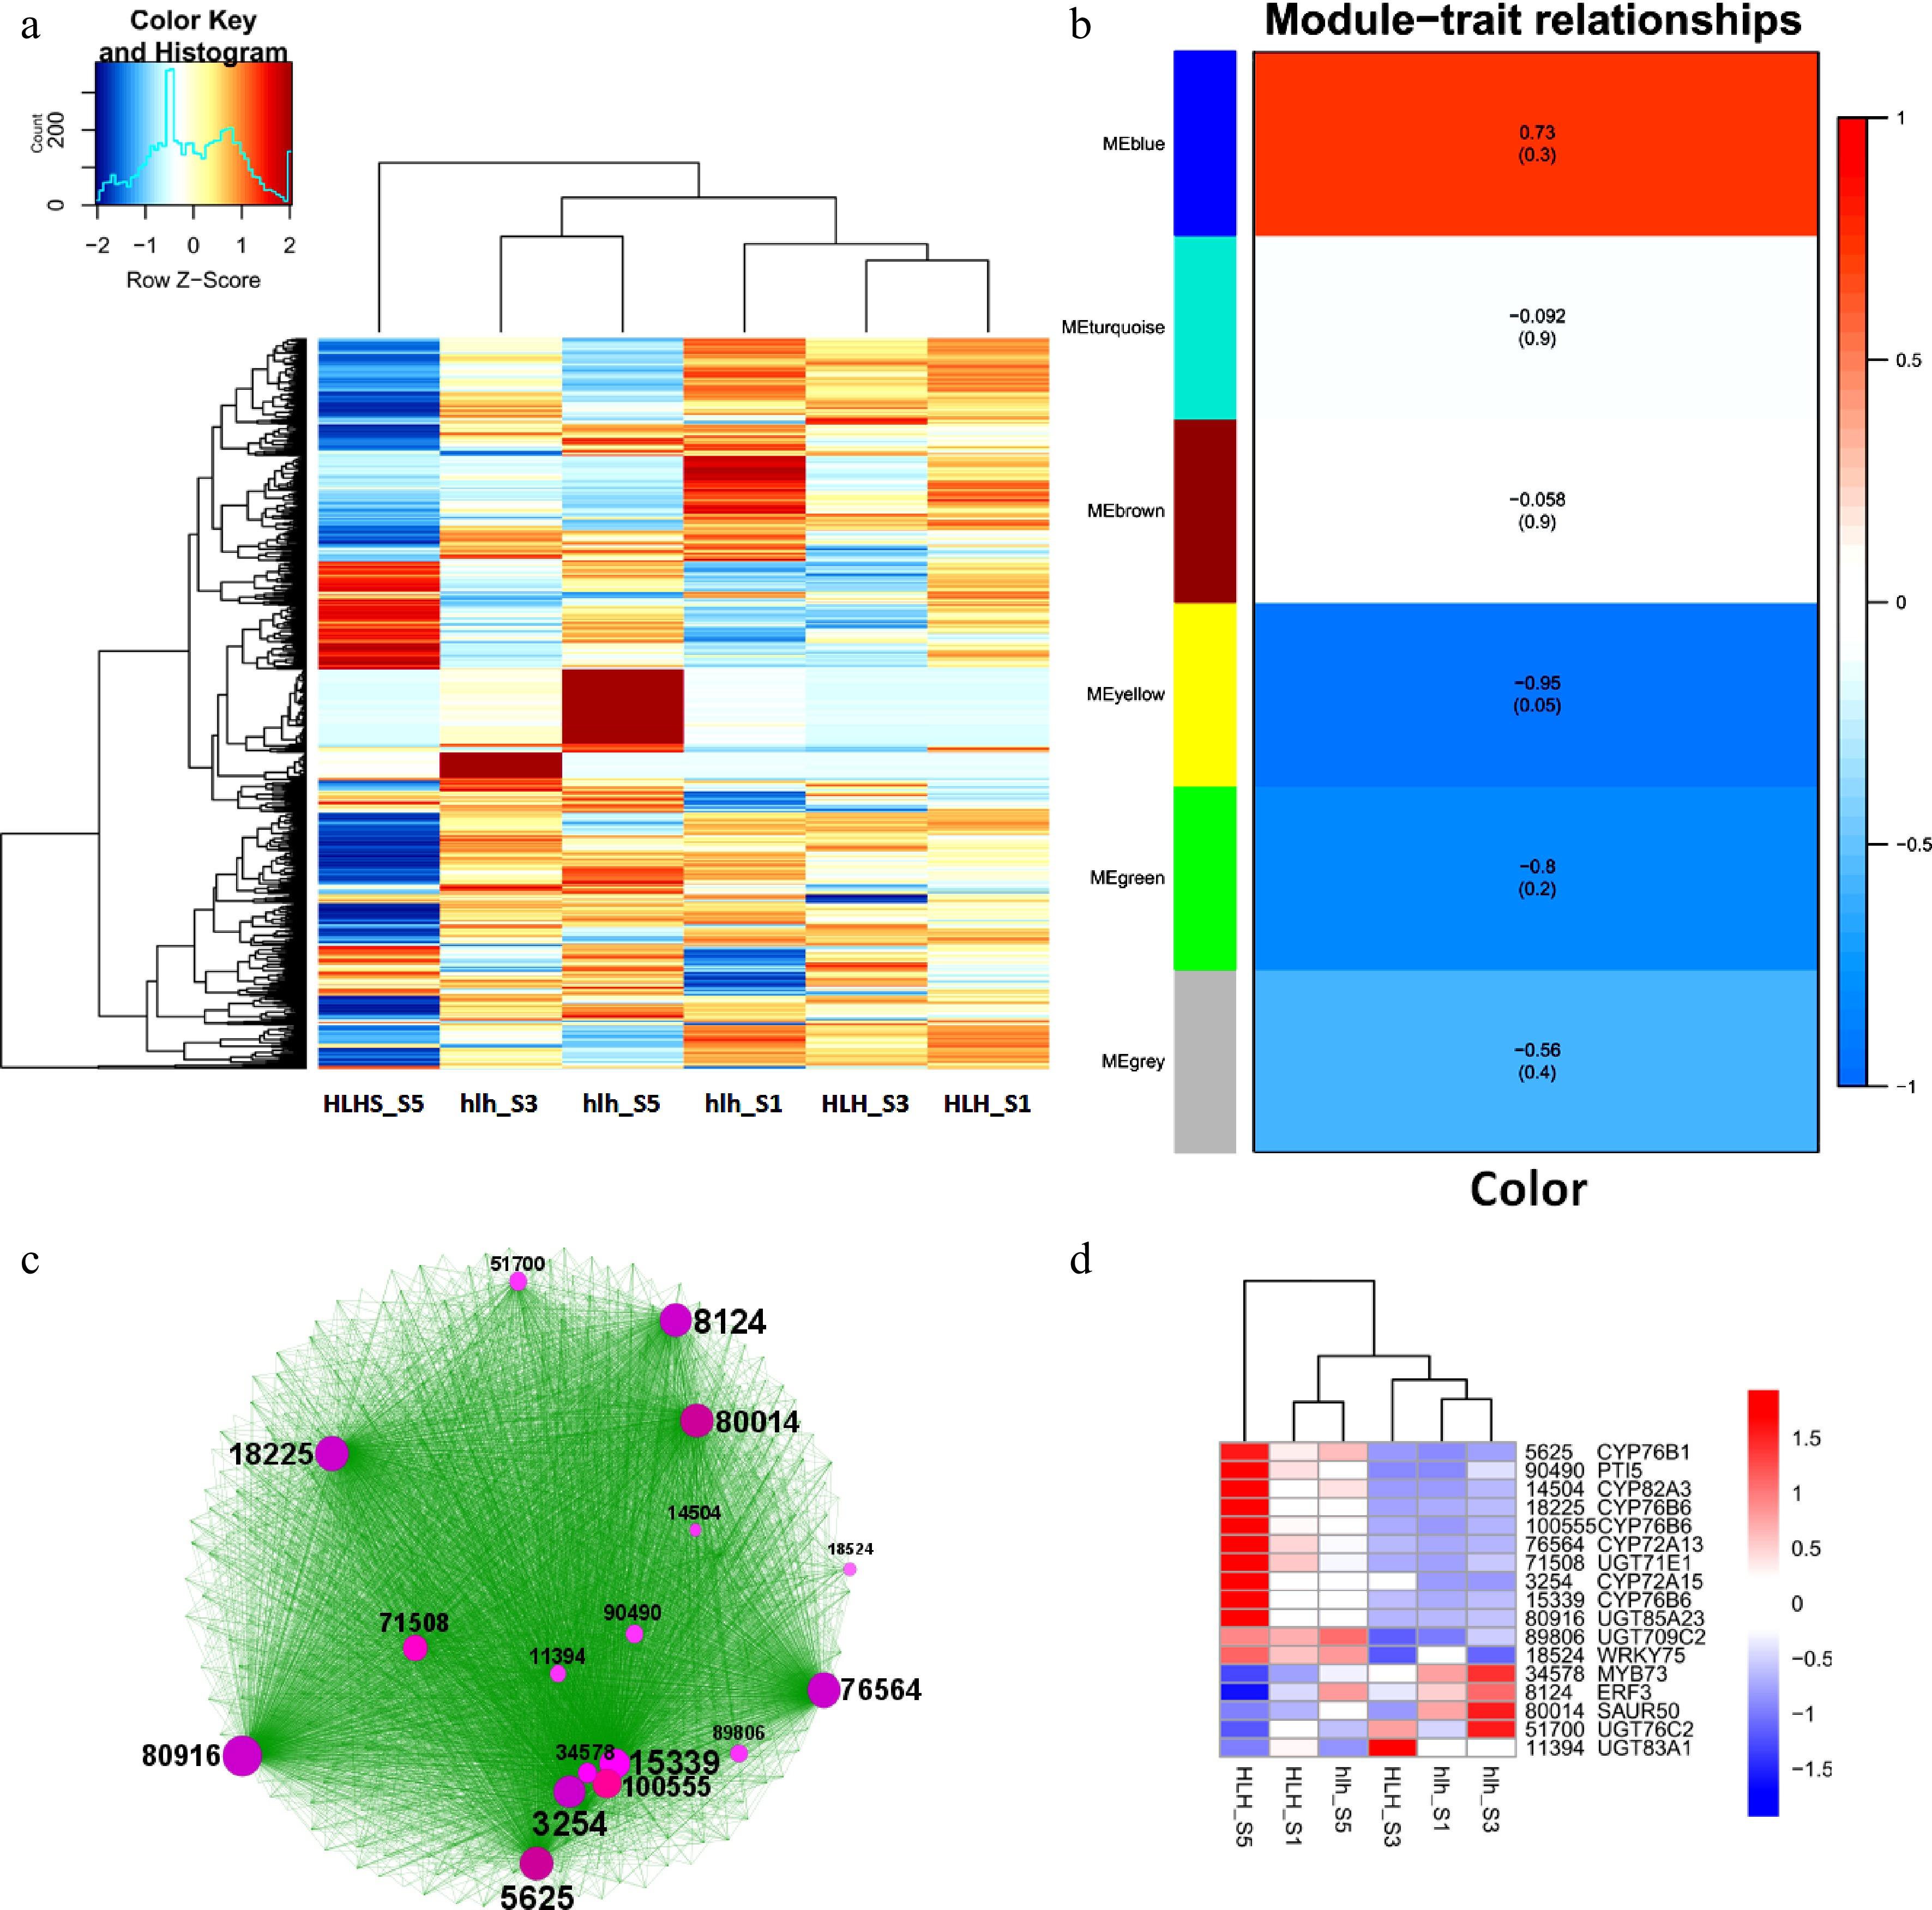
Figure 4.
Top 1,000 highly expressed DEGs, (a) heatmap of top 1,000 highly expressed DEGs; (b) WGCAN modules of highly expressed DEGs; (c) clustering analysis of WGCNA-based coexpressed modules and identification of hub genes (circle size shows the gene interaction intensity of hub genes); (d) heatmap of FPKM expression of hub genes.
-
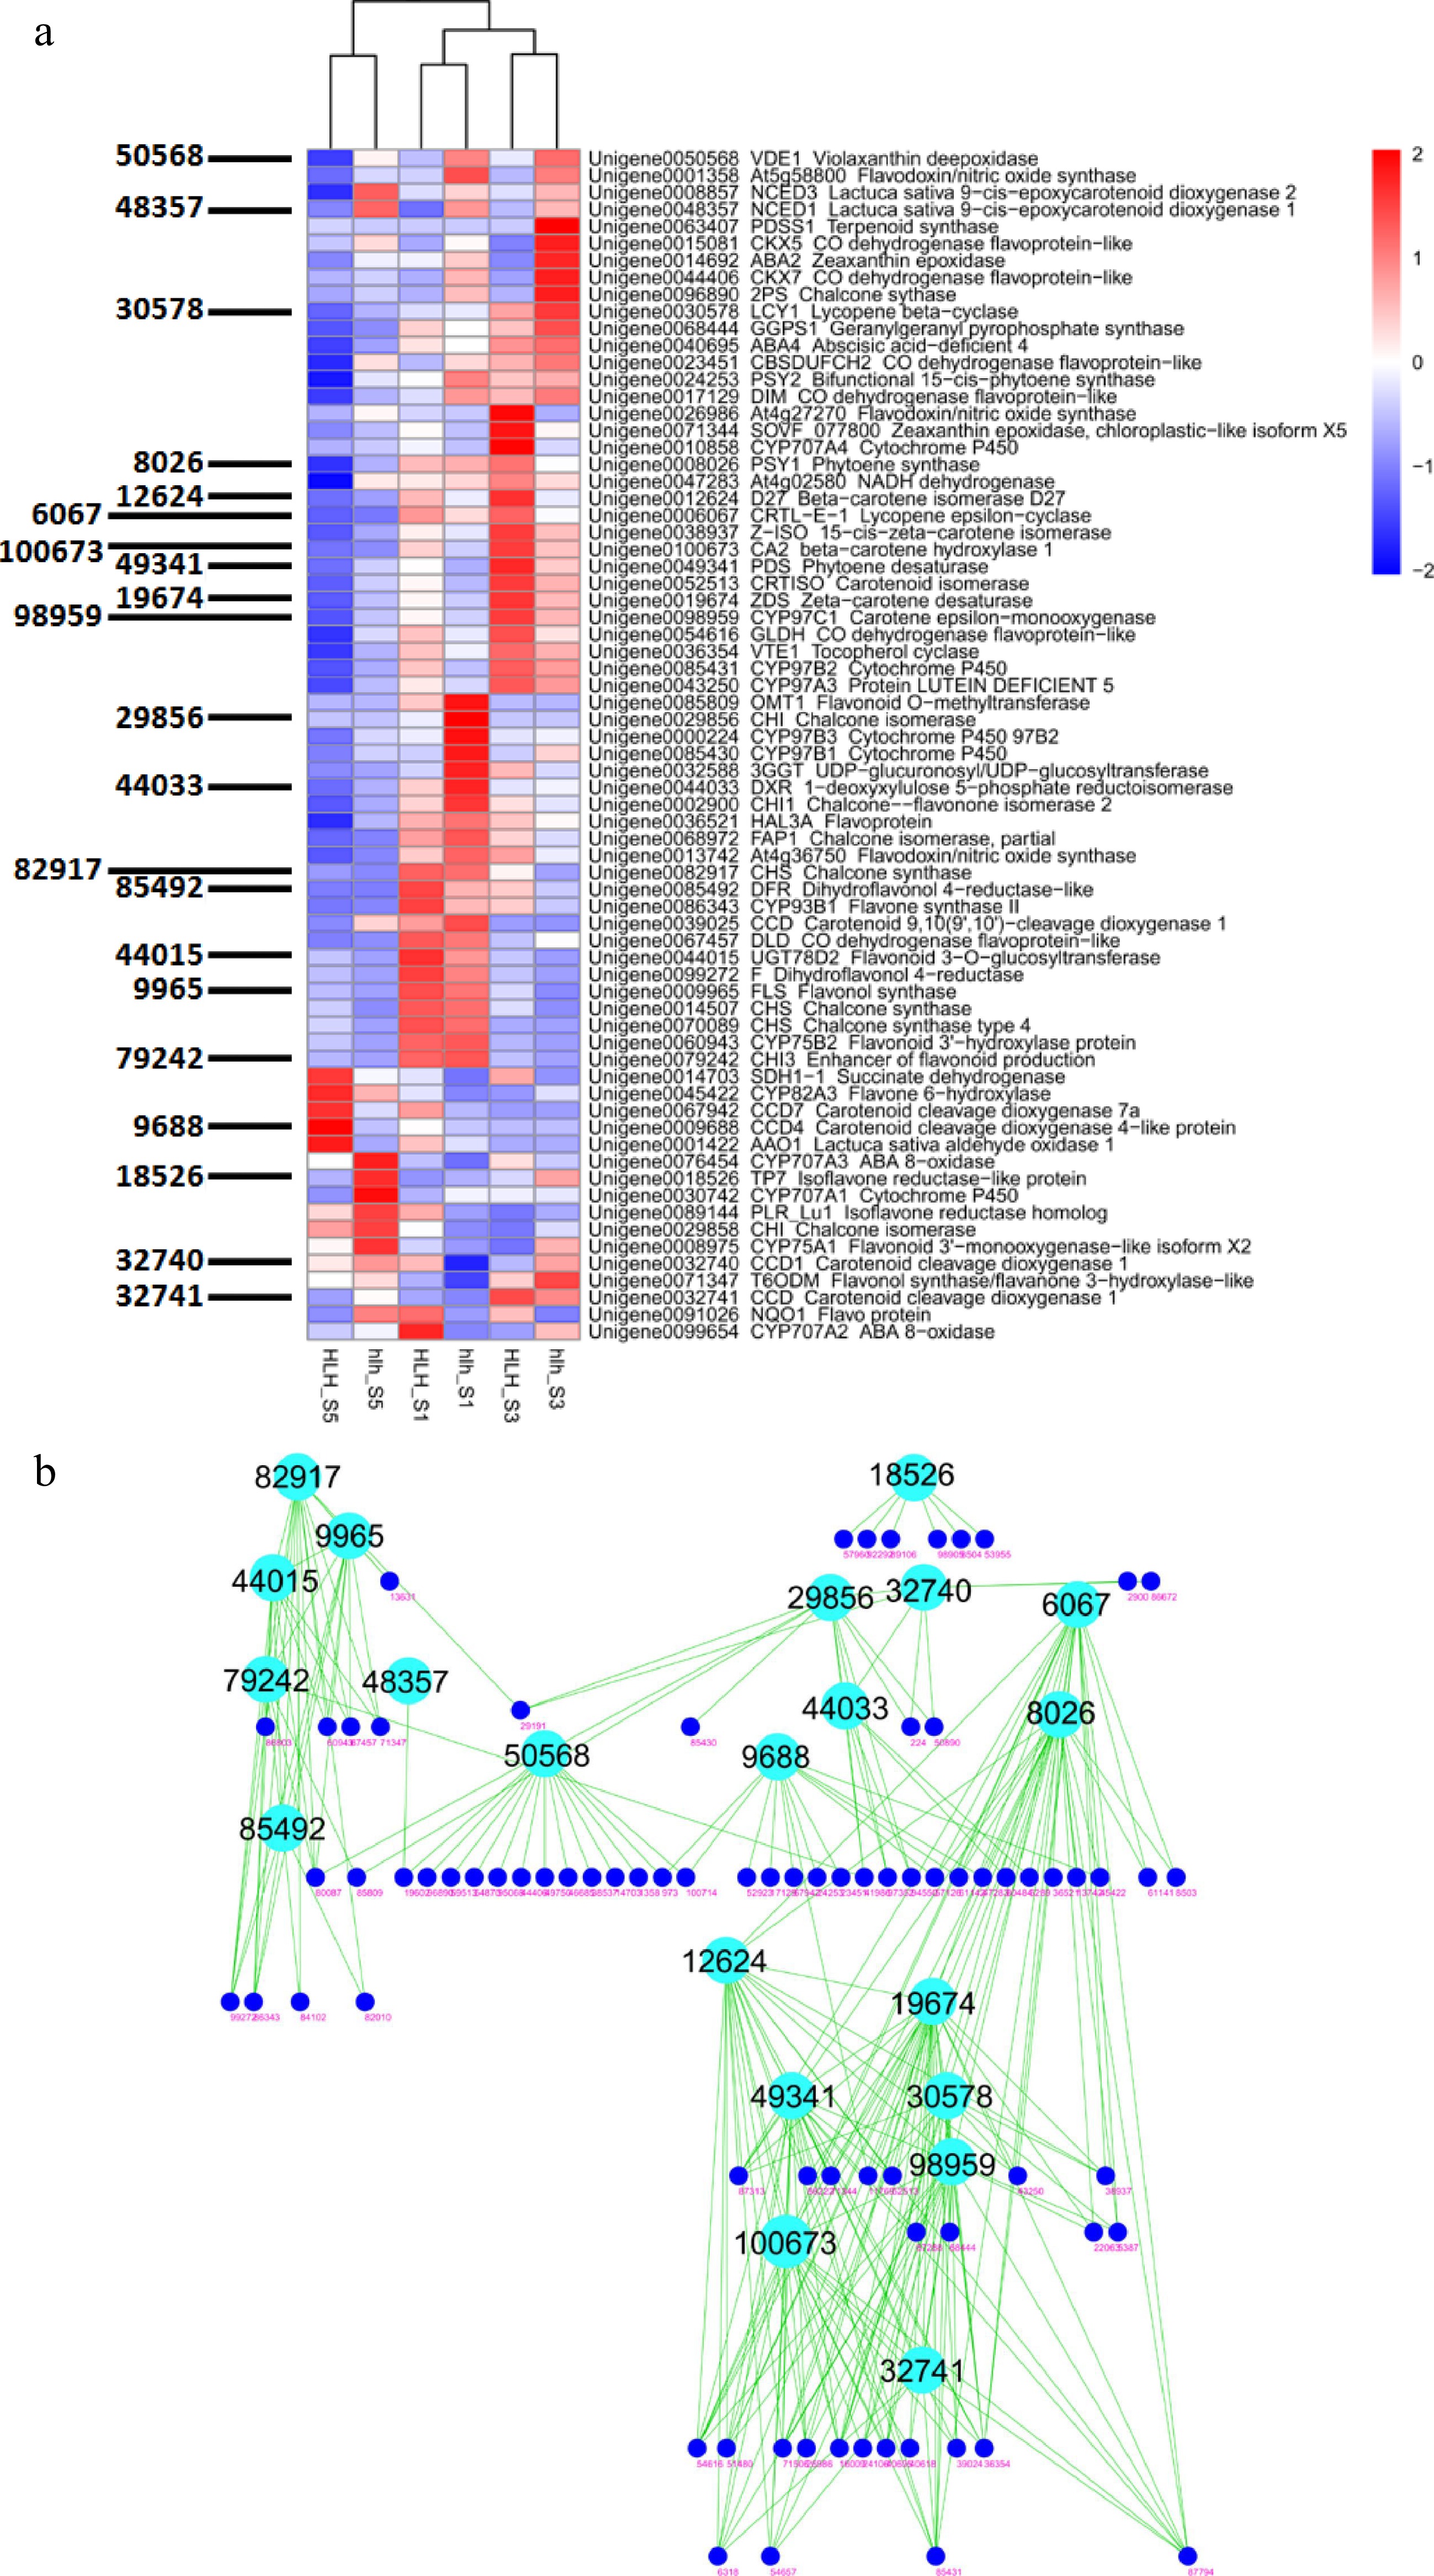
Figure 5.
(a) Heatmap of all important DEGs related to biosynthetic pathways of carotenoids, flavonoids, anthocyanins and other such compounds and WGCNA-based identification of hub genes (gene IDs shown on left side); (b) clustering analysis of coexpressed modules and identification of candidate genes for chemical homeostasis.
-
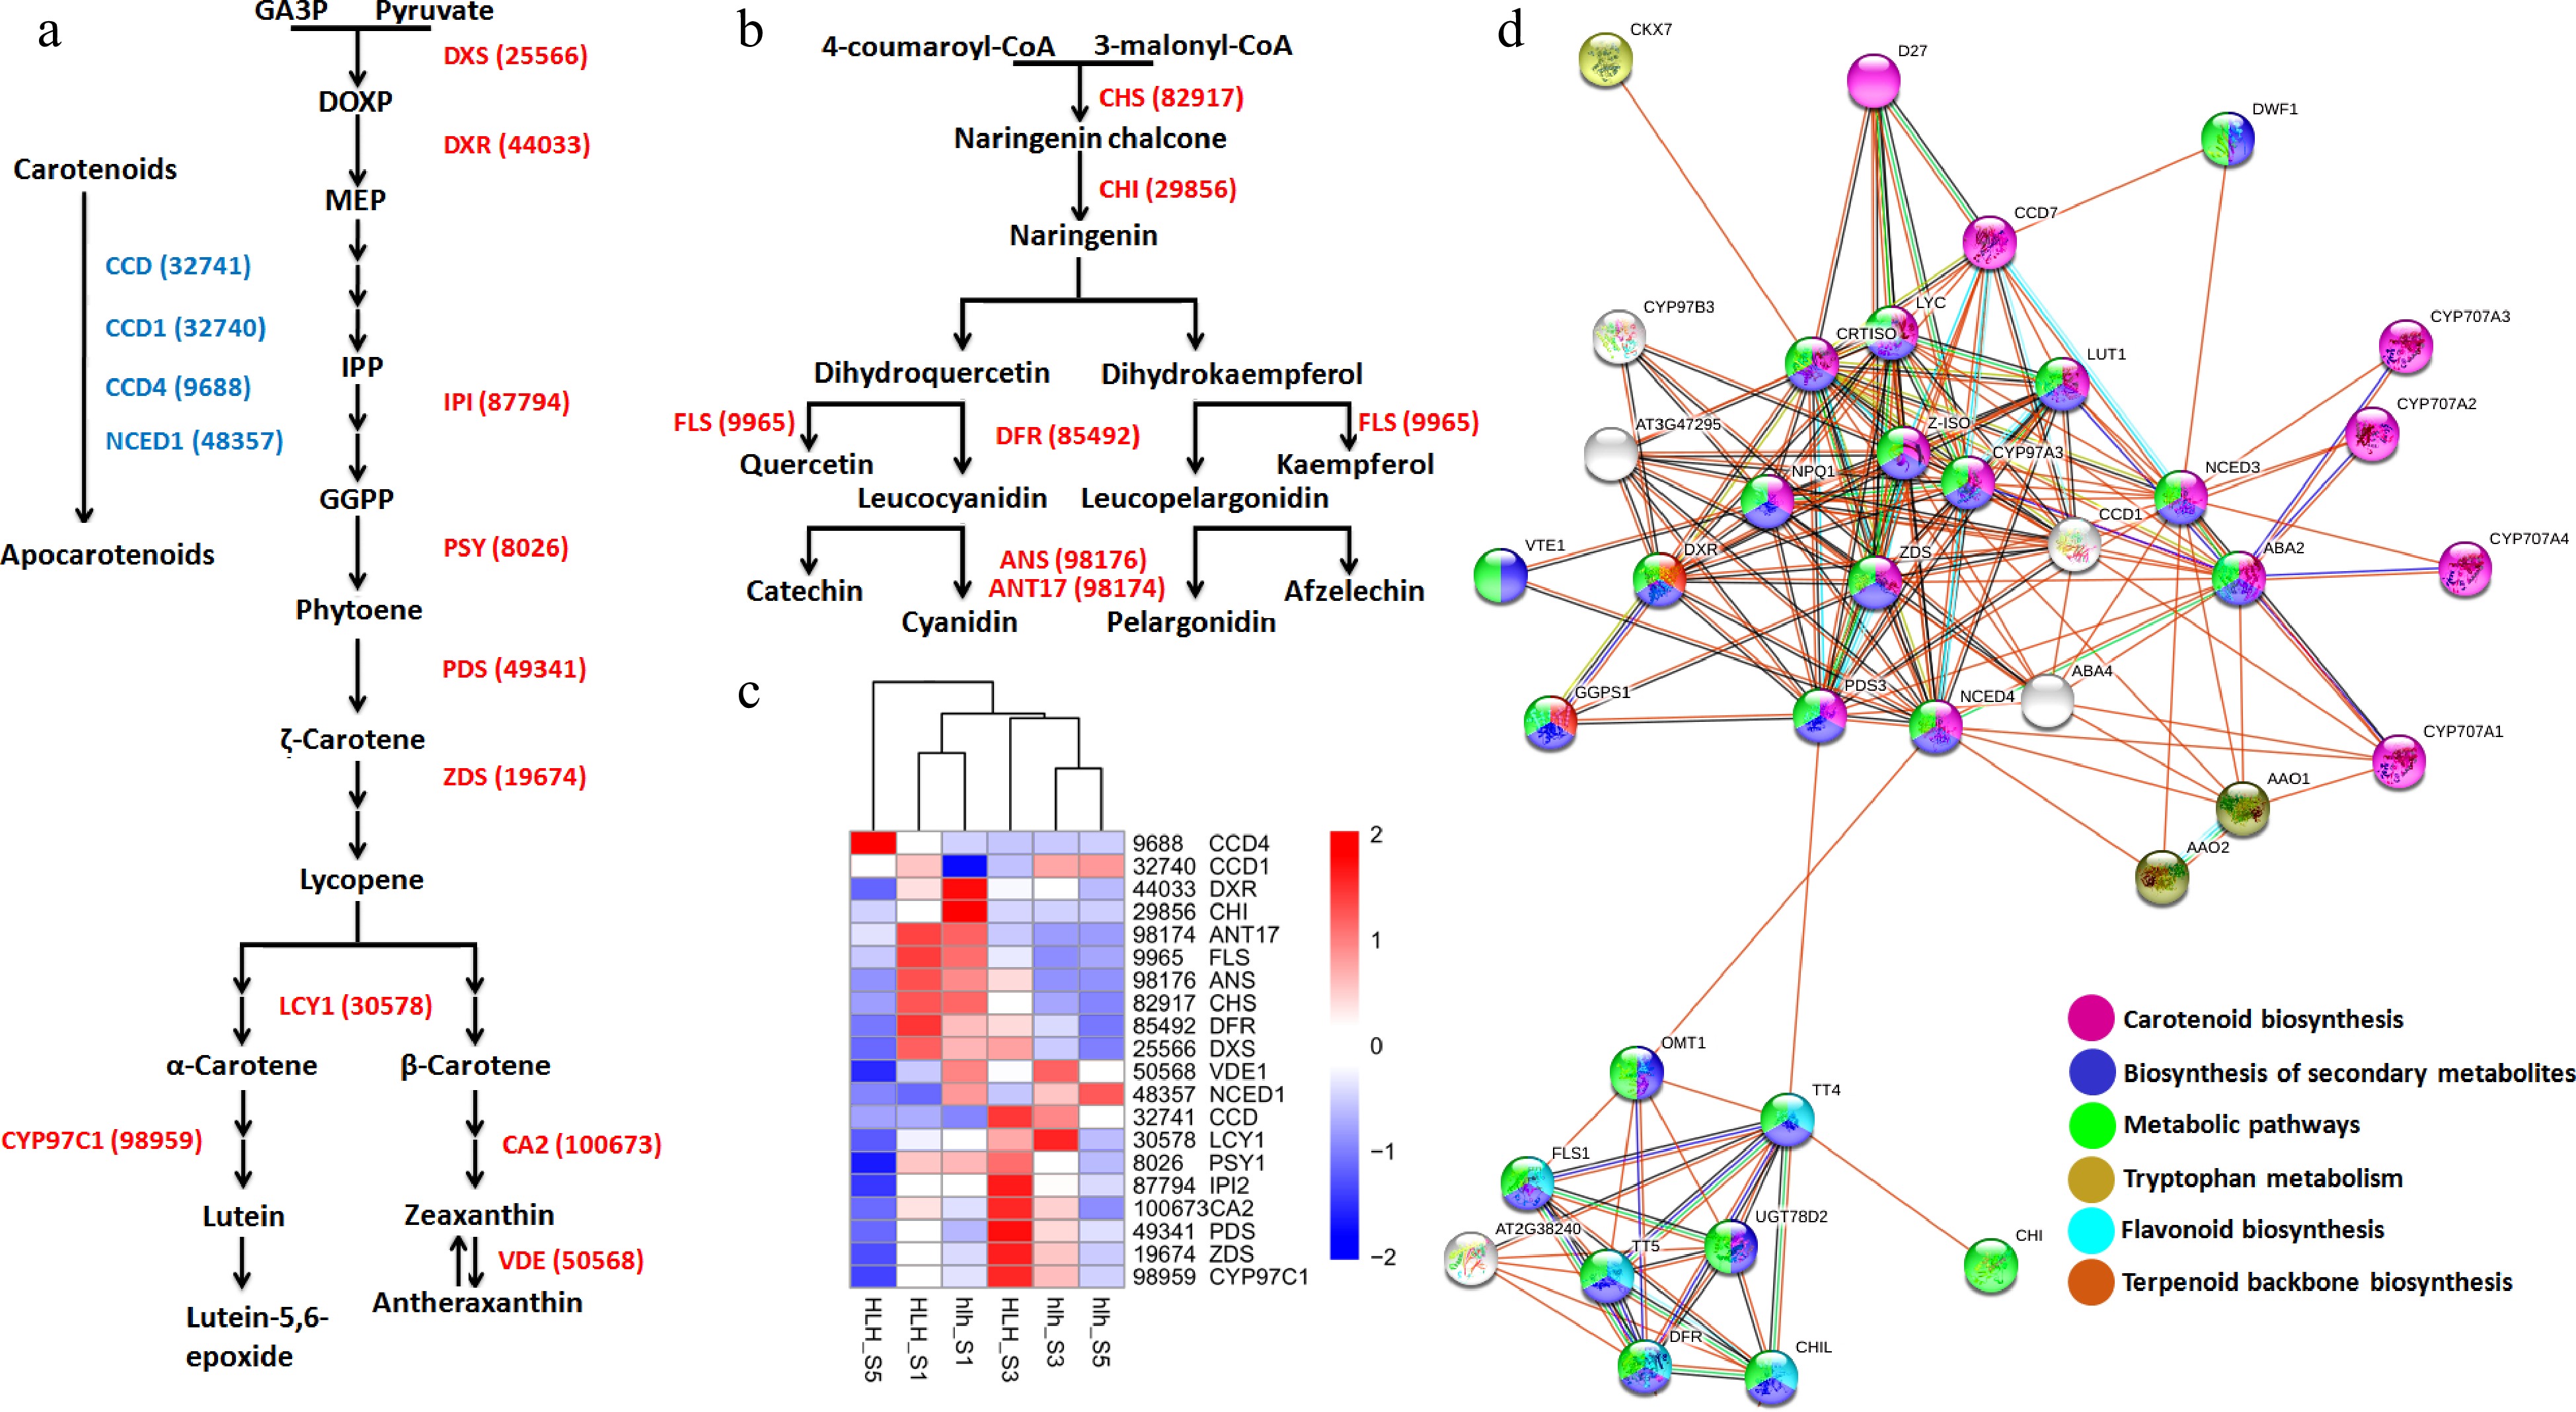
Figure 6.
(a) Carotenoid biosynthesis pathway driven by different enzymes (red color) and carotenoid degradation pathway driven by different enzymes (blue color); (b) anthocyanin biosynthesis pathway driven by different enzymes (red); (c) heatmap of all the genes involved in the carotenoid and anthocyanin pathways; (d) protein-protein interaction of carotenoid and anthocyanin related genes.
-
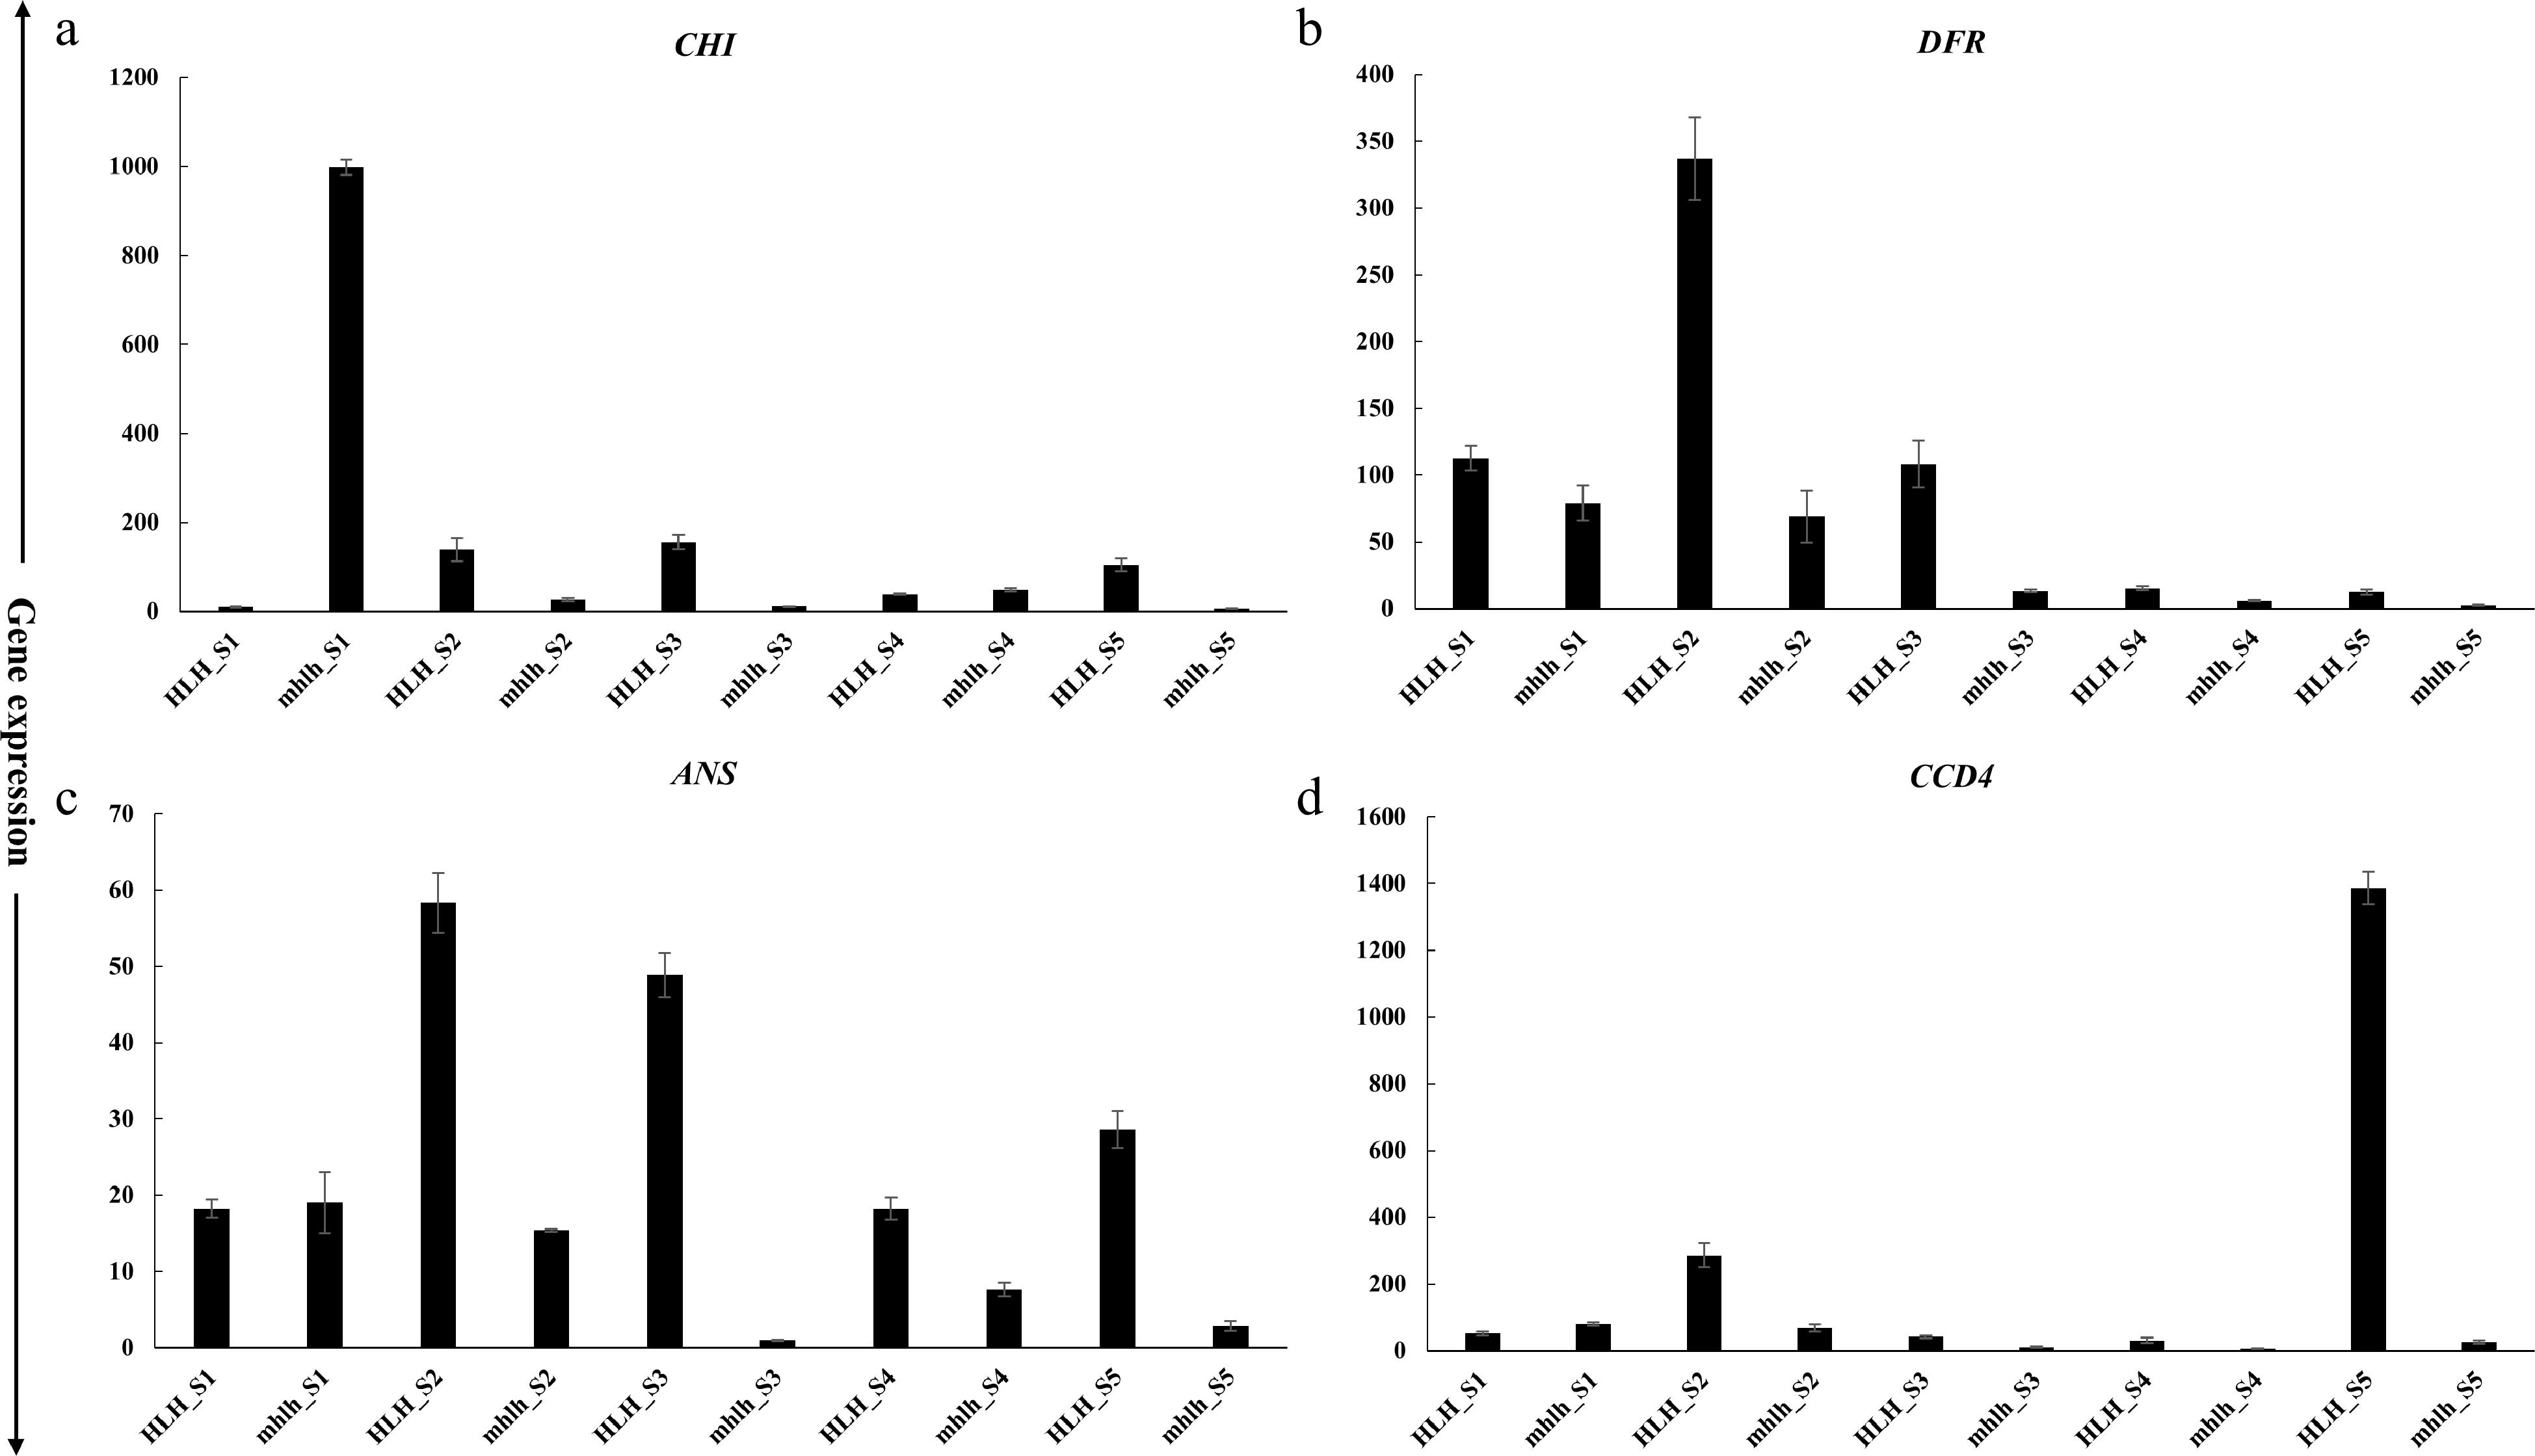
Figure 7.
qRT-PCR expression of candidate genes at five petal development stages for HLH and hlh. (a)−(c) represent anthocyanins pathway genes; (d) represents carotenoid degradation pathway related gene.
-
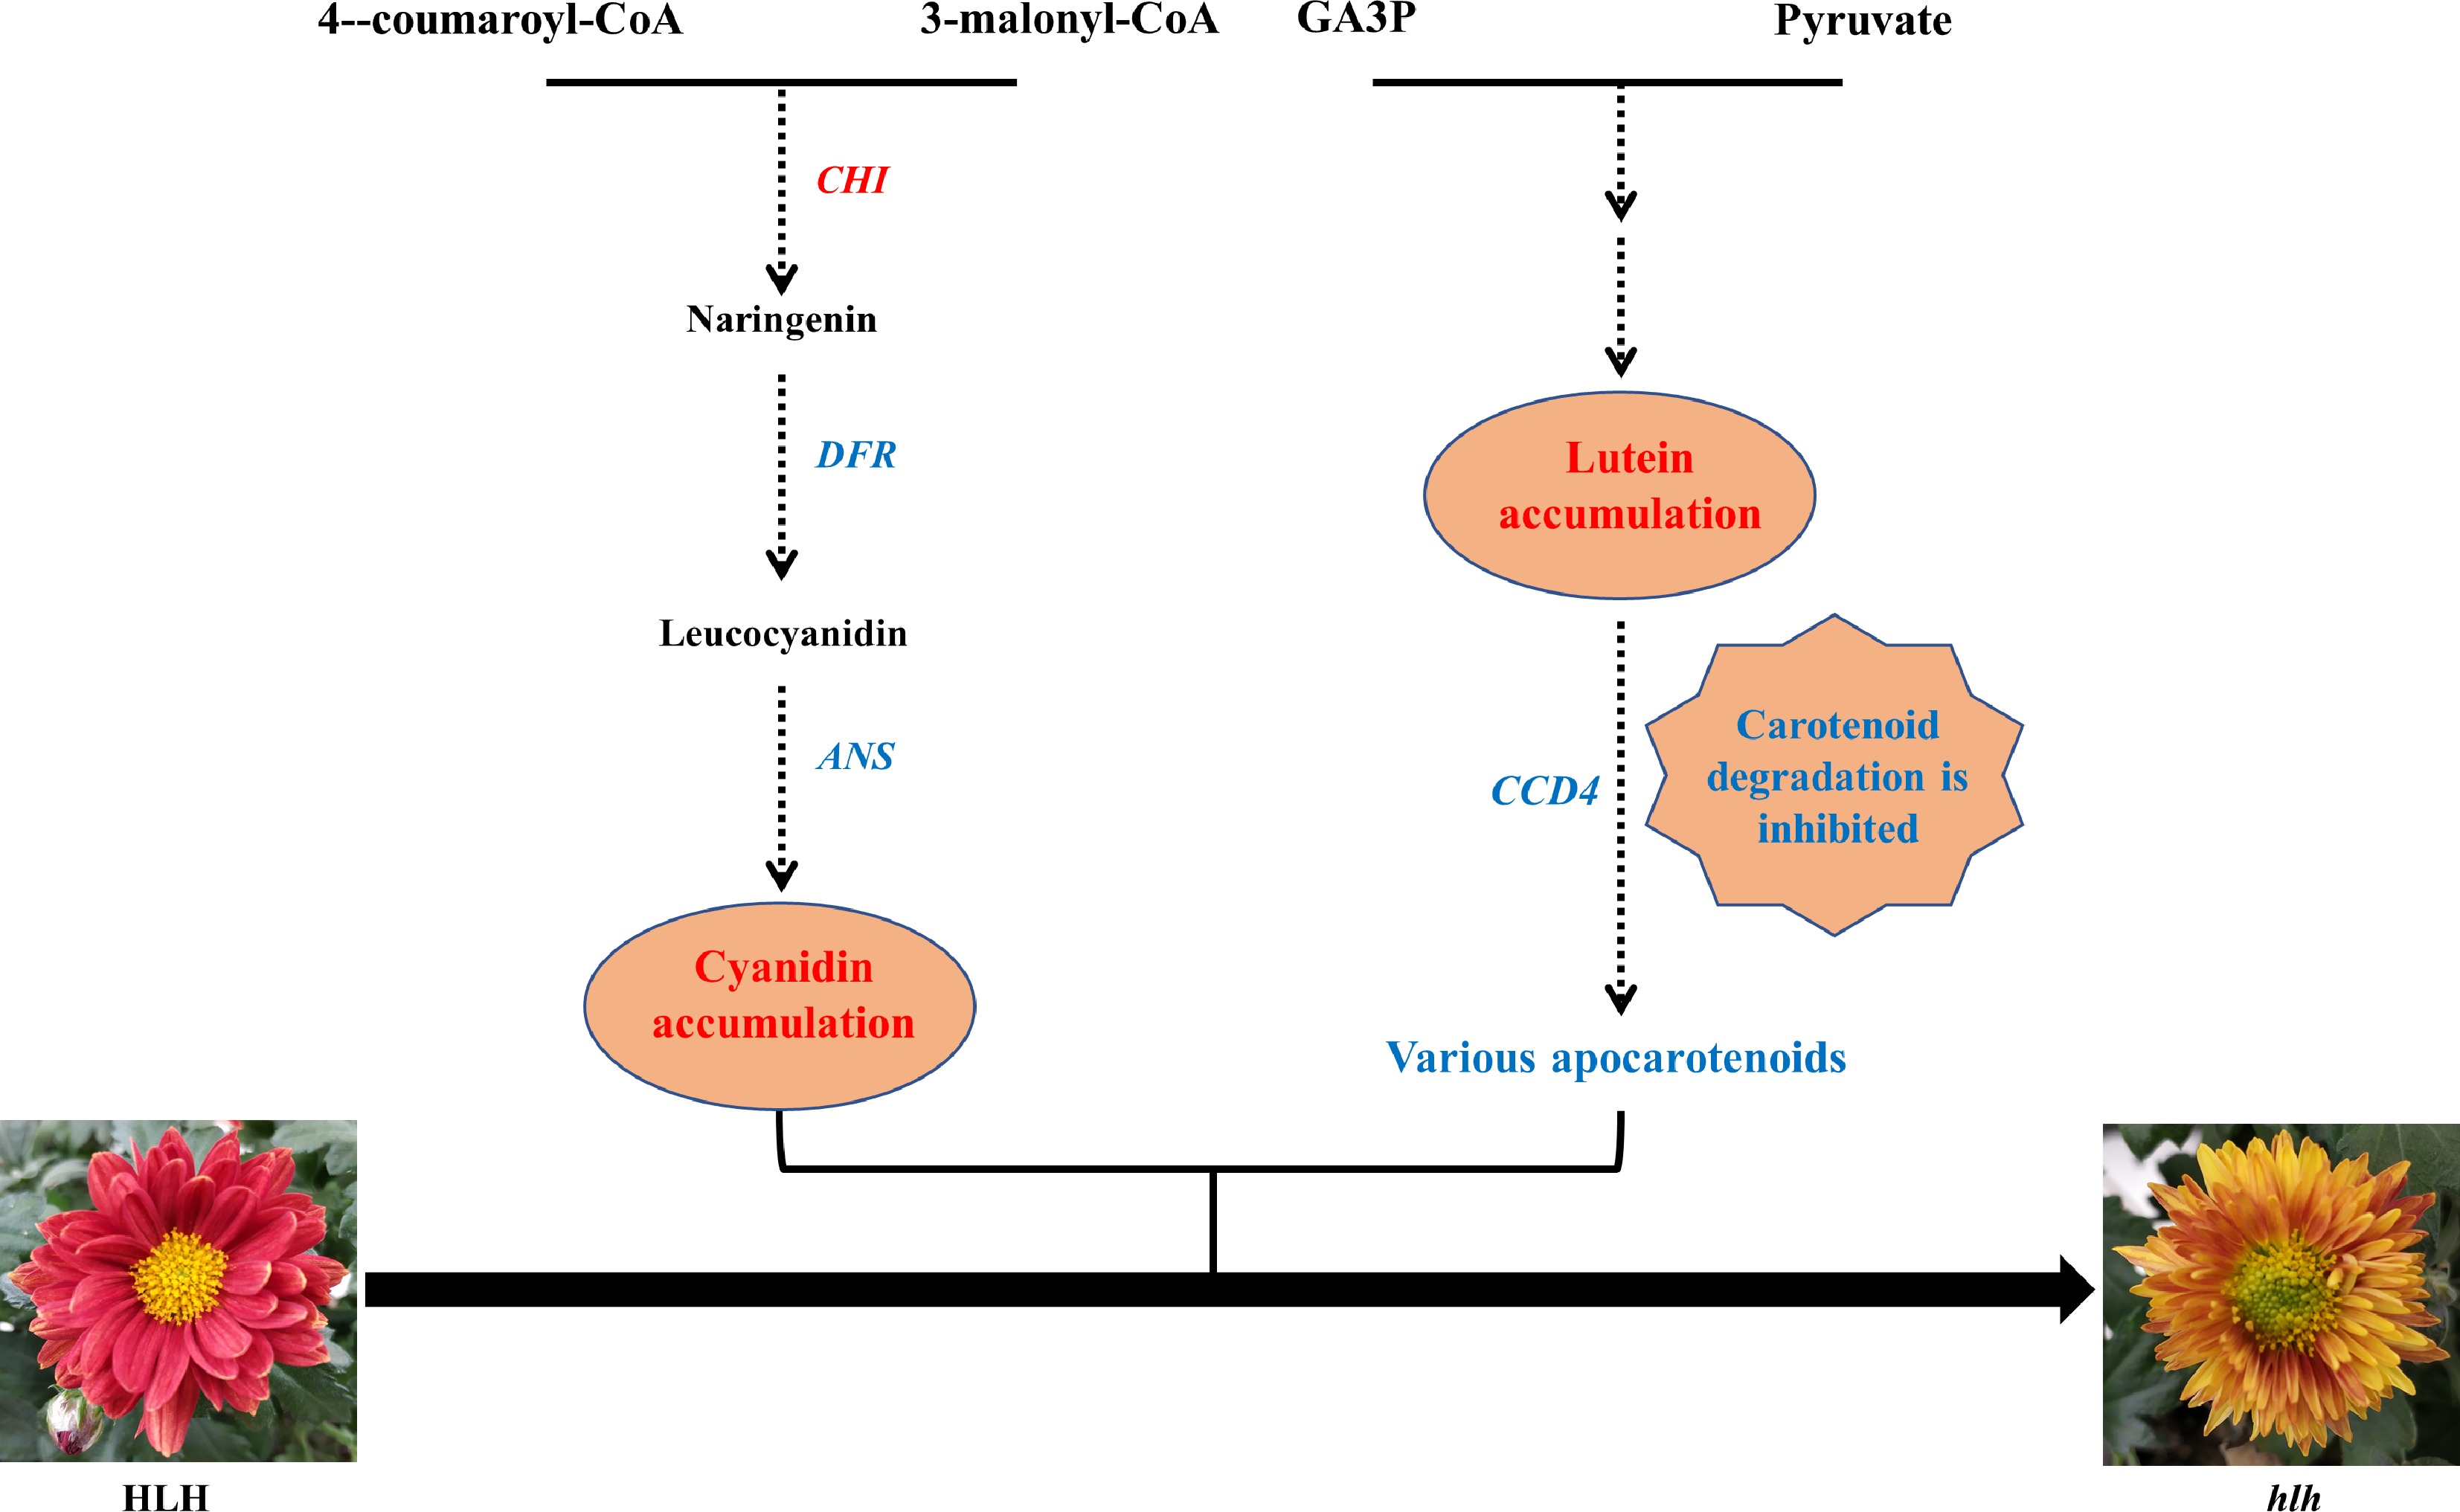
Figure 8.
A putative model of the flower color change in hlh. Genes in the pathway are candidate hub genes. The increased pigment content and up-regulated gene in the mutant (hlh) was marked in red, while the decreased and down-regulated was marked in blue, as compared with the original parent (HLH).
Figures
(8)
Tables
(0)