-
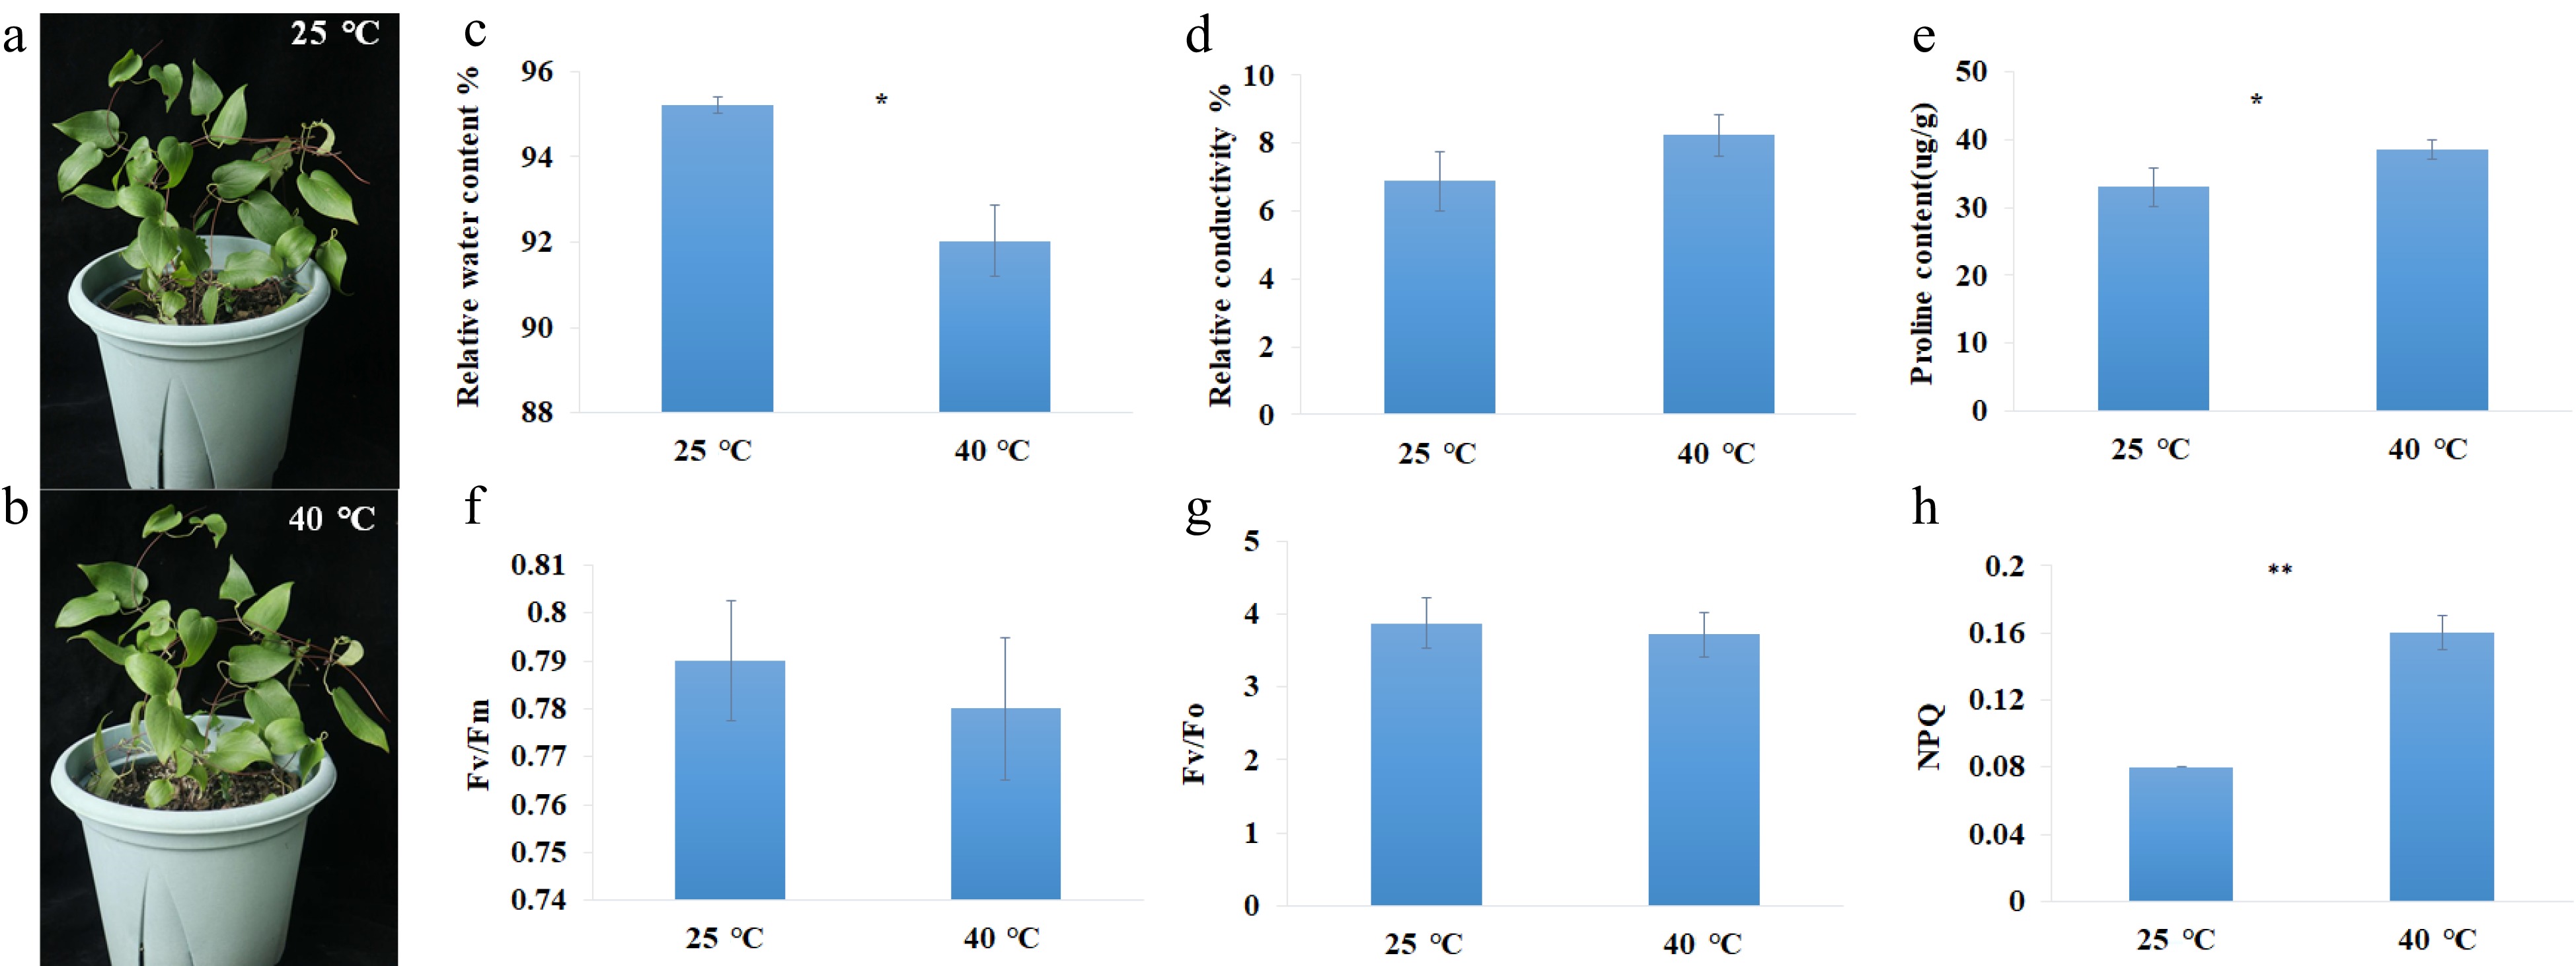
Figure 1.
Photographs and physiological parameters of C. lanuginosa under heat-shock conditions. (a), (b) Photographs of C. lanuginosa under 25 °C and 40 °C. (c) Relative water content %. (d) Relative conductivity %. (e) Proline content(ug/g). (f) Fv/Fm. (g) Fv/Fo. (h) NPQ.
-
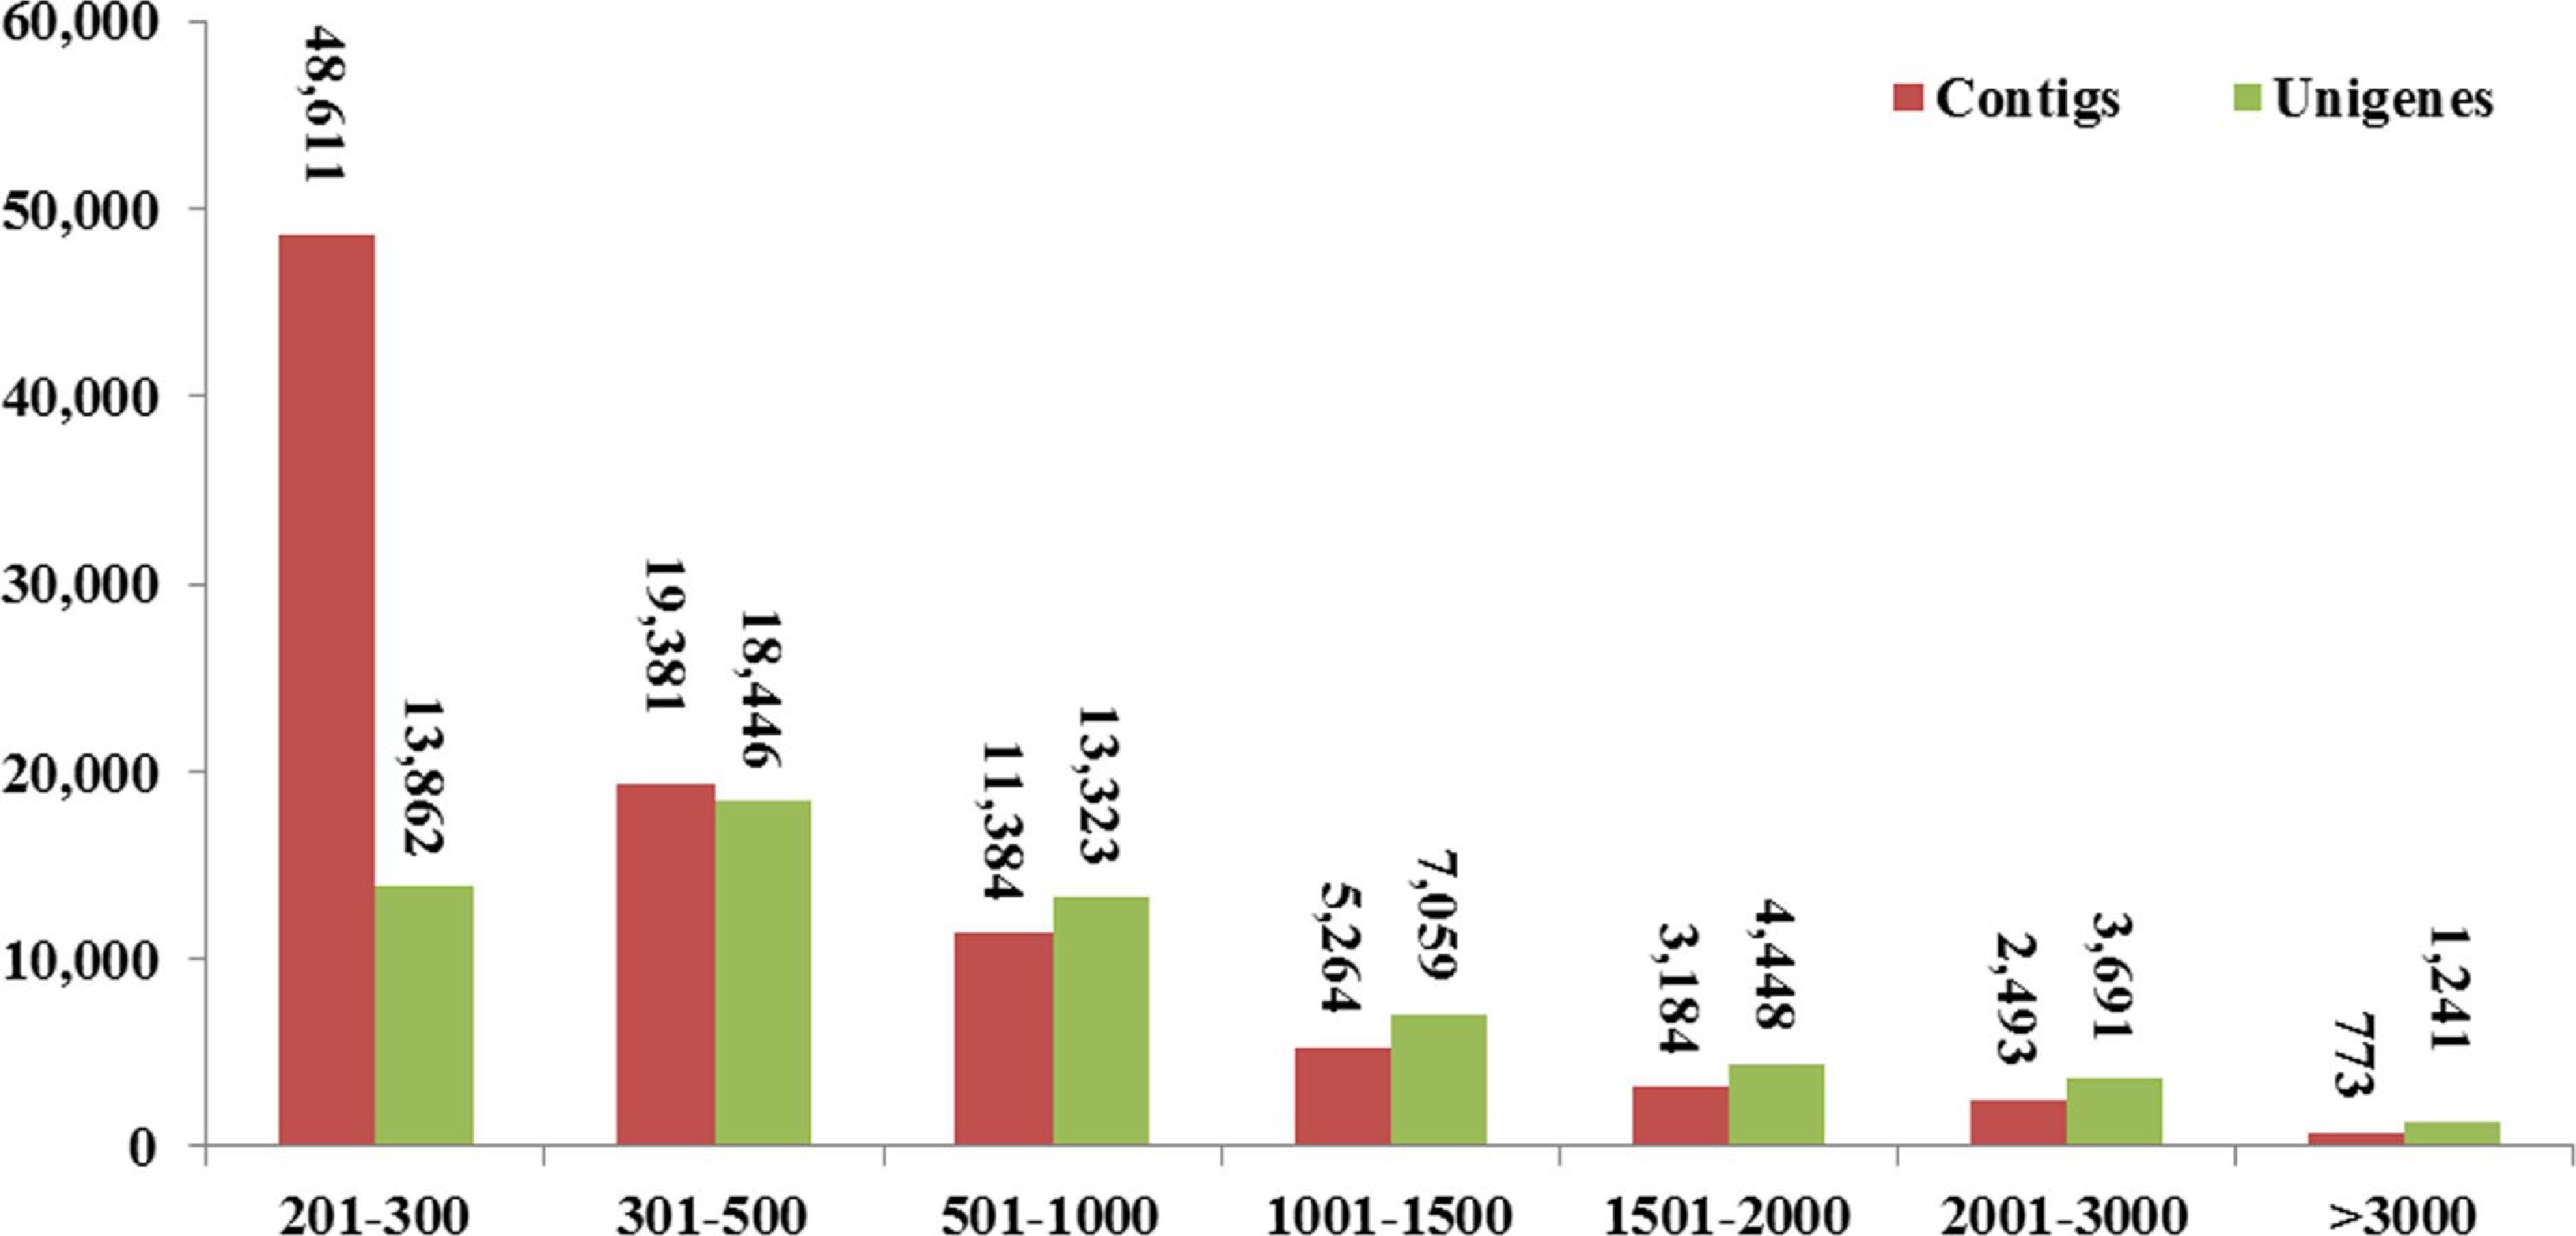
Figure 2.
Length distributions of contigs and unigenes in the transcriptome assembly.
-
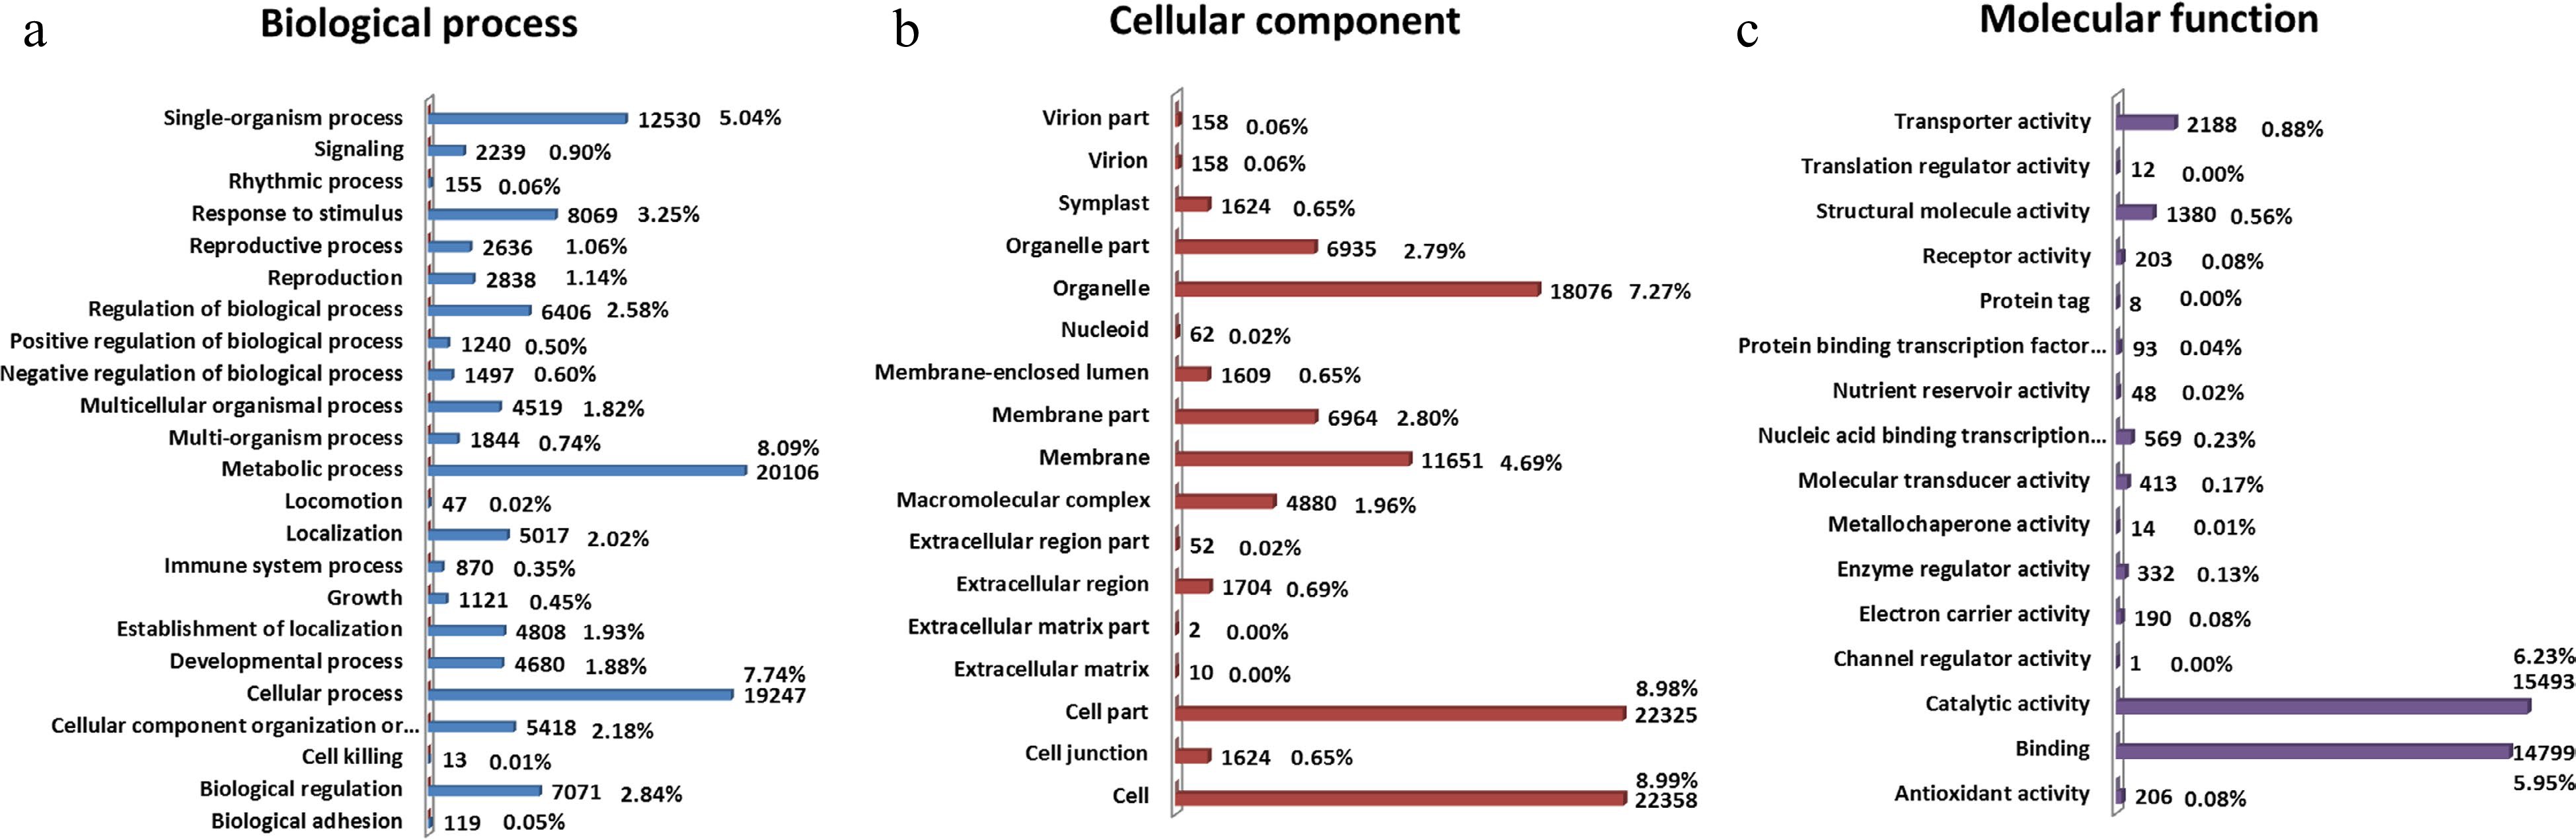
Figure 3.
GO classification analysis of unigenes in C. lanuginosa. The GO terms were summarized into three main categories: (a) biological process, (b) cellular component and (c) molecular function. The GO functions are shown on the left of the vertical axis, and the numbers and percentages of genes are shown on the right of the vertical axis.
-
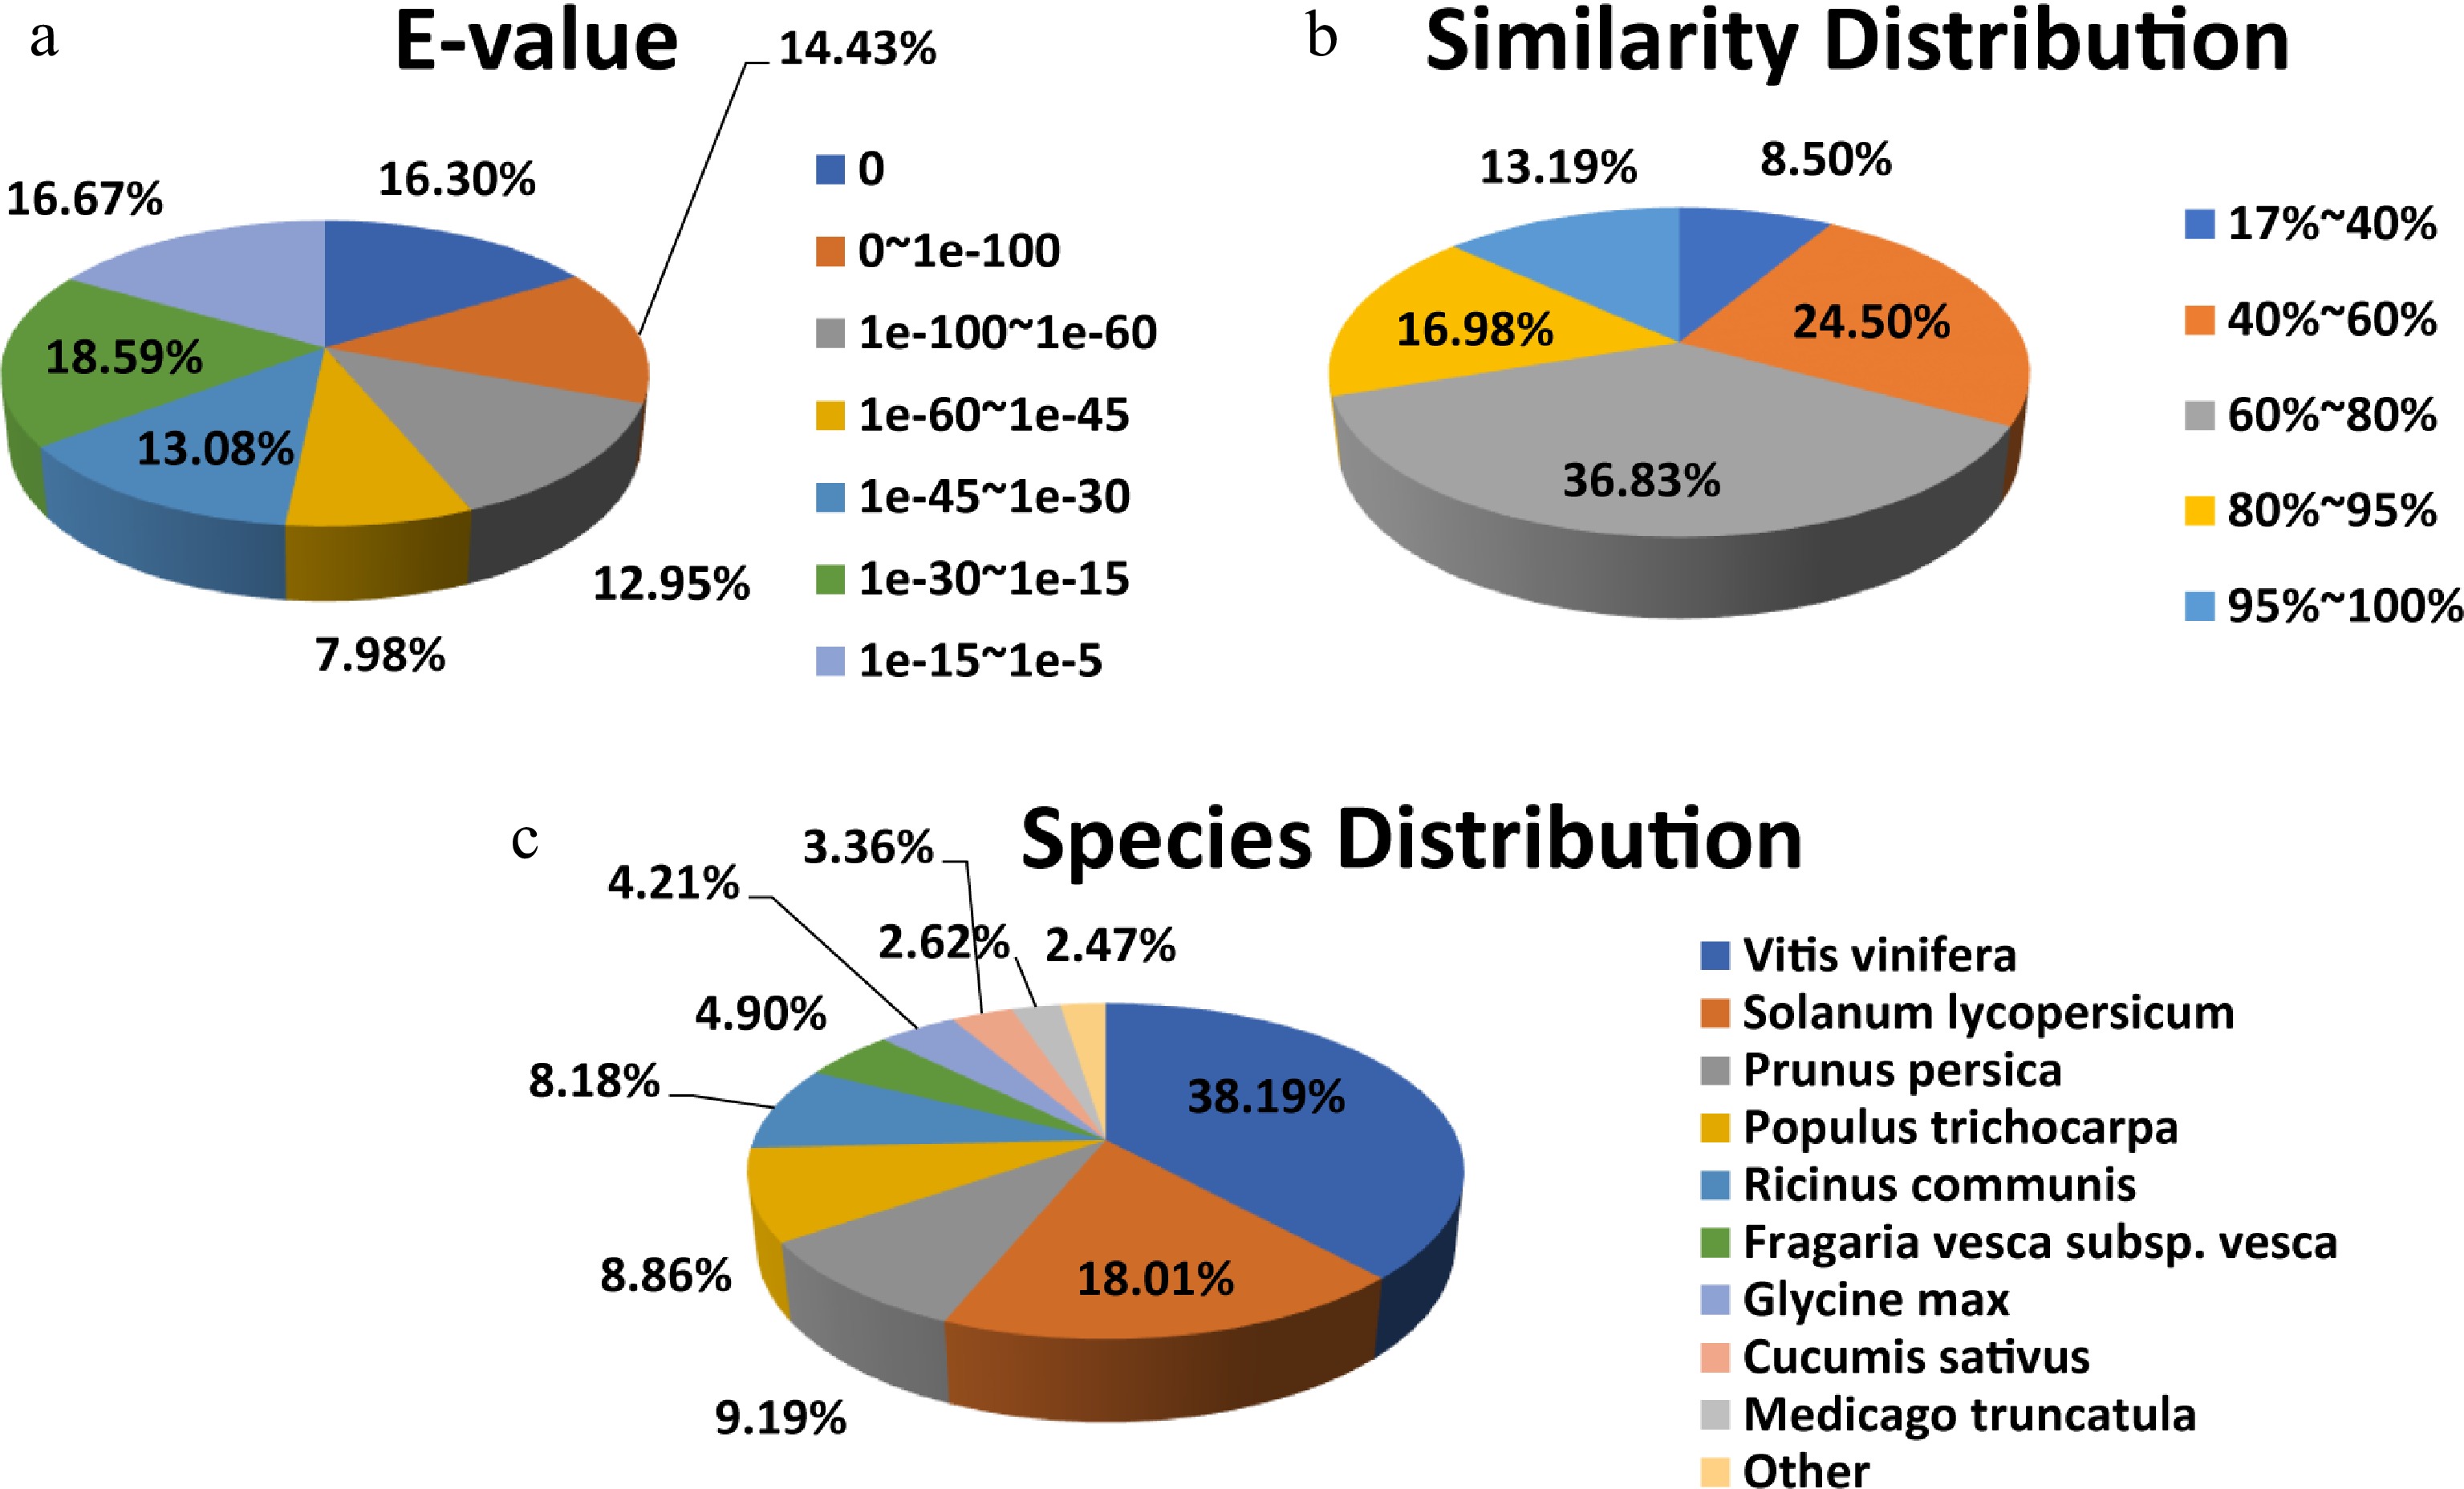
Figure 4.
NR protein sequence classification data. (a) E-value, (b) similarity, and (c) species distributions of the results of the NR annotation.
-
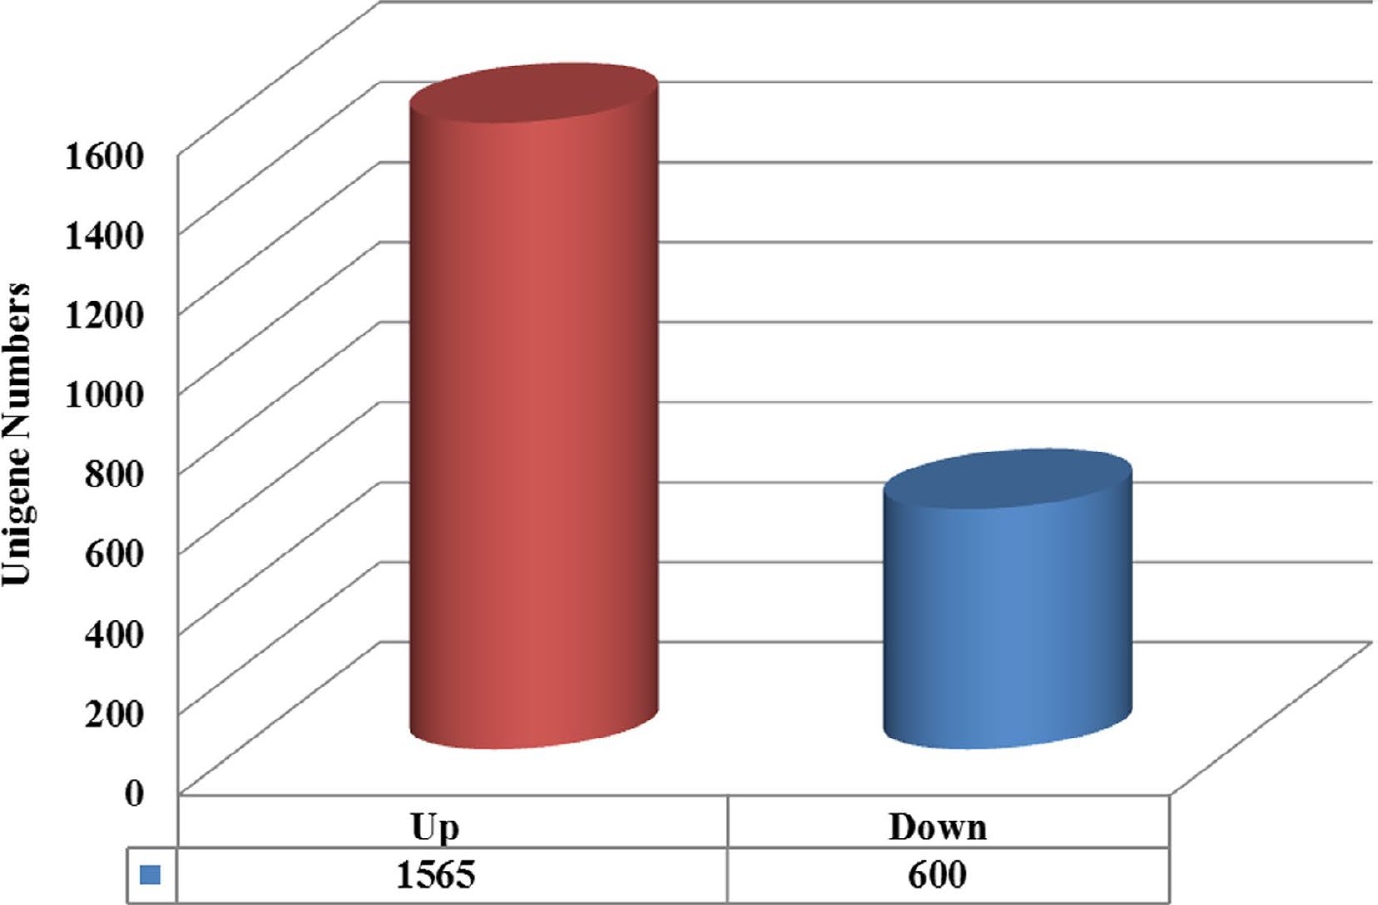
Figure 5.
Unigenes classified into expression classes. Red and blue genes are up-regulated and down-regulated, respectively.
-
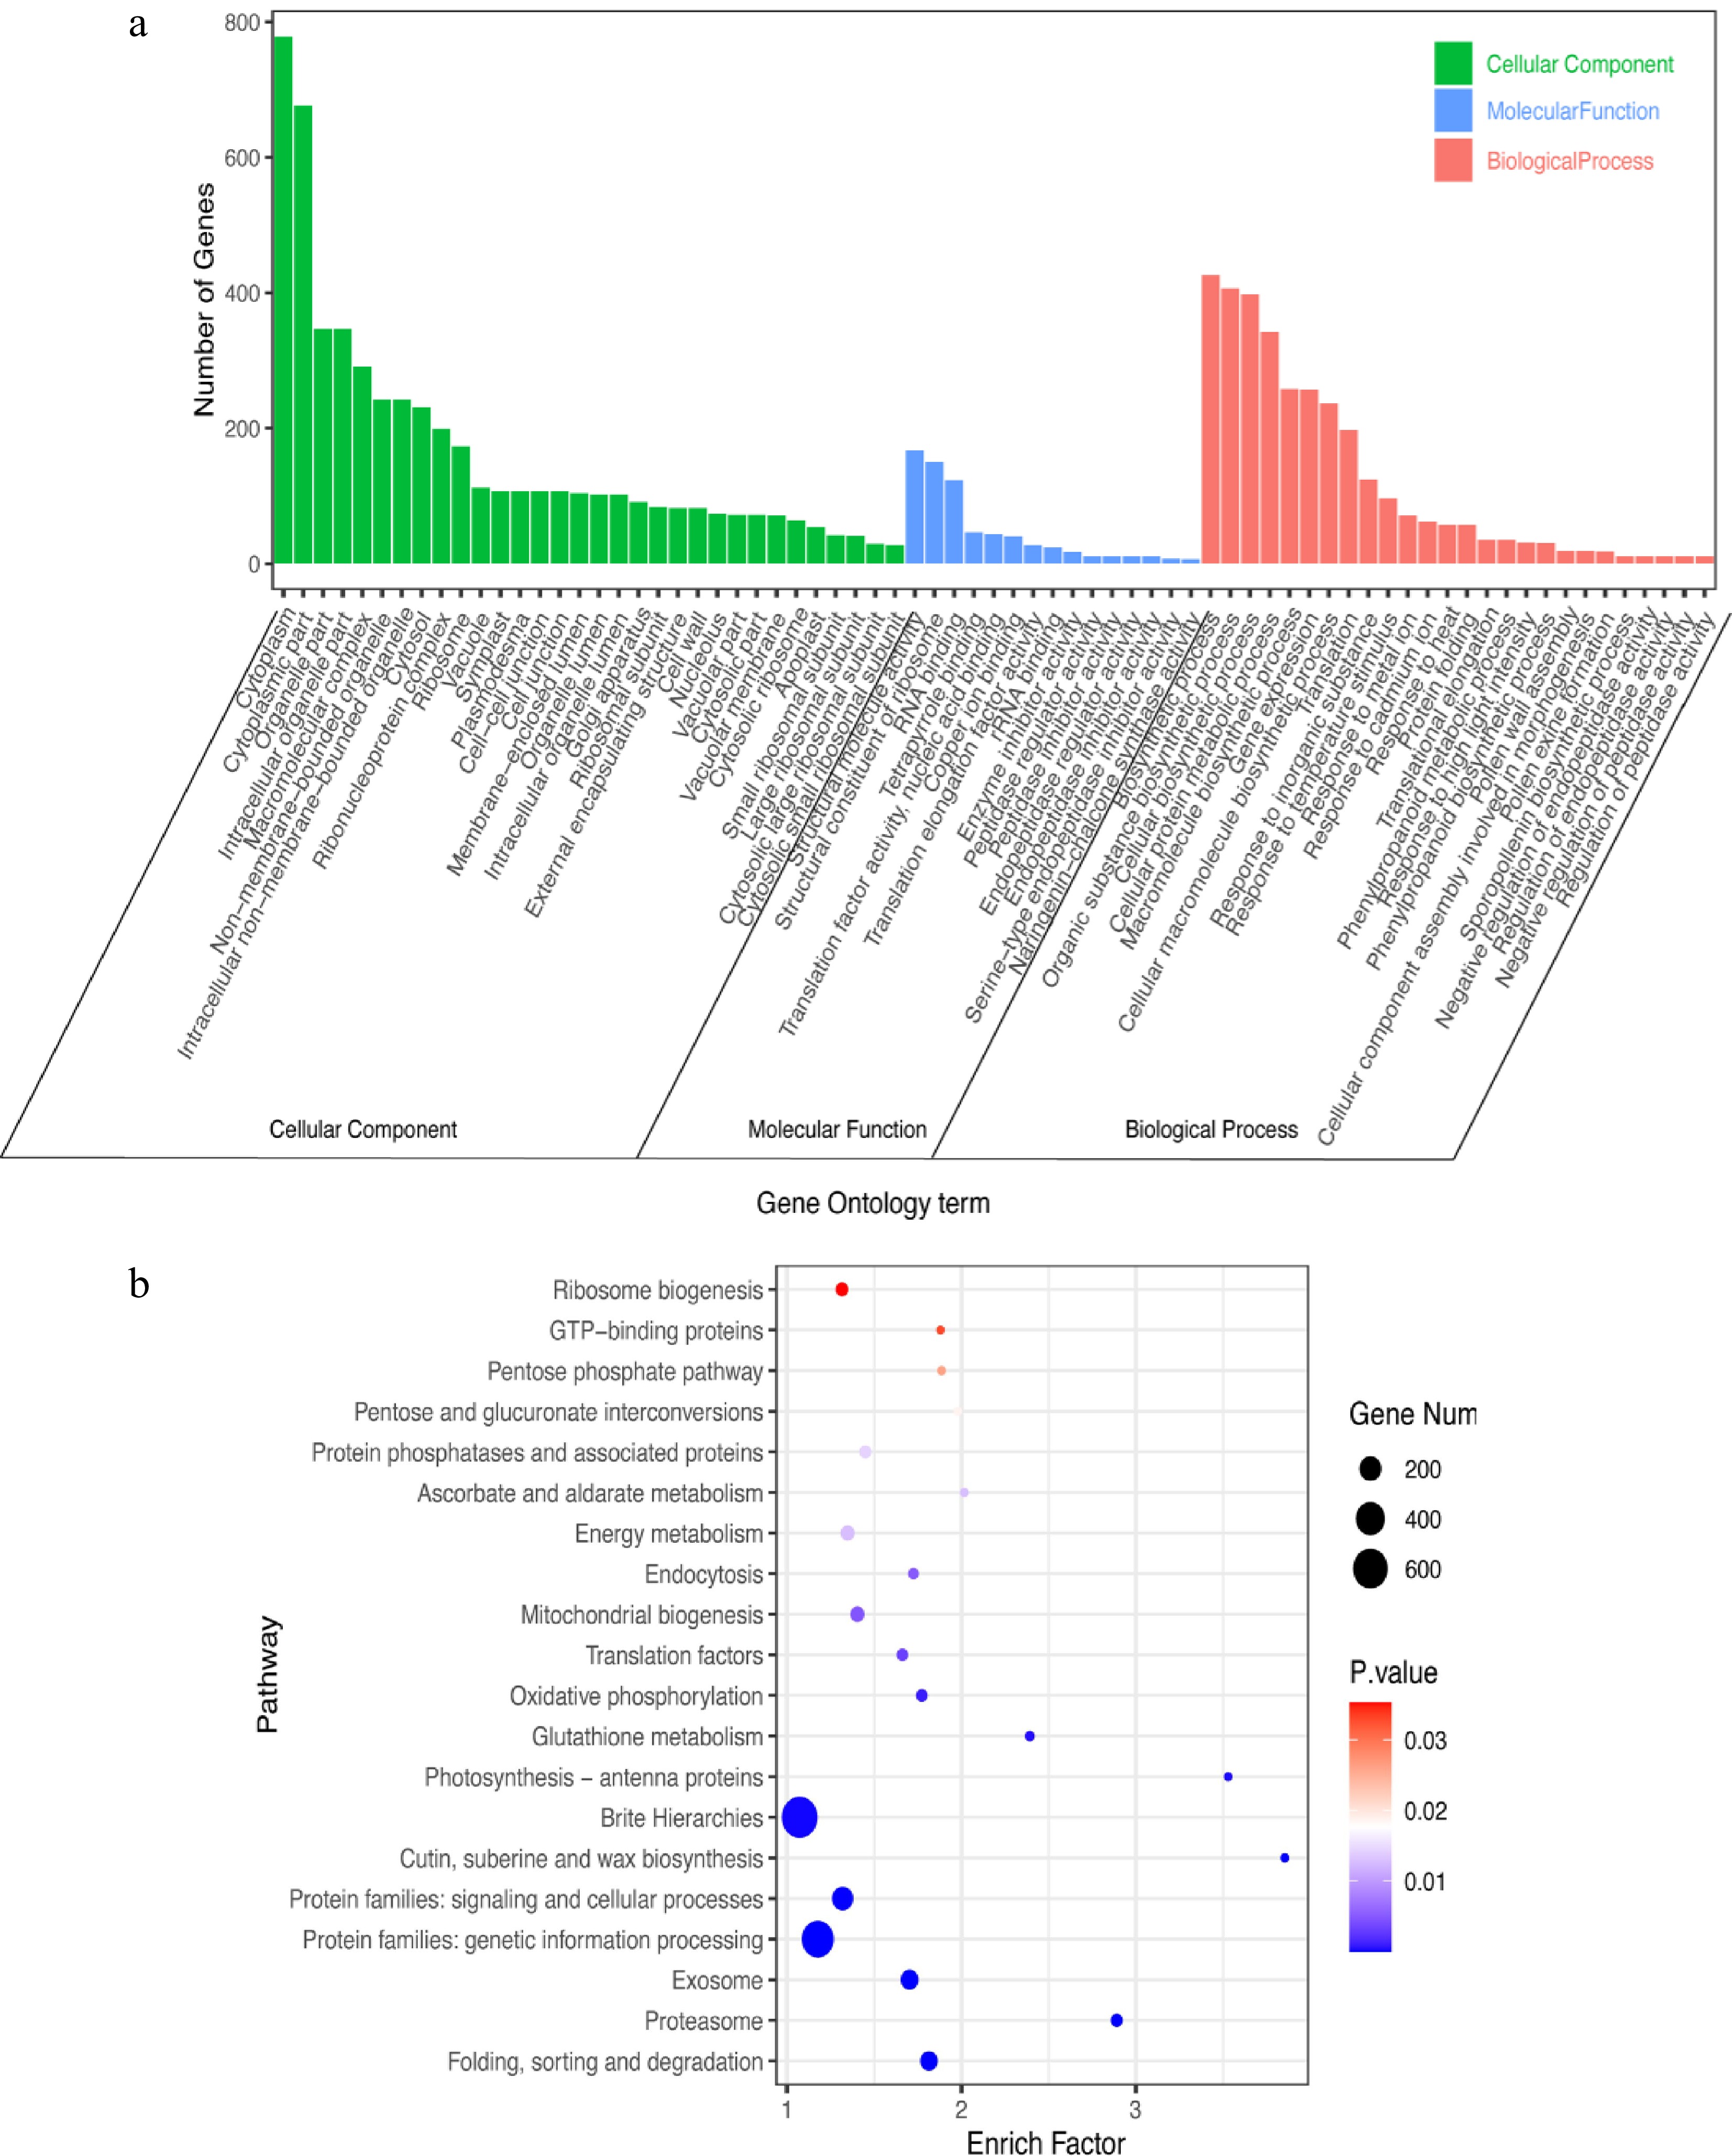
Figure 6.
GO and KEGG analyses of DEGs in C. lanuginosa under heat-shock stress conditions. (a) GO analysis, (b) KEGG analysis.
-
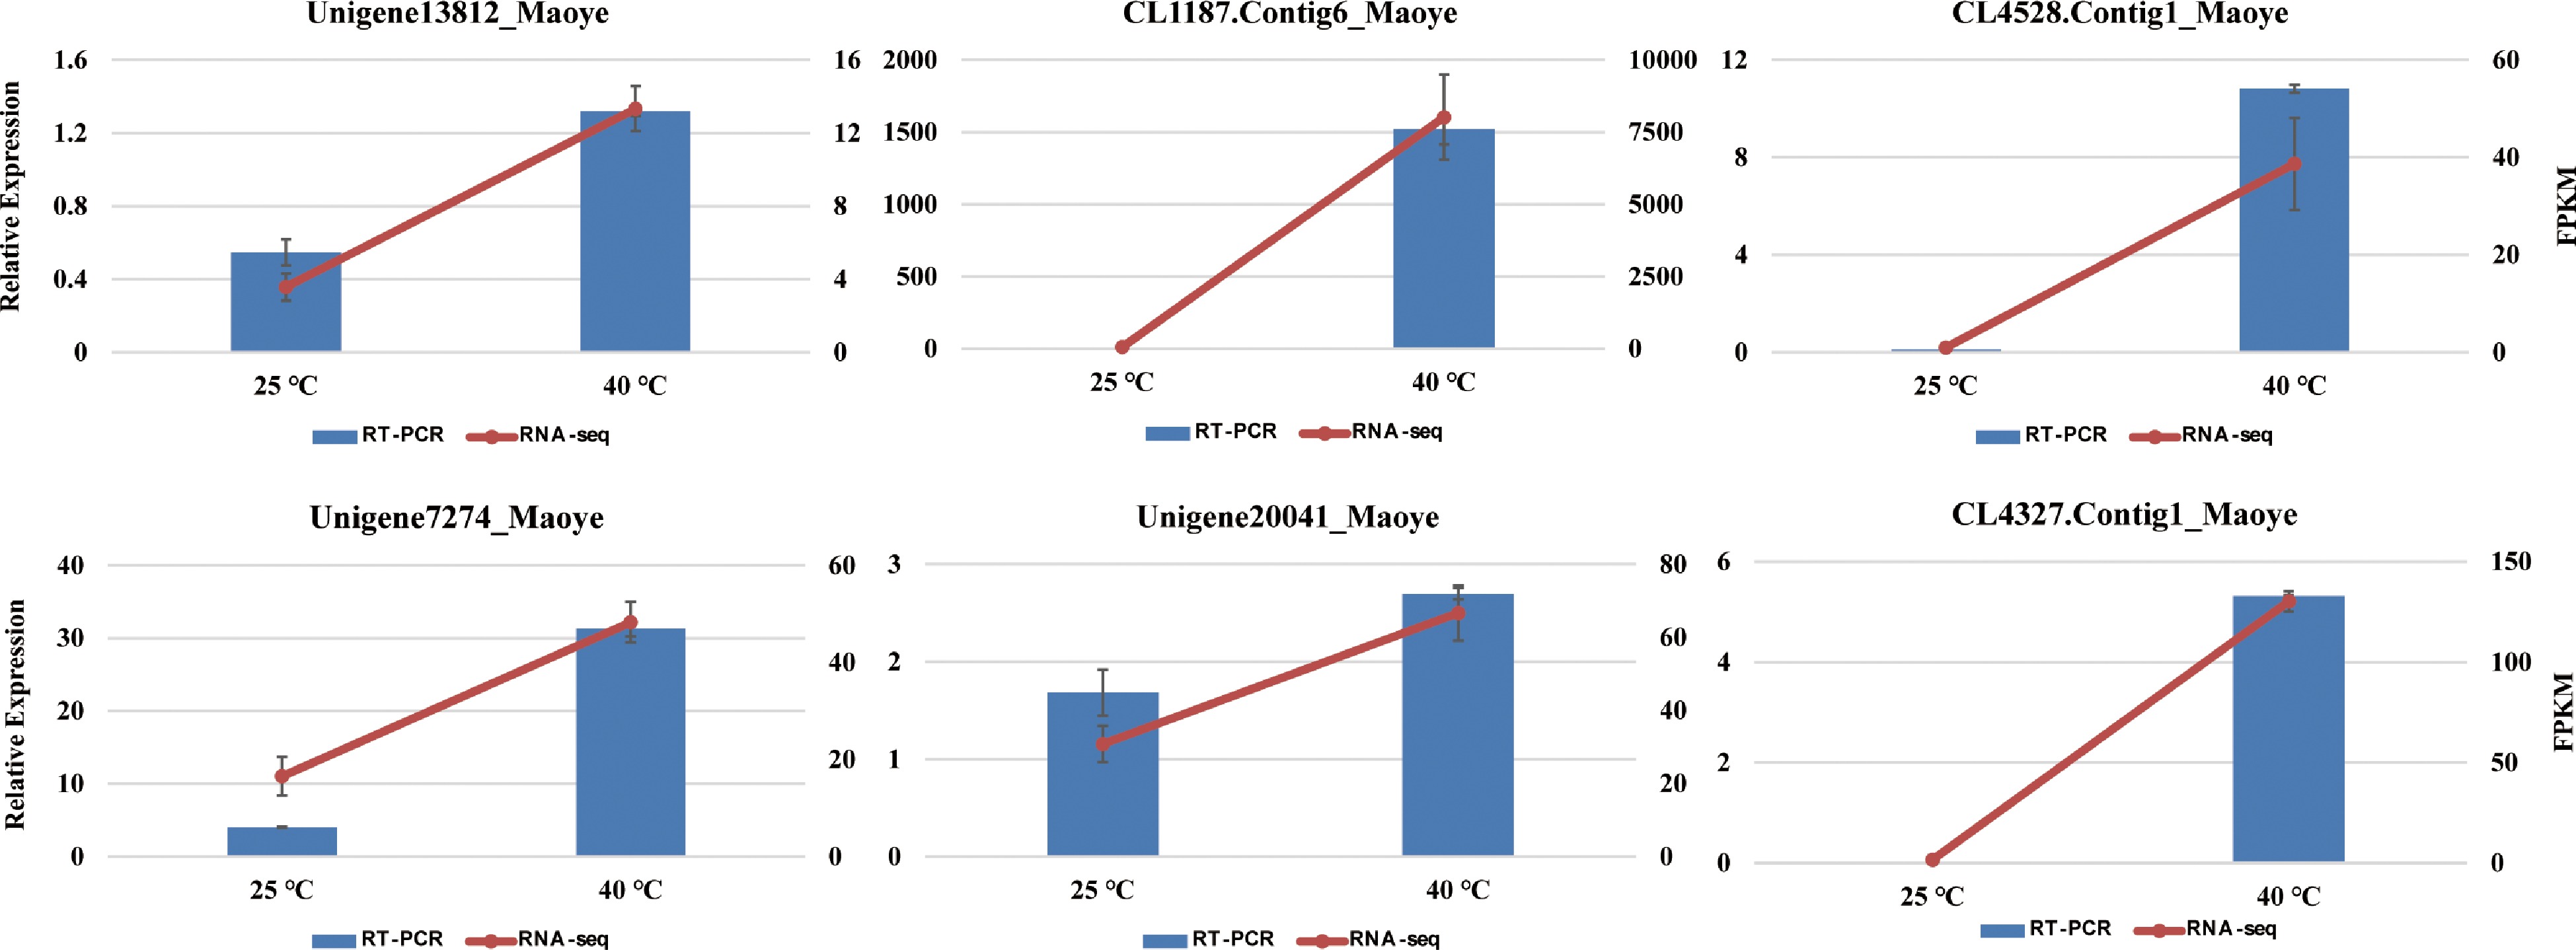
Figure 7.
The expression levels of six genes in C. lanuginosa after 0 h and 6 h under heat-shock stress conditions using quantitative real-time PCR and RNA sequencing. Data are the means ± standard errors (n = 3).
-
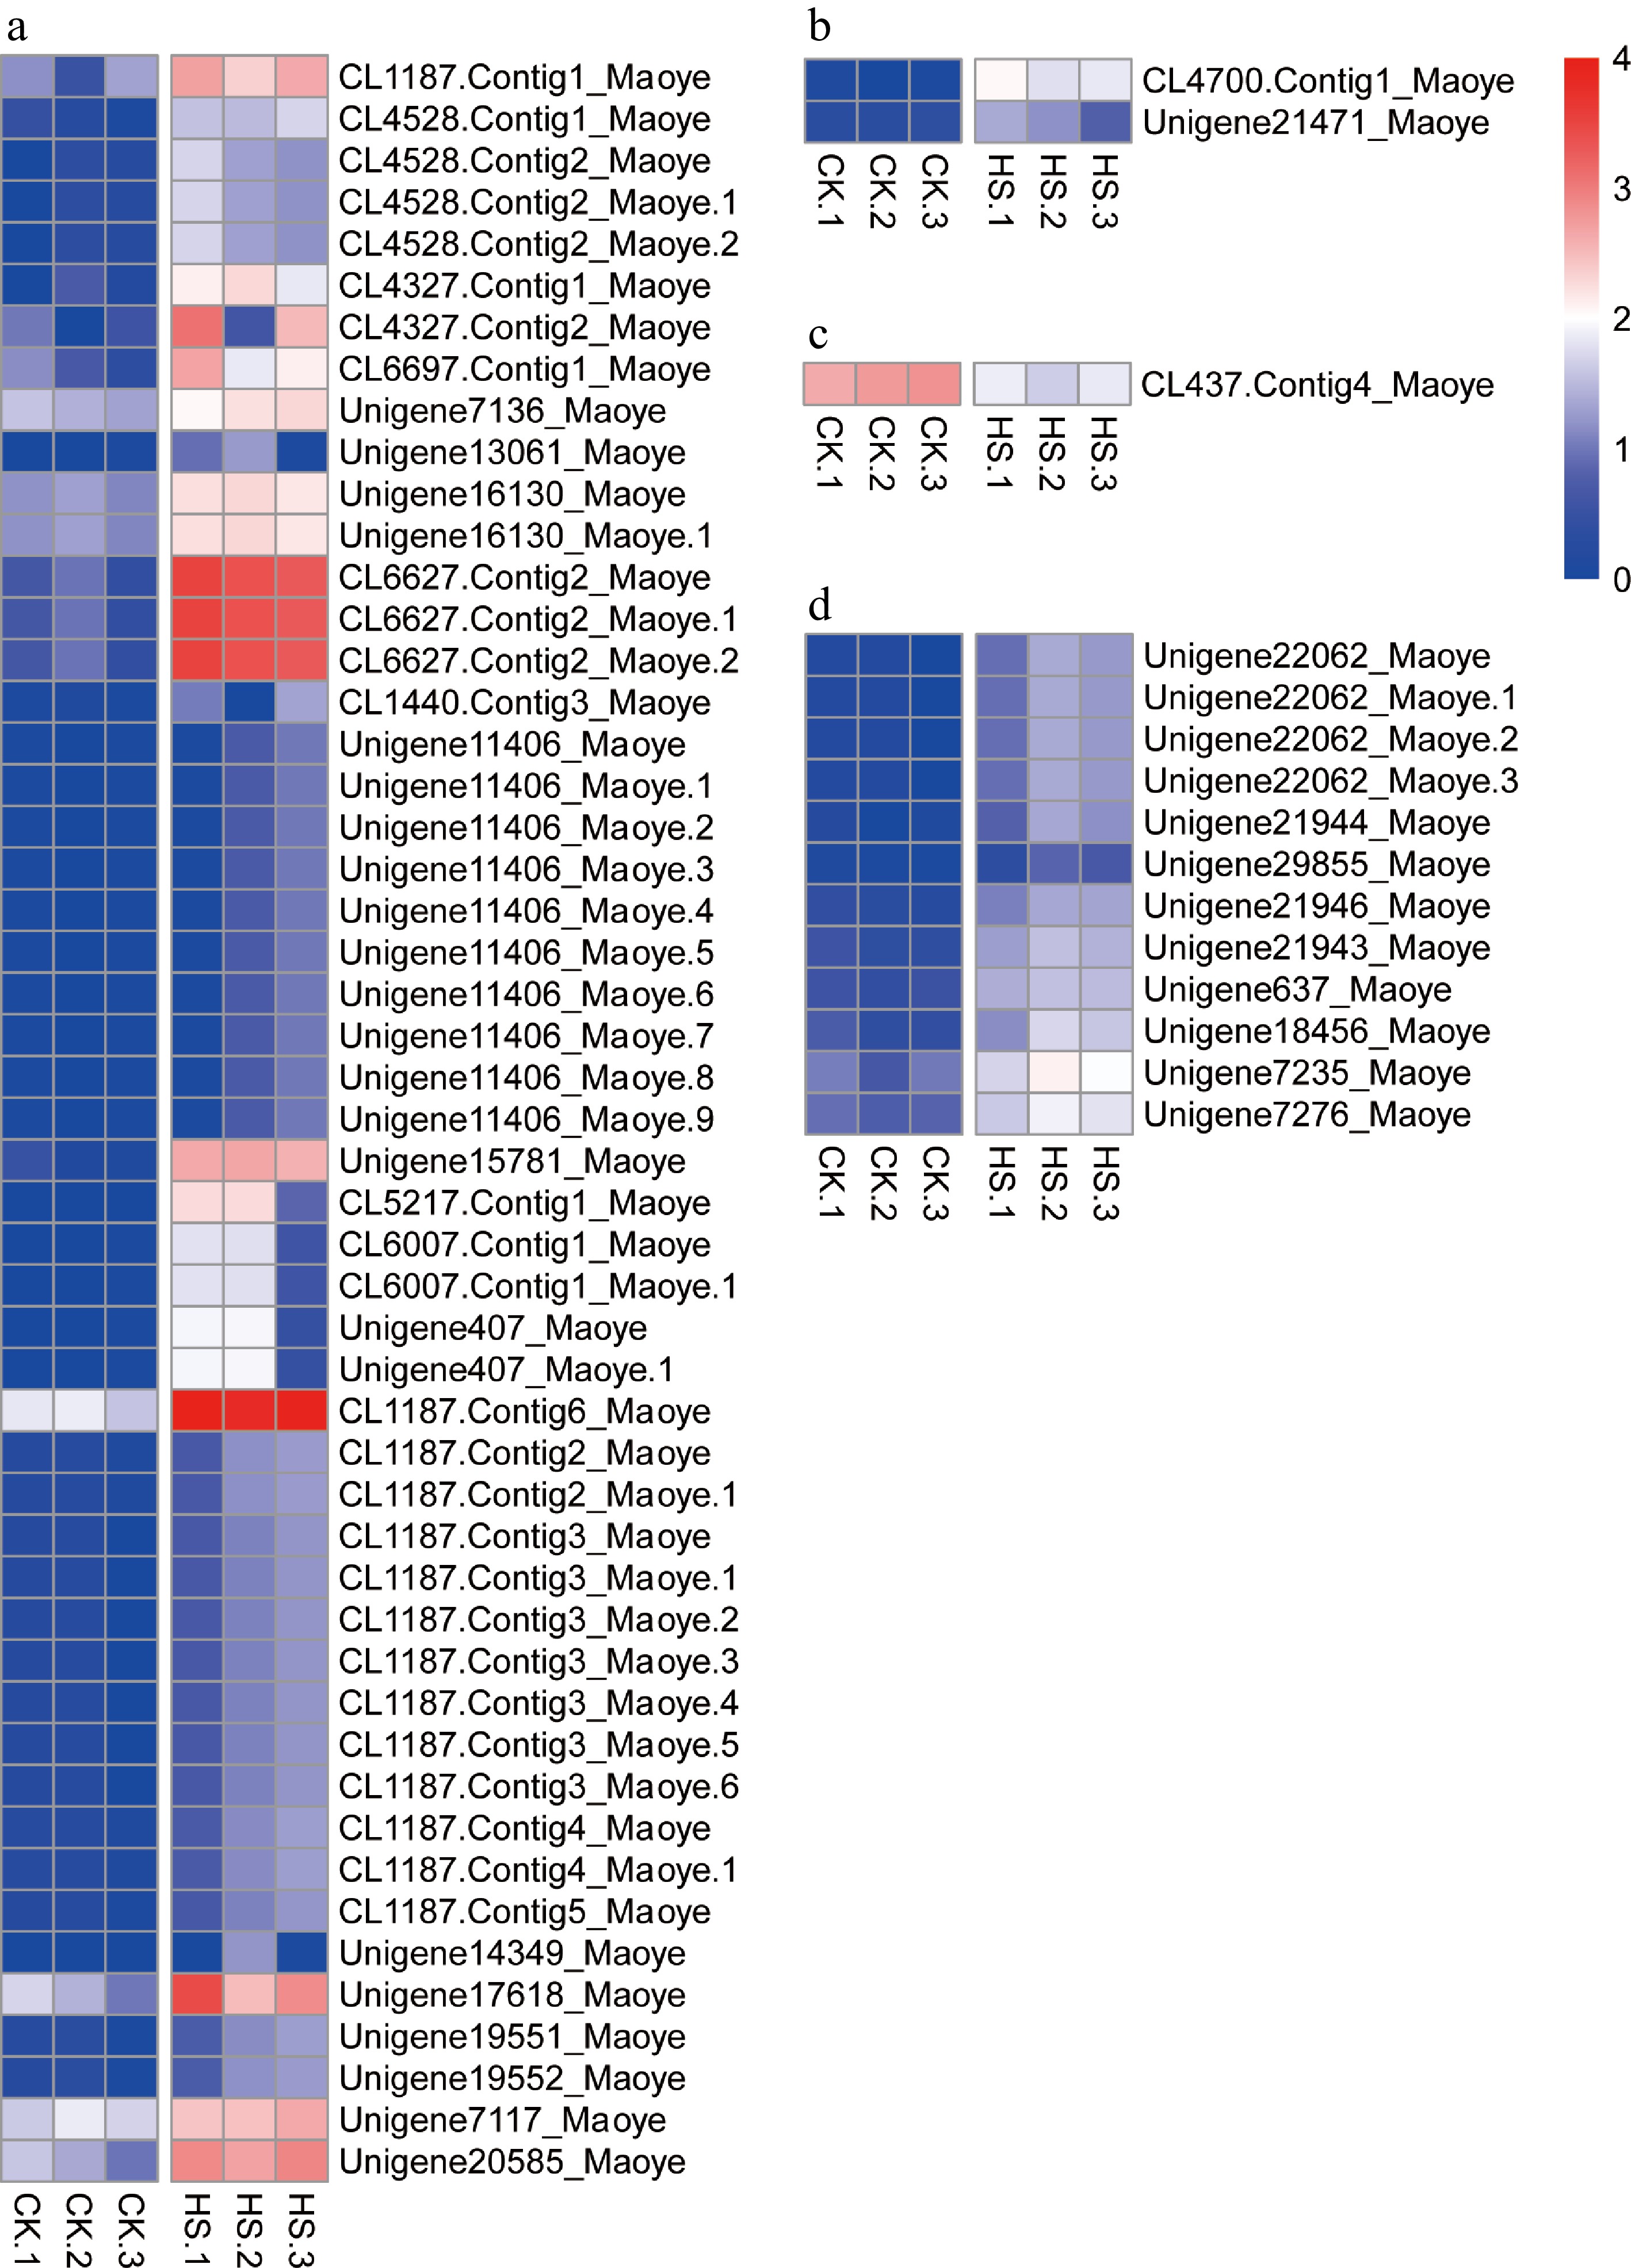
Figure 8.
Expression patterns of transcripts of heat stress-related genes. (a) Heat-shock proteins, (b) heat-shock factors, (c) heat-shock cognate 70-kDa protein 2, and (d) ribosomal proteins
-
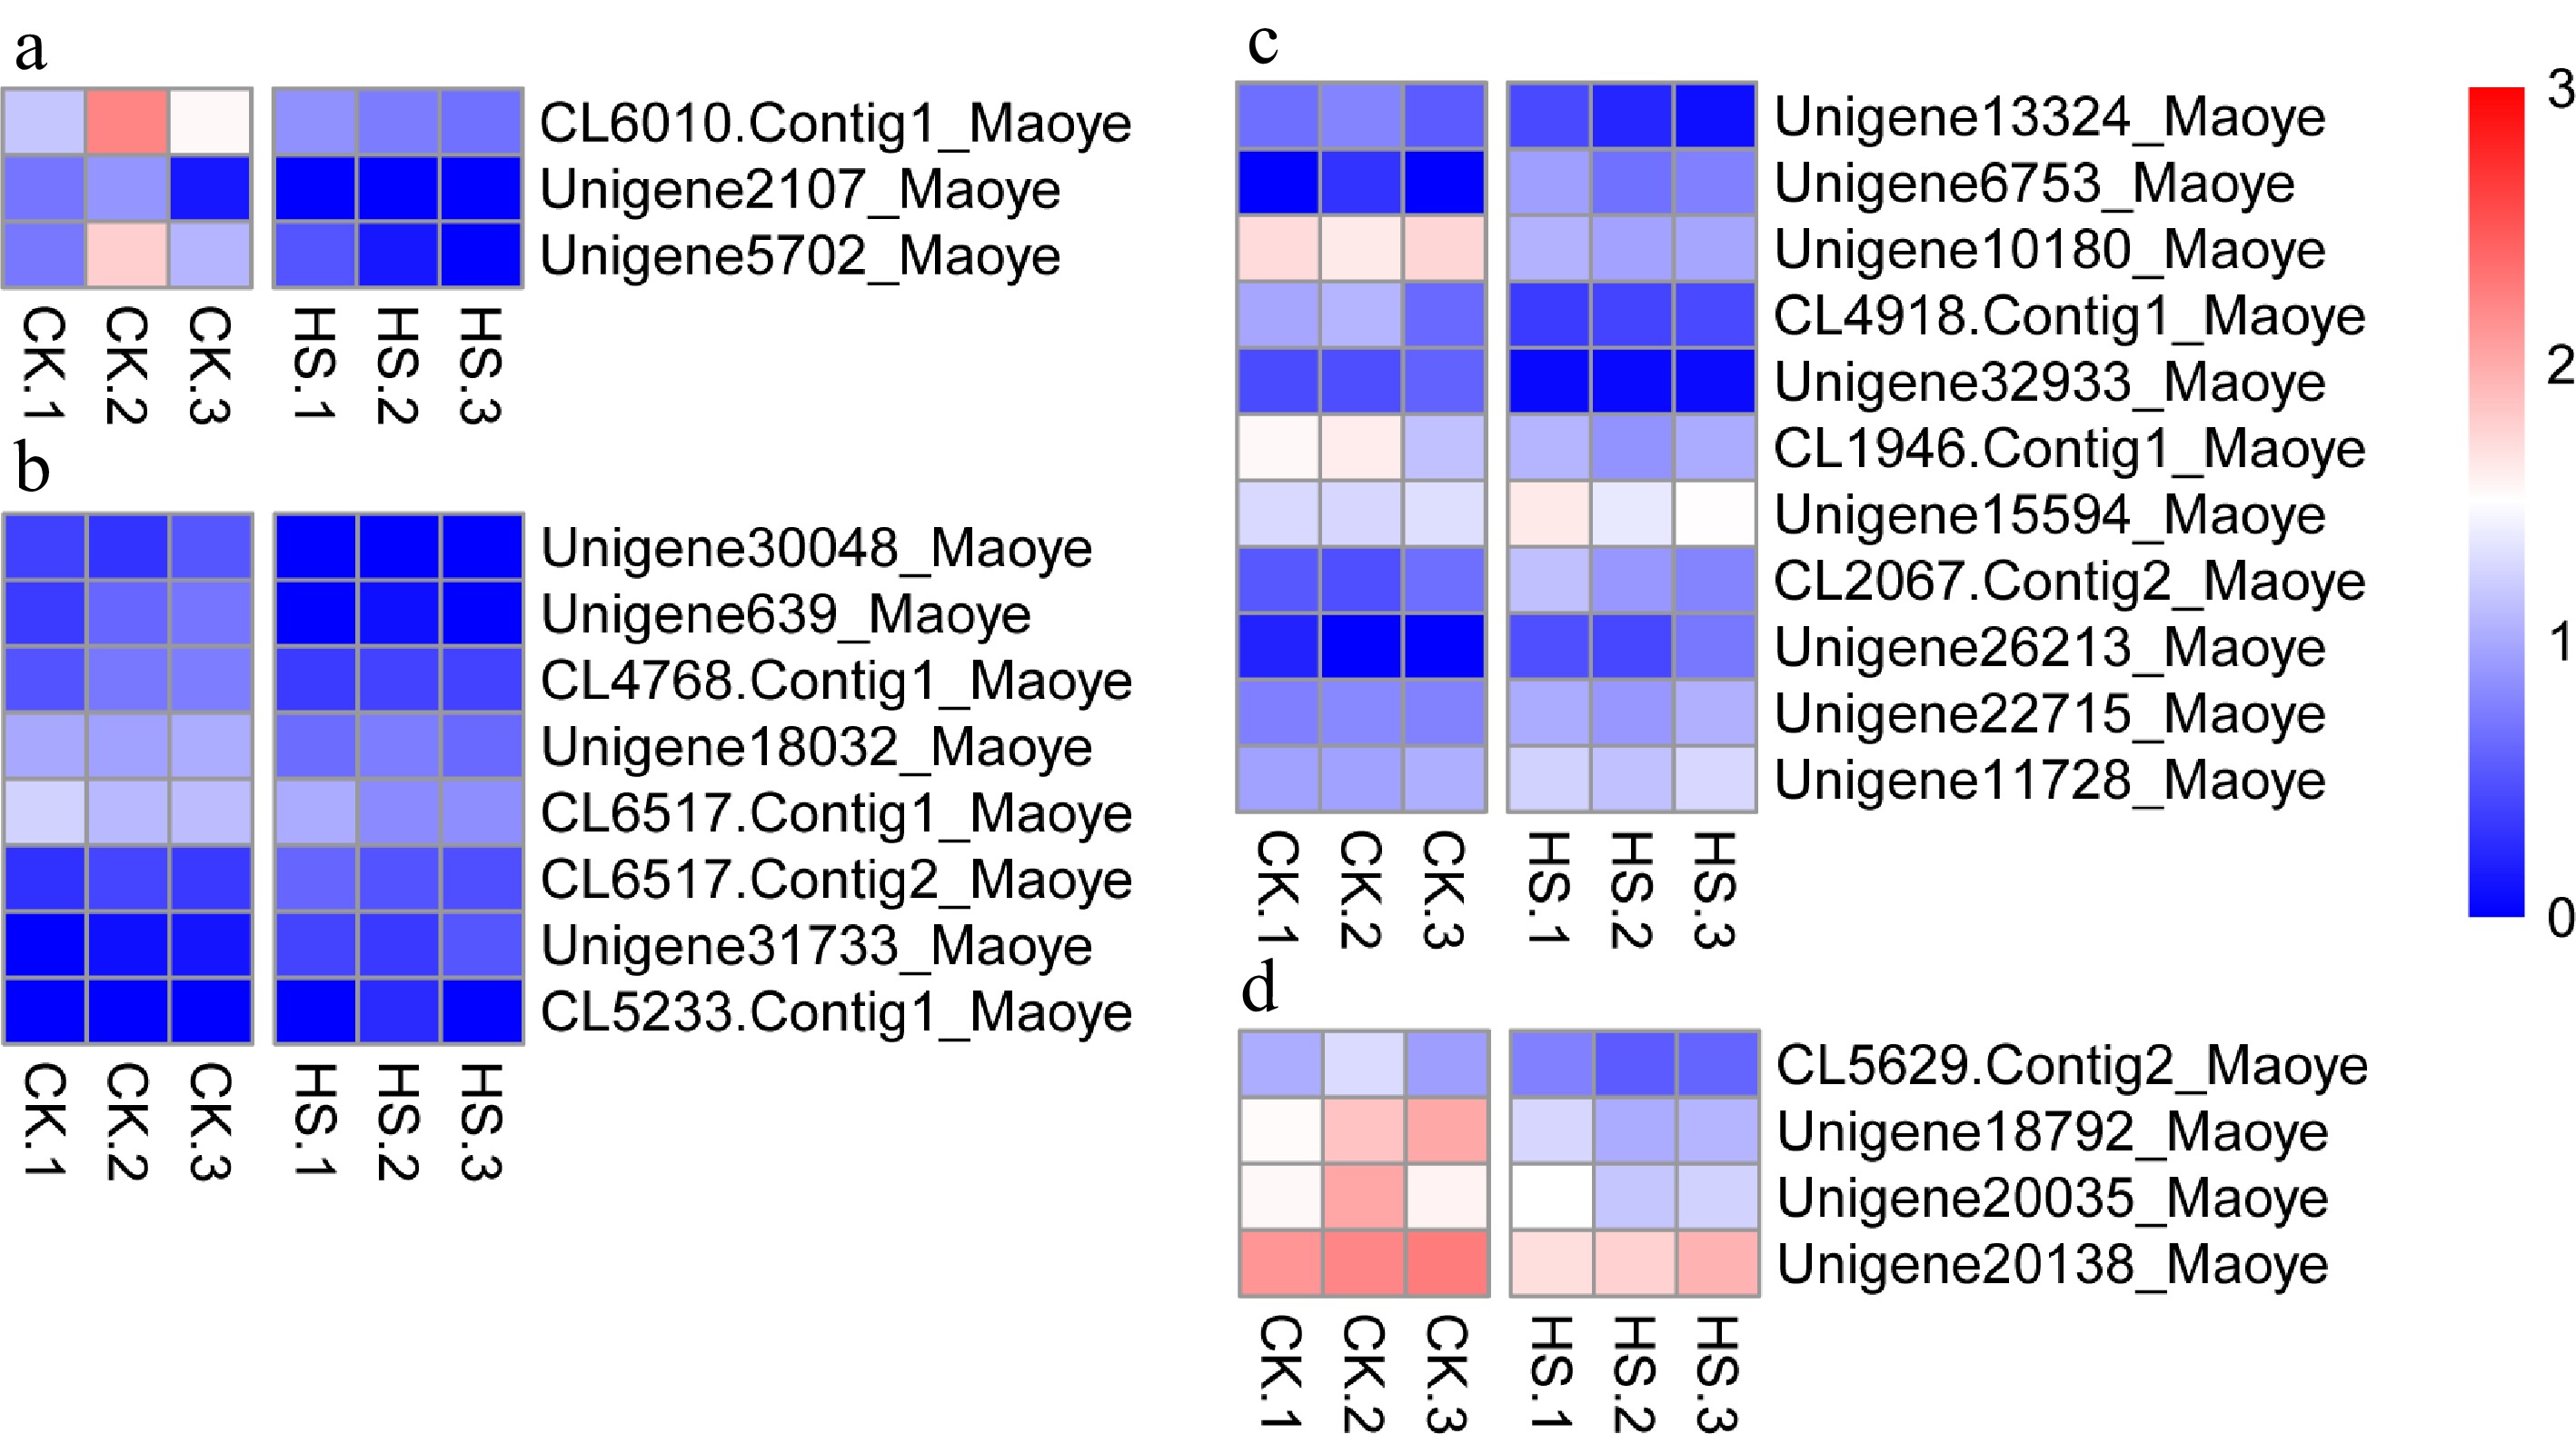
Figure 9.
Differentially expressed genes in C. lanuginosa. (a) Chalcone synthase, (b) Cysteine-rich receptor-like kinase, (c) Ethylene-responsive transcription factor and (d) Aspartic protease in guard cell.
-
Sample name Clean reads Clean nucleotides (nt) Q20 (%) GC (%) D1 44,162,202 6,624,330,300 97.13% 47.96% D2 45,831,590 6,874,738,500 97.15% 46.69% D3 42,150,716 6,322,607,400 96.48% 47.18% G1 37,019,248 5,552,887,200 96.76% 46.38% G2 38,617,540 5,792,631,000 96.60% 48.10% G3 41,689,550 6,253,432,500 96.35% 47.03% Total 249,470,846 37,420,626,900 *Q20 percentage is the proportion of nucleotides with a mass value greater than 20; GC percentage is the proportion of guanidine and cytosine nucleotides in total nucleotides. Table 1.
Statistics for C. lanuginosa library sequences generated under 25 °C and 40 °C conditions.
-
Sequence NR NT Swiss-Prot KEGG COG GO ALL All-Unigene 40,719 30,237 27,706 25,033 16,684 30,722 42,377 Percentage
(%)65.60 48.71 44.64 40.33 26.88 49.50 68.27 Table 2.
C. lanuginosa database annotations of sequences generated under heat-shock stress conditions.
Figures
(9)
Tables
(2)