-
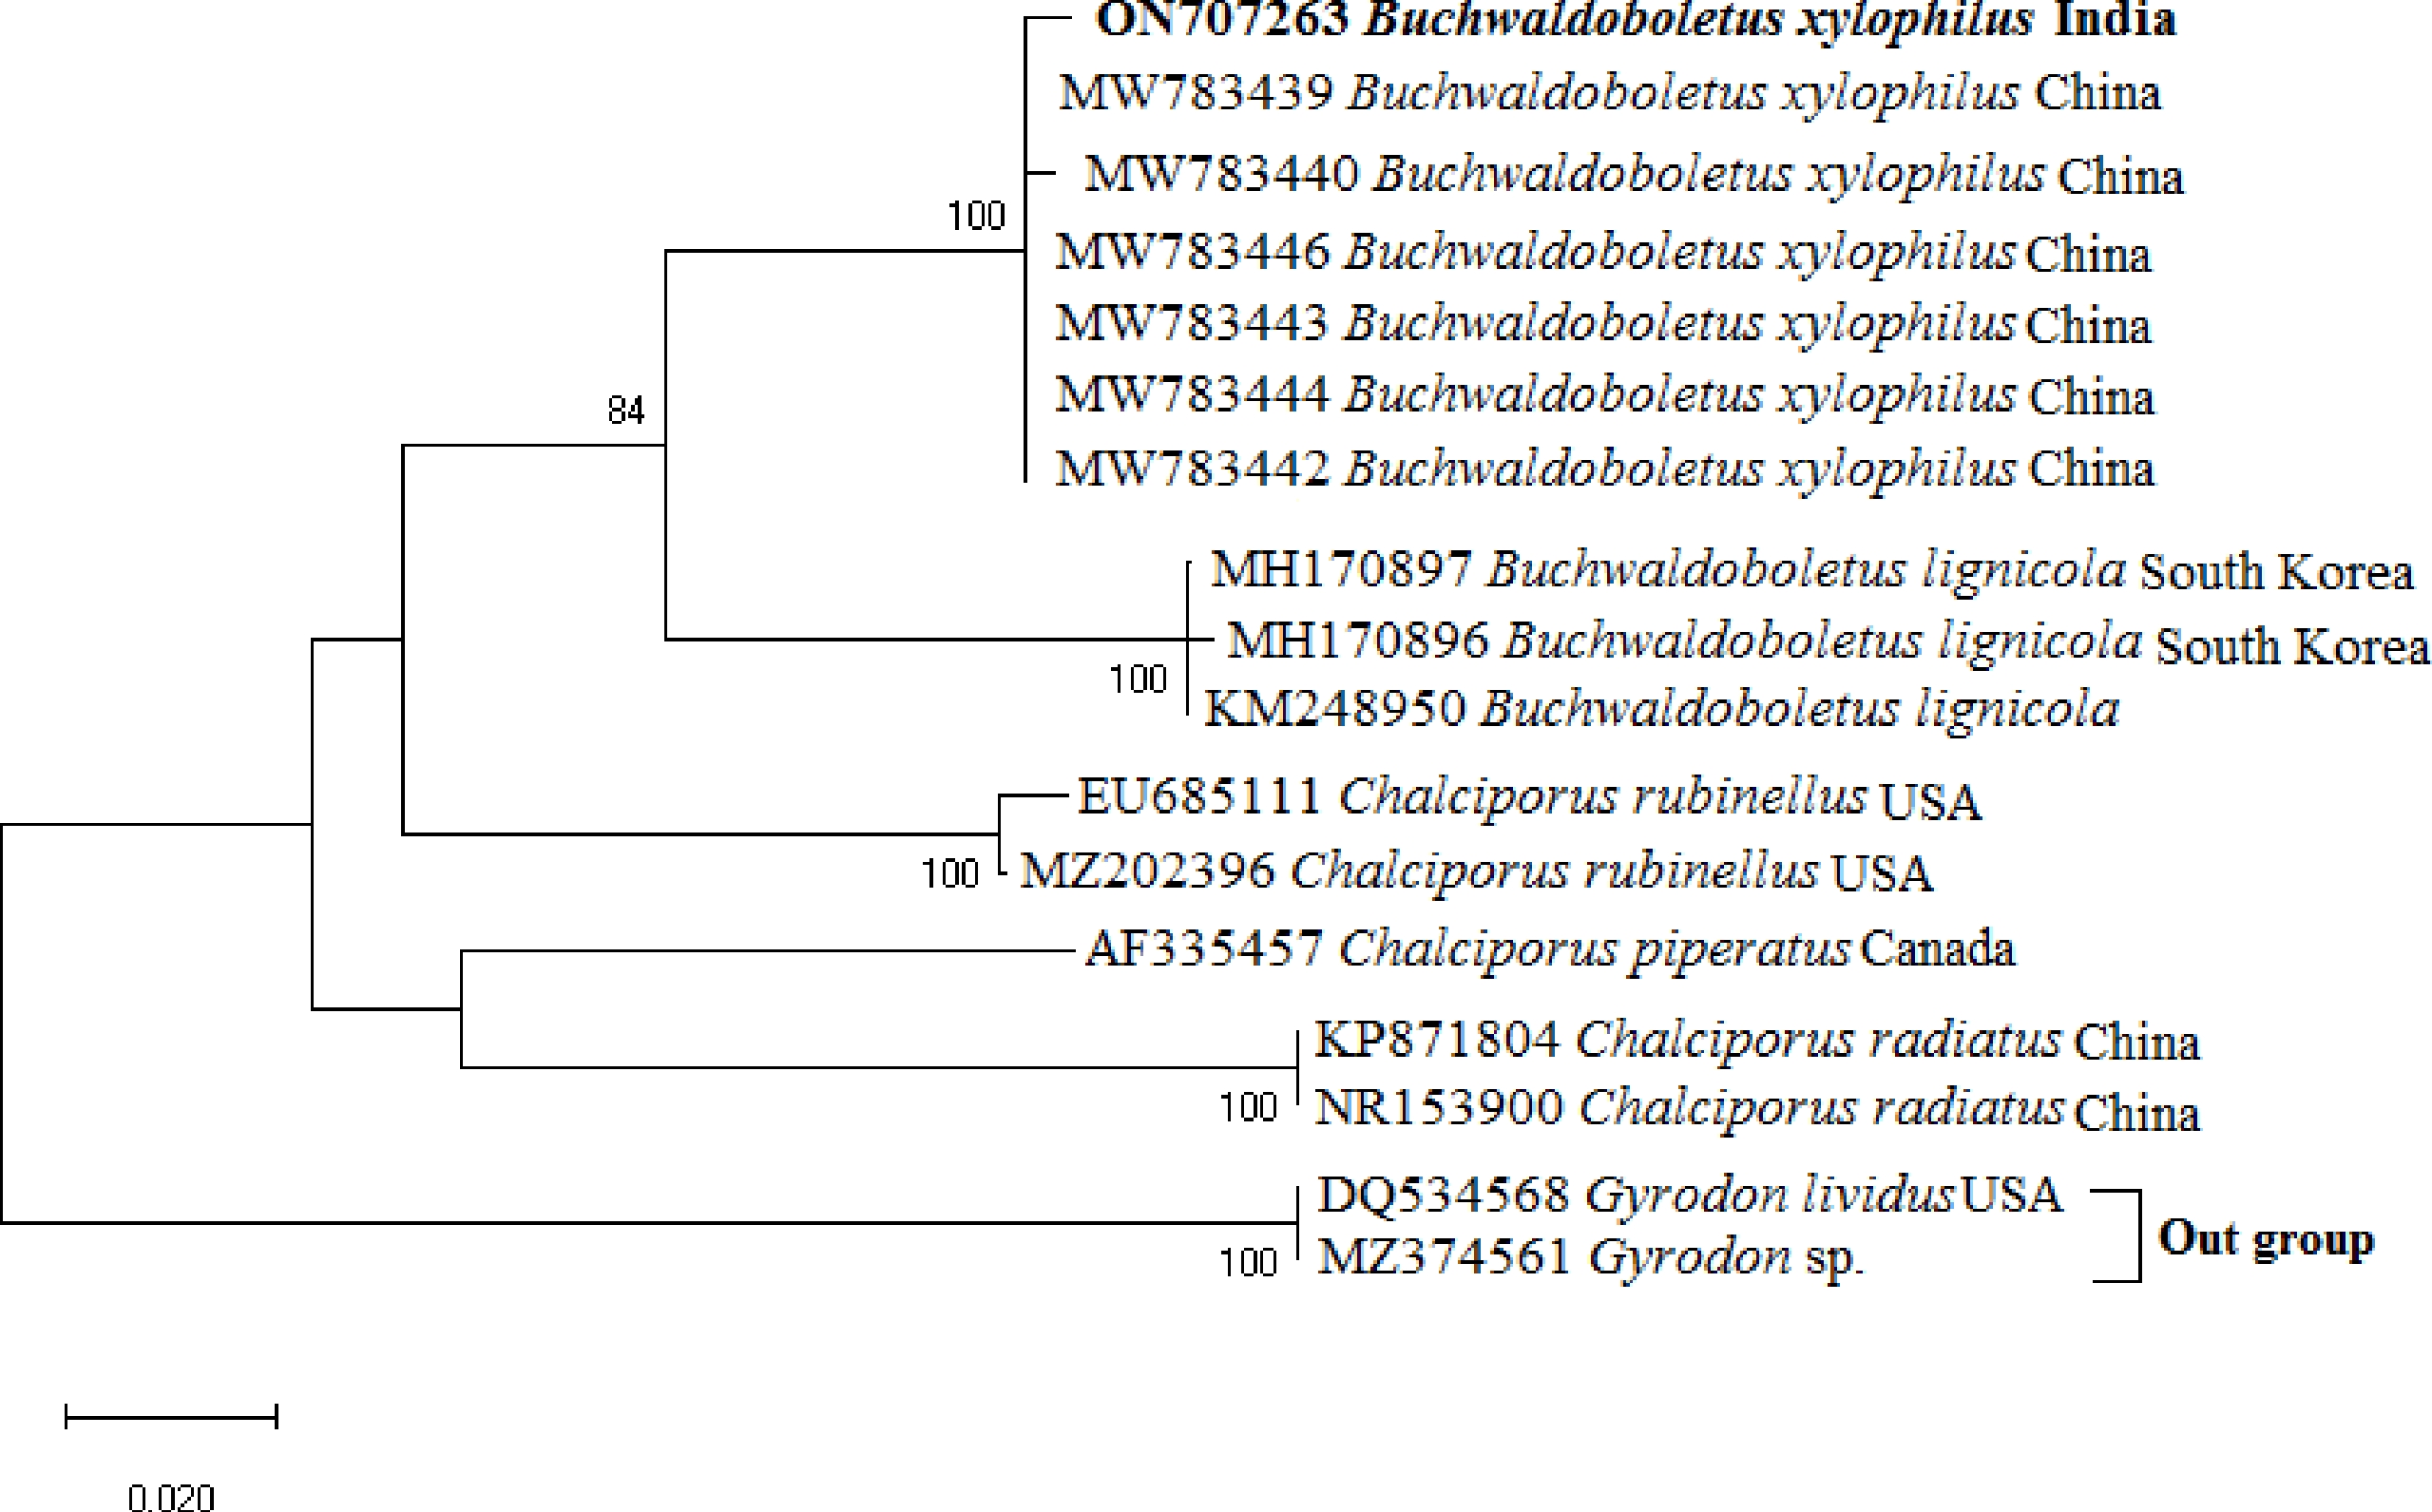
Figure 1.
Maximum likelihood tree generated from ITS sequence data. ML values greater than 50% are indicated above/below branches. The newly generated ITS sequence of the strain from this study is shown in bold letters. GenBank accession numbers of all taxa are shown.
-
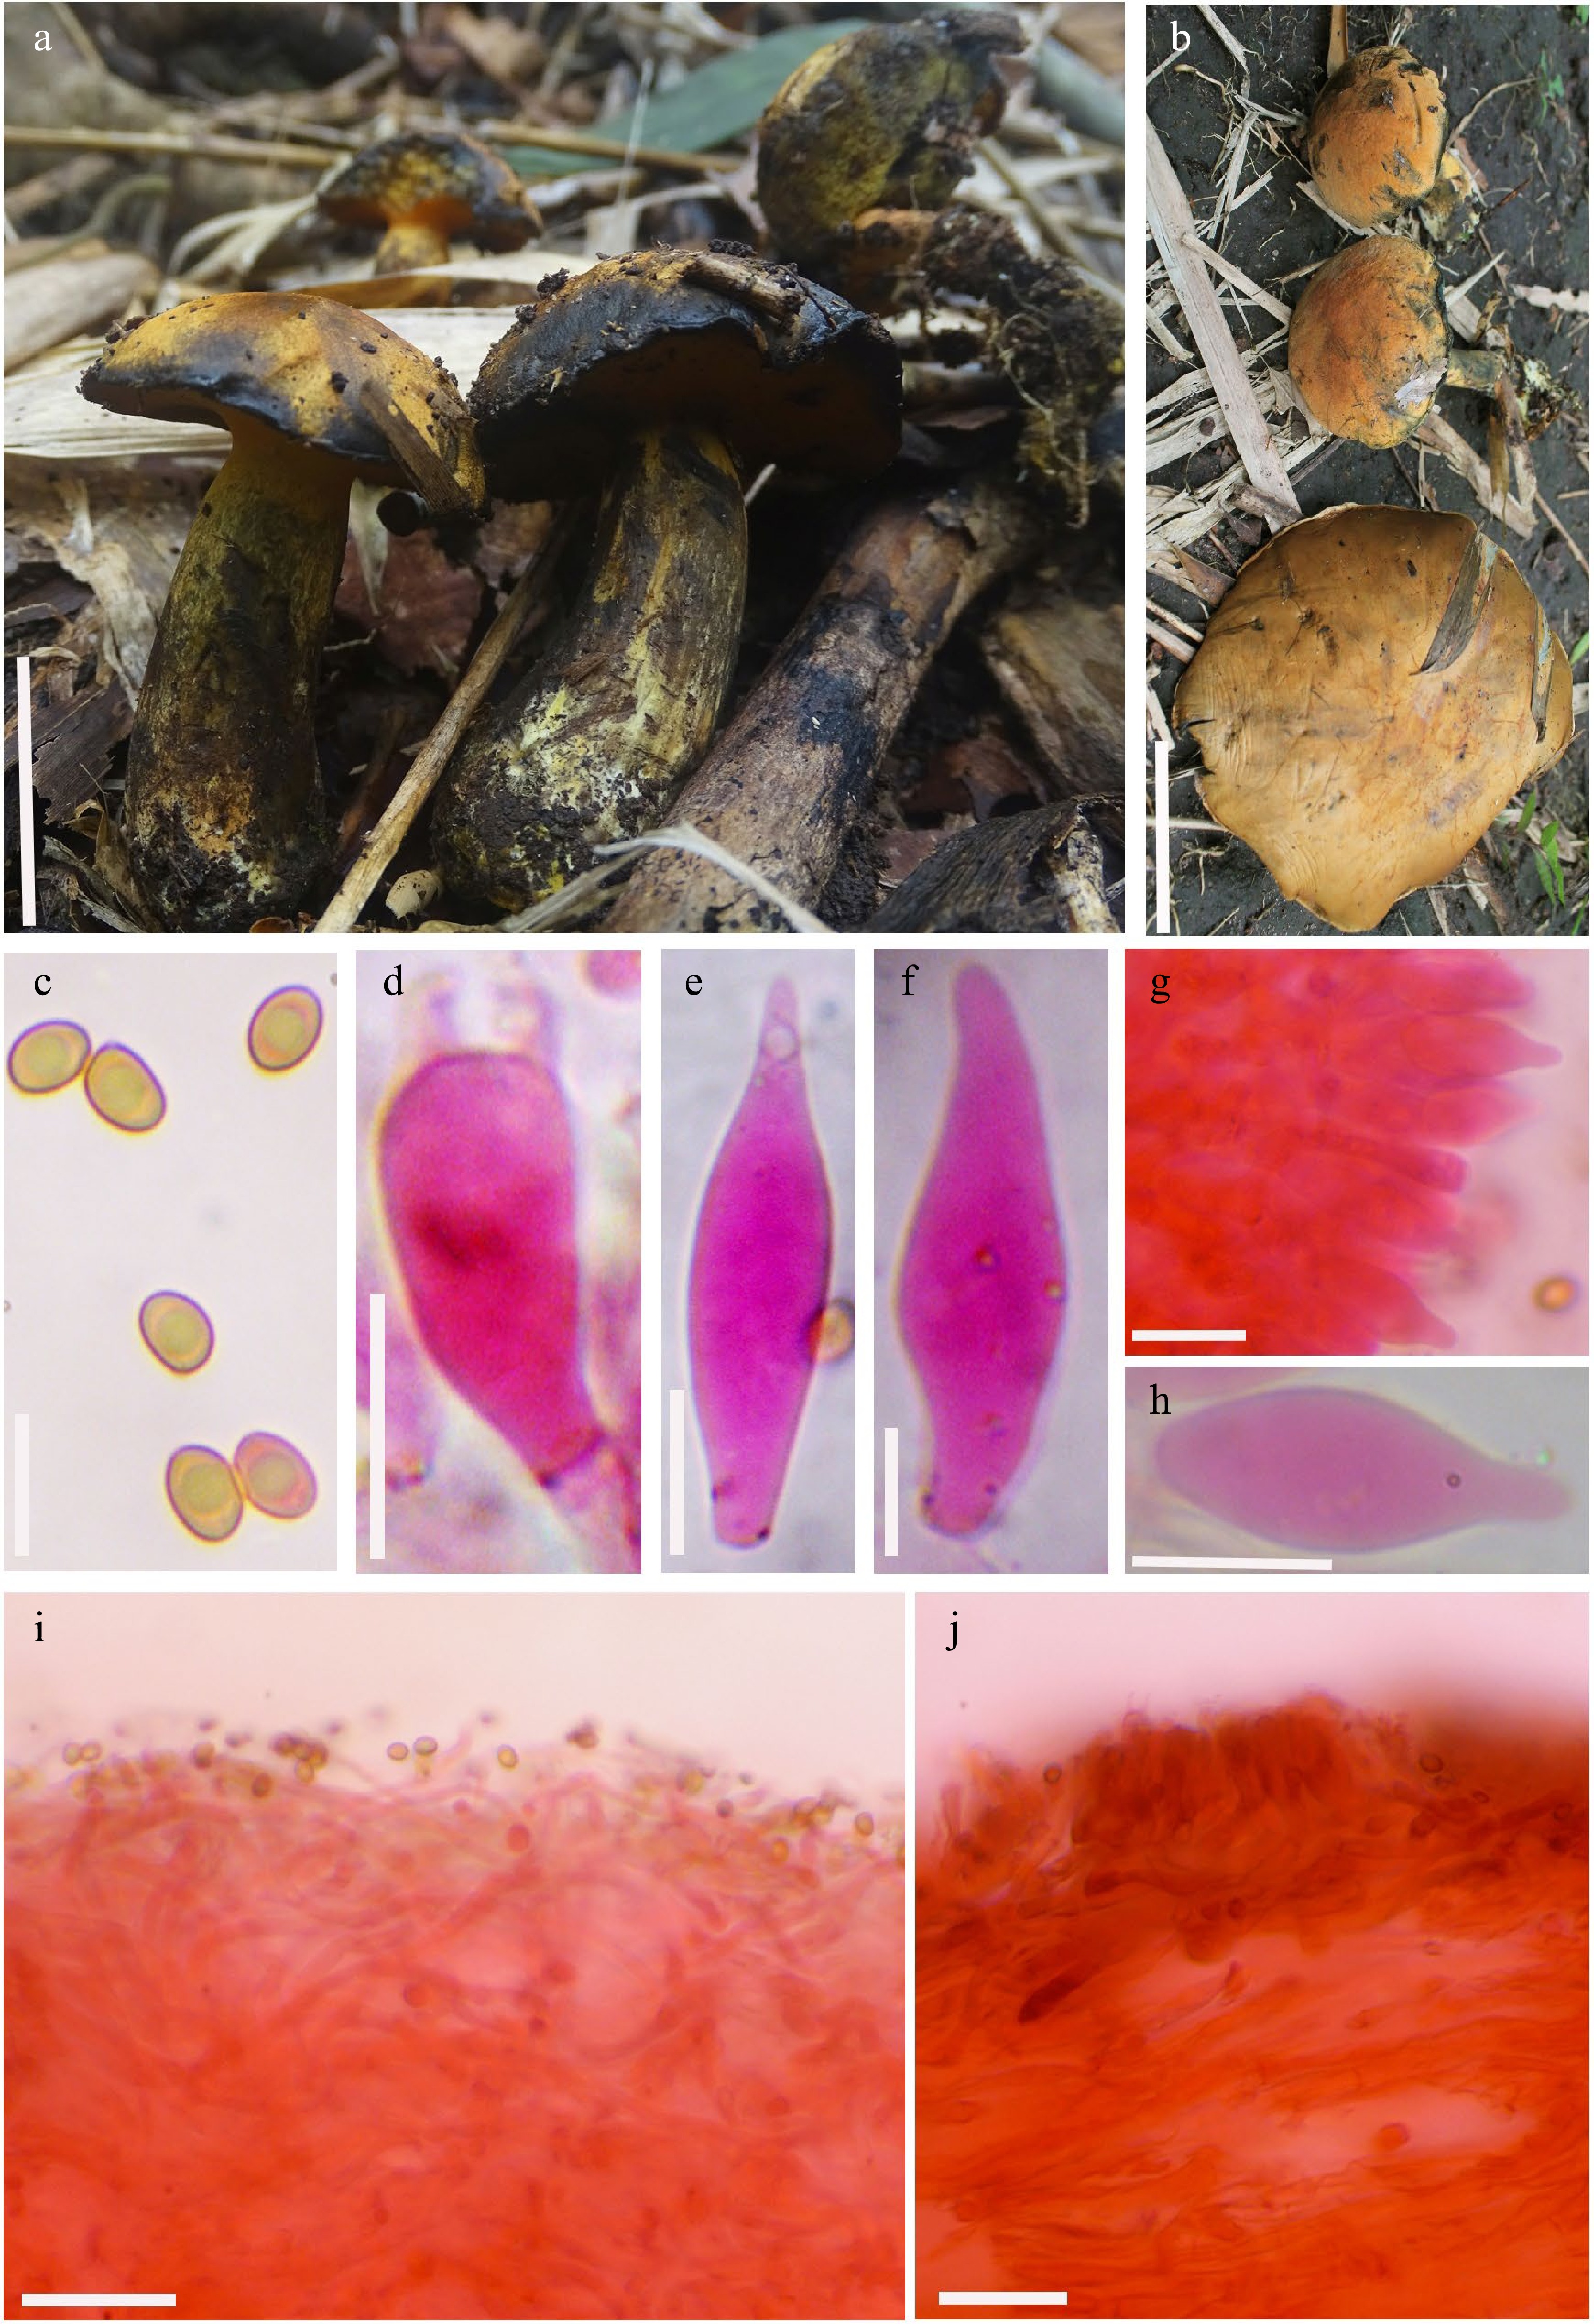
Figure 2.
Buchwaldoboletus xylophilus. (a), (b) Basidiomata. (c) Basidiospores. (d) Basidium. (e), (f) Pleurocystidia. (g), (h) Cheilocystidia. (i) Pileipellis. (j) Stipitipellis. Scale bars: (a) = 3 cm, (b) = 5 cm, (c)-(h) = 10 μm, (i), (j) =20 μm.
Figures
(2)
Tables
(0)